Newcastle-under-Lyme (UK Parliament constituency)
Newcastle-under-Lyme is a constituency[n 1] in northern Staffordshire created in 1354 and represented in the House of Commons of the UK Parliament since 2019 by Aaron Bell of the Conservative Party.[n 2] It was the last to be co-represented by a member of the Conservative Party when it was dual-member, before the 1885 general election which followed the Redistribution of Seats Act 1885 coupled with the Reform Act 1884. In 1919 the local MP, Josiah Wedgwood, shifted his allegiance from the Liberal Party — the Lloyd George Coalition Liberals allying with the Conservatives — to the Labour Party and the seat elected the Labour candidate who has stood at each election for the next hundred years, a total of 29 elections in succession. Labour came close to losing the seat in 1969, 1986, 2015 and 2017, and eventually lost the seat in 2019.
| Newcastle-under-Lyme | |
|---|---|
| Borough constituency for the House of Commons | |
 Boundary of Newcastle-under-Lyme in Staffordshire | |
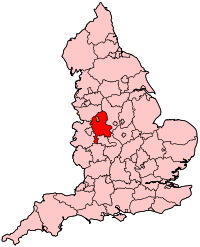 Location of Staffordshire within England | |
| County | Staffordshire |
| Electorate | 68,692 (December 2010)[1] |
| Major settlements | Newcastle-under-Lyme, Keele and Audley |
| Current constituency | |
| Created | 1885 |
| Member of Parliament | Aaron Bell (Conservative) |
| Number of members | One |
| 1354–1885 | |
| Number of members | Two |
| Type of constituency | Borough constituency |
Its 2017 general election result was the fifth-closest result, a winning margin of 30 votes.[2] In 2019, it was subsequently won by the Conservatives for the first time since its creation, by over 7000 votes.
History
From its creation in 1354, Newcastle-under-Lyme returned two MPs to the House of Commons. Under the Redistribution of Seats Act 1885, the constituency's representation was cut to one member.
Prominent frontbenchers or members
Josiah Wedgwood of the pottery family was repeatedly elected to the seat from 1906 until he was ennobled to join the Lords in 1942, as 1st Baron Wedgwood and campaigned in the US for that country to join World War II and for Indian Independence; he was among many Liberals and their supporters deserting the party in or around 1918 due to the steering of David Lloyd George to the right and inviting Conservatives into government with him. Before the 20th century the constituency was often influenced and represented by members of the Leveson, Leveson-Gower[n 3] and related Egerton family who owned in this constituency the Trentham estate[n 4] - their most important MP was the Viscount Trentham who obtained a Dukedom.
Summary of results
This constituency had been a loyal Labour Party seat having returned a Labour MP in all 29 elections since 1918 and specifically since 1922 when MP Wedgwood defected from the highly centrist and compromising Liberal Party at the time to the Labour Party — his was among a great series of defections at this time see for example ex-Prime Minister H. H. Asquith's strong criticism of the Coalition Liberals particularly David Lloyd George. The 2015 result gave the seat the 9th-smallest majority of Labour's 232 seats by percentage of majority and 3rd-lowest in 2017.[3] The Conservatives took six seats from Labour in 2017, and this seat was the second closest to being taken that was held, behind Dudley North, where the result was a Labour majority of 22 votes.
Results of candidates of other parties
In 2015 one of four other parties' candidates standing, UKIP's Wood, won more than 5% of the vote in 2015 therefore keeping his deposit, the party which campaigned consistently for the public vote for leaving the European Union in 2016. In 2017 the three largest British parties fielded candidates only — Labour, Conservative and Liberal Democrat candidates in order of votes won.
Turnout since 1945
Turnout has ranged from 87.6% in 1950 to 58.8% in 2001.
Boundaries
The constituency includes most of the northerly parts of Newcastle-under-Lyme borough, primarily Newcastle-under-Lyme town plus Keele and Audley.
Parliament accepted the Boundary Commission's Fifth Periodic Review of Westminster constituencies for General Election 2010 since which it has electoral wards, with no alterations in that review:
- Audley and Bignall End; Bradwell; Chesterton; Clayton; Cross Heath; Halmerend; Holditch; Keele; Knutton and Silverdale; May Bank; Porthill; Seabridge; Silverdale and Parksite; Thistleberry; Town; Westlands; and Wolstanton in the Borough of Newcastle-under-Lyme[4]
From 1983-2010 the constituency comprised the following wards of the Borough of Newcastle-under-Lyme, namely, Audley and Bignall End, Bradwell, Chesterton, Clayton, Cross Heath, Halmerend, Holditch, Keele, May Bank, Porthill, Seabridge, Silverdale, Thistleberry, Town, Westlands and Wolstanton.
Members of Parliament
MPs 1353–1509
Where the name of the member has not yet been ascertained or is not recorded in a surviving document, the entry unknown is entered in the table.
- Before 1354 No records[5]
- 1354 John Lagowe and Richard de Lavendene
- 1355 John de Blorton and Richard de Podmore
- 1358 Richard de Podmore and William de Homersley
- 1360 William Gent and Richard de Colclough
- 1361 William Gent and Richard de Podmore
- 1362 Richard de Podmore and Thomas de Wodhull
- 1363 Richard de Lavendene and John de Lylsull
- 1365 Thomas de Wodhull and Richard de Podmore
- 1366 Richard de Podmore and Thomas de Wodhull
- 1369 Richard de Lavendene, Roger Letys
- 1371 Roger Letys and Richard Lavendene
- 1372 Edmund Toly and Thomas Colclough
- 1373 Thomas de Wodhull and Roger del Castell
- 1377 Richard Buntable and Thomas Thicknesse
- 1377 Thomas de Podmore and Henry de Erdeleye
- 1378 Thomas de Podmore and William Thickness
- 1379 No records
- 1380 John Kene and William Thickness
- 1381-1382 Thomas Podmore and Thomas Hap
- 1382 Thomas Thicknesse and John Thykenesse
- 1382 William Thickness and Henry de Kele
- 1383 Thomas Thicknesse and William de Brompton
- 1383 Thomas Thicknesse and Thomas de Podmore
- 1384 William Thickness and Ralf de la Hogh
- 1384 John Colclough and William Colclough
- 1385 William Colclough and Ralf de la Hogh
- 1386 William Colclough and Ralf Hogh
- 1388 William Thickness and John Kene
- 1388 William Thickness and Thomas de Thikenes
- 1390 John Colclough and William Colclough
- 1391 Thomas Thicknesse and Ralf de la Hogh
- 1393 Ralf Hogh, John Cook
- 1394 No records
- 1395 William Colclough and Ralf Hogh
- 1397 William Colclough and Thomas Thicknesse
- 1397-1398 No records
- 1399 Thomas Podmore and Thomas Thicknesse
- 1402 John Joce and Thomas Joce
- 1406 Richard Fyton and William Lee II
- 1407 Hugh Colclough and John Tatenhale
- 1410 ? possibly John Delves was an MP representing the county or a borough
- 1411 Thomas Thicknesse and William Bowyer
- 1413 (1) ? possibly Newport, or Robert Bapthorpe was an MP representing the county or a borough
- 1413 (2) William de Lee and Hugh Wyldeblood
- 1416 William Skytteby, Thomas Chamberleyn
- 1419 John Biddulph (Bedulf), John Miners
- 1420 Hugo de Stanford and John Hardhed
- 1421 John Biddulph (Bydulf) and Thomas Baron
- 1421 Hugh Stanford and Thomas Lee
- 1422 John Myners and Hugh Stanford
- 1423-1424 Hugh Stanford and William Sandbache
- 1425 John Wood and William Hextall
- 1426 Robert Wodehous and Henry Lilie
- 1427-1428 John Wood and Thomas Lee
- 1429-1430 William Egerton and William Hextall
- 1431 John Wood and Roger Legh
- 1432 James Leveson and John Wood
- 1433 John Wood and Thomas Podmore
- 1435 Richard Bruyn and William Hextall
- 1437 Thomas Preston and Nicholas Repynghale
- 1442 John Nedham and William Cumberford of Cumberford
- 1447 John Nedham and John Cudworth
- 1449 John Nedham and Thomas Everdon
- 1449-1450 Ralf Wolseley and Thomas Mayne
- 1450-1451 Thomas Colclogh and Richard Mosley
- 1453-1434 Thomas Colcloghe and John Spenser
- 1455-1456 John Spenser and Richard Mosley
- 1467-1468 James Norys and Robert Hille
- 1472-1475 William Paston and John Wood
- 1477-1478 William Yonge and Reynold Bray
- 1491-1492 Richard Harpur and Richard Blunt
- 1495-1496 ? Sir Reynold Bray
- 1497 County or a borough - ?Richard Wrottesley, ?Humphrey Peshale,?Thomas Welles
- 1504 unknown
Burgesses in the English Parliament 1510-1707
As there were sometimes significant gaps between Parliaments held in this period, the dates of first assembly and dissolution are given.
The Roman numerals after some names are those used in The House of Commons 1509-1558 and The House of Commons 1558-1603 to distinguish a member from another politician of the same name.
| Elected | Assembled | Dissolved | First member | Second member |
|---|---|---|---|---|
| 1510 | 21 January 1510 | 23 February 1510 | John Welles | William Pury |
| 1512 | 4 February 1512 | 4 March 1514 | John Welles | Thomas Rider |
| 1515 | 5 February 1515 | 22 December 1515 | John Welles | Thomas Rider |
| 1523 | 15 April 1523 | 13 August 1523 | unknown | unknown |
| 1529 | 3 November 1529 | 14 April 1536 | John Persall | Richard Grey |
| 1536 | 8 June 1536 | 18 July 1536 | unknown | unknown |
| 1539 | 28 April 1539 | 24 July 1540 | unknown | unknown |
| 1542 | 16 January 1542 | 28 March 1544 | Harry Broke | John Smith |
| 1545 | 23 November 1545 | 31 January 1547 | Humphrey Welles | Harry Broke |
| 1547 | 4 November 1547 | 15 April 1552 | James Rolston | William Layton (died) Alexander Walker in place of Layton |
| 1553 | 1 March 1553 | 31 March 1553 | Roger Fowke | John Smyth |
| 1553 | 5 October 1553 | 5 December 1553 | Roger Fowke | James Rolston |
| 1554 | 2 April 1554 | 3 May 1554 | James Rolleston | Francis Moore |
| 1554 | 12 November 1554 | 16 January 1555 | Sir Ralph Bagnall | Richard Smyth |
| 1555 | 21 October 1555 | 9 December 1555 | Sir Richard Bagnall (properly Sir Nicholas Bagenal) | Richard Smyth |
| 14 January 1558 | 20 January 1558 | 17 November 1558 | Richard Hussey | Thomas Egerton |
| 5 January 1559 | 23 January 1559 | 8 May 1559 | Sir Nicholas Bagenal | Walter Blount |
| 1562 or 1563 | 11 January 1563 | 2 January 1567 | Sir Ralph Bagnall | John Long |
| 1571 | 2 April 1571 | 29 May 1571 | Sir Ralph Bagnall | Ralph Bourchier |
| 12 April 1572 | 8 May 1572 | 19 April 1583 | Ralph Bourchier | Thomas Grimsdiche |
| 16 November 1584 | 23 November 1584 | 14 September 1585 | Peter Warburton | Walter Chetwynd |
| 28 September 1586 | 13 October 1586 | 23 March 1587 | James Colyer | Walter Chetwynd |
| 10 October 1588 | 4 February 1589 | 29 March 1589 | Thomas Humphrey | Francis Angier |
| 1593 | 18 February 1593 | 10 April 1593 | John James | Thomas Fitzherbert |
| 16 October 1597 | 24 October 1597 | 9 February 1598 | Sir Walter Leveson | John Bowyer |
| 1 October 1601 | 27 October 1601 | 19 December 1601 | Edward Mainwaring | Thomas Trentham |
| 1603 [sic] | 19 March 1604 | 9 February 1611 | Sir Walter Chetwynd | John Bowyer (replaced in by-election 1605 by Rowland Cotton) |
| 1614 | 5 April 1614 | 7 June 1614 | Edward Wymarke | Robert Needham, 2nd Viscount Kilmorey |
| 1621 | 16 January 1621 | 8 February 1622 | Sir John Davies | Edward Kerton |
| 1624 | 12 February 1624 | 27 March 1625 | Sir Edward Vere (disabled, replaced April 1624 by Charles Glemham | Richard Leveson |
| 1625 | 17 May 1625 | 12 August 1625 | Edward Mainwaring | John Keeling |
| 1626 | 6 February 1626 | 15 June 1626 | Sir John Skeffington | John Keeling |
| 1628 | 17 March 1628 | 10 March 1629 | Sir George Gresley, 1st Baronet | Sir Rowland Cotton |
| No parliament held | ||||
| 1640 | 13 April 1640 | 5 May 1640 | Sir John Merrick (Country) | Richard Lloyd (Court) |
| 1640 | 3 November 1640 | 5 December 1648 | Sir Richard Leveson (Royalist) (until 1643) replaced by Samuel Terrick (Parl.) | Sir John Merrick (Parl.) |
| N/A | 6 December 1648[n 5] | 20 April 1653[n 6] | unrepresented | |
| N/A[n 7] | 4 July 1653 | 12 December 1653 | unrepresented | |
| 1654[n 8] | 3 September 1654 | 22 January 1655 | Edward Keeling | |
| 1656[n 9] | 17 September 1656 | 4 February 1658 | John Bowyer(never sat) | |
| 1659 | 27 January 1659 | 22 April 1659 | Edward Keeling | Tobias Bridge |
| N/A[n 10] | 7 May 1659 | 20 February 1660 | unknown | unknown |
MPs 1660–1885
MPs since 1885
Elections
Elections in the 2010s
| Party | Candidate | Votes | % | ± | |
|---|---|---|---|---|---|
| Conservative | Aaron Bell | 23,485 | 52.5 | ||
| Labour | Carl Greatbatch | 16,039 | 35.9 | ||
| Liberal Democrats | Nigel Jones | 2,361 | 5.3 | ||
| Brexit Party | Jason Cooper | 1,921 | 4.3 | ||
| Green | Carl Johnson | 933 | 2.1 | ||
| Majority | 7,446 | 16.6 | N/A | ||
| Turnout | 44,879 | 65.79 | |||
| Conservative gain from Labour | Swing | ||||
| Party | Candidate | Votes | % | ± | |
|---|---|---|---|---|---|
| Labour | Paul Farrelly | 21,124 | 48.2 | ||
| Conservative | Owen Meredith | 21,094 | 48.1 | ||
| Liberal Democrats | Nigel Jones | 1,624 | 3.8 | ||
| Majority | 30 | 0.1 | |||
| Turnout | 43,842 | 66.9 | |||
| Labour hold | Swing | ||||
| Party | Candidate | Votes | % | ± | |
|---|---|---|---|---|---|
| Labour | Paul Farrelly | 16,520 | 38.4 | ||
| Conservative | Tony Cox | 15,870 | 36.9 | ||
| UKIP | Phil Wood | 7,252 | 16.9 | ||
| Liberal Democrats | Ian Wilkes | 1,826 | 4.2 | ||
| Green | Sam Gibbons | 1,246 | 2.9 | ||
| Independent | David Nixon | 283 | 0.7 | ||
| Majority | 650 | 1.5 | |||
| Turnout | 42,997 | 62.6 | |||
| Labour hold | Swing | ||||
| Party | Candidate | Votes | % | ± | |
|---|---|---|---|---|---|
| Labour | Paul Farrelly | 16,393 | 38.0 | ||
| Conservative | Robert Jenrick | 14,841 | 34.4 | ||
| Liberal Democrats | Nigel Jones | 8,466 | 19.6 | ||
| UKIP | David Nixon | 3,491 | 8.1 | ||
| Majority | 1,552 | 3.6 | |||
| Turnout | 43,191 | 62.2 | |||
| Labour hold | Swing | ||||
Elections in the 2000s
| Party | Candidate | Votes | % | ± | |
|---|---|---|---|---|---|
| Labour | Paul Farrelly | 18,053 | 45.4 | - 8.0 | |
| Conservative | Jeremy Lefroy | 9,945 | 25.0 | - 2.6 | |
| Liberal Democrats | Trevor Johnson | 7,528 | 18.9 | + 3.4 | |
| UKIP | David Nixon | 1,436 | 3.6 | + 2.1 | |
| BNP | John Dawson | 1,390 | 3.5 | N/A | |
| Green | Andrew Dobson | 918 | 2.3 | N/A | |
| Veritas | Marian Harvey-Lover | 518 | 1.3 | N/A | |
| Majority | 8,108 | 20.4 | - 5.4 | ||
| Turnout | 39,788 | 61.6 | + 2.8 | ||
| Labour hold | Swing | - 2.7 | |||
| Party | Candidate | Votes | % | ± | |
|---|---|---|---|---|---|
| Labour | Paul Farrelly | 20,650 | 53.4 | - 3.1 | |
| Conservative | Michael Flynn | 10,664 | 27.6 | + 6.1 | |
| Liberal Democrats | Jerry Roodhouse | 5,993 | 15.5 | + 1.5 | |
| Independent | Robert Fyson | 773 | 2.0 | N/A | |
| UKIP | Paul Godfrey | 594 | 1.5 | N/A | |
| Majority | 9,986 | 25.8 | - 9.2 | ||
| Turnout | 38,674 | 58.8 | - 14.8 | ||
| Labour hold | Swing | - 4.6 | |||
Elections in the 1990s
| Party | Candidate | Votes | % | ± | |
|---|---|---|---|---|---|
| Labour | Llin Golding | 27,743 | 56.5 | + 8.6 | |
| Conservative | Marcus Hayes | 10,537 | 21.5 | - 8.1 | |
| Liberal Democrats | Robin Studd | 6,858 | 14.0 | - 7.9 | |
| Referendum | Kim Suttle | 1,510 | 3.1 | N/A | |
| Liberal | Steven Mountford | 1,399 | 2.9 | N/A | |
| Socialist Labour | Bridget Bell | 1,082 | 2.2 | N/A | |
| Majority | 17,206 | 35.0 | + 16.6 | ||
| Turnout | 49,129 | 73.6 | - 7.2 | ||
| Labour hold | Swing | ||||
| Party | Candidate | Votes | % | ± | |
|---|---|---|---|---|---|
| Labour | Llin Golding | 25,652 | 47.9 | + 7.4 | |
| Conservative | Andrew Brierley | 15,813 | 29.6 | + 1.7 | |
| Liberal Democrats | Alan Thomas | 11,727 | 21.9 | - 9.0 | |
| Natural Law | Richard Lines | 314 | 0.6 | N/A | |
| Majority | 9,839 | 18.4 | + 8.8 | ||
| Turnout | 53,506 | 80.8 | + 3.7 | ||
| Labour hold | Swing | + 2.9 | |||
Elections in the 1980s
| Party | Candidate | Votes | % | ± | |
|---|---|---|---|---|---|
| Labour | Llin Golding | 21,618 | 40.5 | -1.5 | |
| Liberal | Alan Thomas | 16,486 | 30.9 | +9.3 | |
| Conservative | Peter Ridway | 14,863 | 27.9 | -8.6 | |
| Ex Labour Moderate | Michael Nicklin | 397 | 0.7 | ||
| Majority | 5,132 | 9.6 | +4.1 | ||
| Turnout | 80.8 | ||||
| Labour hold | Swing | ||||
- Resignation of John Golding on 24 June 1986, upon appointment as General Secretary of the National Communications Union.
| Party | Candidate | Votes | % | ± | |
|---|---|---|---|---|---|
| Labour | Llin Golding | 16,819 | 40.8 | - 1.2 | |
| Liberal | Alan Thomas | 16,020 | 38.8 | + 17.2 | |
| Conservative | James Nock | 7,863 | 19.0 | - 17.4 | |
| Monster Raving Loony | David Sutch | 277 | 0.7 | N/A | |
| Independent | John Gaskell | 115 | 0.3 | N/A | |
| Independent | James Parker | 83 | 0.2 | N/A | |
| Independent | David Brewster | 70 | 0.2 | N/A | |
| Majority | 799 | 2.0 | - 3.6 | ||
| Turnout | 41,247 | 62.2 | - 15.1 | ||
| Labour hold | Swing | ||||
| Registered electors | 66,353 | ||||
| Party | Candidate | Votes | % | ± | |
|---|---|---|---|---|---|
| Labour | John Golding | 21,210 | 42.0 | ||
| Conservative | L Lawrence | 18,406 | 36.4 | ||
| Liberal | Alan Thomas | 10,916 | 21.6 | ||
| Majority | 2,804 | 5.6 | |||
| Turnout | 77.3 | ||||
| Labour hold | Swing | ||||
Elections in the 1970s
| Party | Candidate | Votes | % | ± | |
|---|---|---|---|---|---|
| Labour | John Golding | 28,649 | 48.5 | ||
| Conservative | E Ashley | 24,421 | 41.3 | ||
| Liberal | G Evans | 5,878 | 10.0 | ||
| British Socialist Empire | S Rowe | 156 | 0.3 | ||
| Majority | 4,228 | 7.2 | |||
| Turnout | 81.6 | ||||
| Labour hold | Swing | ||||
| Party | Candidate | Votes | % | ± | |
|---|---|---|---|---|---|
| Labour | John Golding | 28,154 | 49.6 | ||
| Conservative | Nicholas Bonsor | 20,784 | 36.6 | ||
| Liberal | R Fyson | 7,604 | 13.4 | ||
| UK Front | S Rowe | 256 | 0.5 | ||
| Majority | 7,370 | 13.0 | |||
| Turnout | 78.0 | ||||
| Labour hold | Swing | ||||
| Party | Candidate | Votes | % | ± | |
|---|---|---|---|---|---|
| Labour | John Golding | 28,603 | 47.2 | ||
| Conservative | Nicholas Bonsor | 22,955 | 37.9 | ||
| Liberal | R Fyson | 8,861 | 14.6 | ||
| UK Front | S Rowe | 228 | 0.4 | ||
| Majority | 5,648 | 9.3 | |||
| Turnout | 84.1 | ||||
| Labour hold | Swing | ||||
| Party | Candidate | Votes | % | ± | |
|---|---|---|---|---|---|
| Labour | John Golding | 22,329 | 48.9 | - 12.9 | |
| Conservative | Nicholas Winterton | 20,223 | 44.3 | + 6.1 | |
| Liberal | Derek Wright | 1,954 | 4.3 | N/A | |
| Democratic Party | Peter Boyle | 1,194 | 2.61 | N/A | |
| Majority | 2,106 | 4.6 | - 19.0 | ||
| Turnout | 65.5 | ||||
| Labour hold | Swing | ||||
Elections in the 1960s
| Party | Candidate | Votes | % | ± | |
|---|---|---|---|---|---|
| Labour | John Golding | 21,786 | 46.1 | - 15.7 | |
| Conservative | Nicholas Winterton | 20,744 | 43.9 | + 5.7 | |
| Liberal | David Spreckley | 2,999 | 6.4 | + 6.4 | |
| Democratic Party | D Parker | 1,699 | 3.6 | + 3.6 | |
| Majority | 1,042 | 2.2 | - 21.4 | ||
| Turnout | 47,228 | 72.3 | |||
| Labour hold | Swing | ||||
| Party | Candidate | Votes | % | ± | |
|---|---|---|---|---|---|
| Labour | Stephen Swingler | 31,548 | 61.8 | ||
| Conservative | Peggy Fenner | 19,497 | 38.2 | ||
| Majority | 12,051 | 23.6 | |||
| Turnout | 79.9 | ||||
| Labour hold | Swing | ||||
| Party | Candidate | Votes | % | ± | |
|---|---|---|---|---|---|
| Labour | Stephen Swingler | 30,470 | 58.0 | ||
| Conservative | John Lovering | 22,073 | 42.0 | ||
| Majority | 8,397 | 16.0 | |||
| Turnout | 82.2 | ||||
| Labour hold | Swing | ||||
Elections in the 1950s
| Party | Candidate | Votes | % | ± | |
|---|---|---|---|---|---|
| Labour | Stephen Swingler | 29,840 | 55.6 | ||
| Conservative | Thomas Prendergast | 23,838 | 44.4 | ||
| Majority | 6,002 | 11.2 | |||
| Turnout | 84.4 | ||||
| Labour hold | Swing | ||||
| Party | Candidate | Votes | % | ± | |
|---|---|---|---|---|---|
| Labour | Stephen Swingler | 28,314 | 56.8 | ||
| Conservative | Frank Taylor | 21,569 | 43.2 | ||
| Majority | 6,745 | 13.5 | |||
| Turnout | 80.8 | ||||
| Labour hold | Swing | ||||
| Party | Candidate | Votes | % | ± | |
|---|---|---|---|---|---|
| Labour | Stephen Swingler | 30,814 | 58.0 | ||
| Conservative | James Friend | 22,278 | 42.0 | ||
| Majority | 8,536 | 16.1 | |||
| Turnout | 87.5 | ||||
| Labour hold | Swing | ||||
| Party | Candidate | Votes | % | ± | |
|---|---|---|---|---|---|
| Labour | John Mack | 30,249 | 57.8 | ||
| Conservative | James Friend | 22,132 | 42.2 | ||
| Majority | 8,117 | 15.5 | |||
| Turnout | 87.6 | ||||
| Labour hold | Swing | ||||
Elections in the 1940s
| Party | Candidate | Votes | % | ± | |
|---|---|---|---|---|---|
| Labour | John Mack | 25,903 | 66.2 | ||
| Conservative | George Wade | 8,380 | 21.4 | ||
| Liberal | Norman Elliott | 4,838 | 12.4 | ||
| Majority | 17,523 | 44.8 | |||
| Turnout | 77.1 | ||||
| Labour hold | Swing | ||||
| Party | Candidate | Votes | % | ± | |
|---|---|---|---|---|---|
| Labour | John Mack | Unopposed | |||
| Labour hold | Swing | ||||
Elections in the 1930s
| Party | Candidate | Votes | % | ± | |
|---|---|---|---|---|---|
| Labour | Josiah Wedgwood | Unopposed | |||
| Labour gain from Independent Labour | Swing | ||||

| Party | Candidate | Votes | % | ± | |
|---|---|---|---|---|---|
| Independent Labour | Josiah Wedgwood | Unopposed | N/A | N/A | |
| Independent Labour gain from Labour | Swing | N/A | |||
Elections in the 1920s
| Party | Candidate | Votes | % | ± | |
|---|---|---|---|---|---|
| Labour | Josiah Wedgwood | 20,931 | 69.9 | +12.2 | |
| Unionist | Christopher Kemplay Tatham | 9,011 | 30.1 | −12.2 | |
| Majority | 11,920 | 39.8 | +24.4 | ||
| Turnout | 29,942 | 75.8 | −4.2 | ||
| Registered electors | 39,482 | ||||
| Labour hold | Swing | +12.2 | |||
| Party | Candidate | Votes | % | ± | |
|---|---|---|---|---|---|
| Labour | Josiah Wedgwood | 14,226 | 57.7 | −7.9 | |
| Unionist | A. Hassam | 10,425 | 42.3 | +7.9 | |
| Majority | 3,801 | 15.4 | −15.8 | ||
| Turnout | 24,651 | 80.0 | +15.8 | ||
| Registered electors | 30,816 | ||||
| Labour hold | Swing | −7.9 | |||
| Party | Candidate | Votes | % | ± | |
|---|---|---|---|---|---|
| Labour | Josiah Wedgwood | 12,881 | 65.6 | +5.4 | |
| Unionist | John Ravenshaw | 6,746 | 34.4 | N/A | |
| Majority | 6,135 | 31.2 | +10.8 | ||
| Turnout | 19,627 | 64.2 | −15.3 | ||
| Registered electors | 30,565 | ||||
| Labour hold | Swing | N/A | |||
| Party | Candidate | Votes | % | ± | |
|---|---|---|---|---|---|
| Labour | Josiah Wedgwood | 14,503 | 60.2 | N/A | |
| National Liberal | Albert Shaw | 9,573 | 39.8 | N/A | |
| Majority | 4,930 | 20.4 | N/A | ||
| Turnout | 24,076 | 79.5 | N/A | ||
| Registered electors | 30,300 | ||||
| Labour gain from Independent Liberal | Swing | N/A | |||
Election results 1868-1918
Elections in the 1860s

| Party | Candidate | Votes | % | ± | |
|---|---|---|---|---|---|
| Conservative | Edmund Buckley | 1,423 | 43.8 | +1.9 | |
| Liberal | William Shepherd Allen | 1,081 | 33.3 | −10.8 | |
| Liberal | Henry Thomas Salmon[27] | 744 | 22.9 | +8.8 | |
| Majority | 342 | 10.5 | −17.3 | ||
| Turnout | 2,340 (est) | 82.0 (est) | −12.2 | ||
| Registered electors | 2,849 | ||||
| Conservative hold | Swing | +2.0 | |||
| Liberal hold | Swing | −6.4 | |||
Elections in the 1870s
| Party | Candidate | Votes | % | ± | |
|---|---|---|---|---|---|
| Conservative | Edmund Buckley | 1,173 | 35.3 | +13.4 | |
| Liberal | William Shepherd Allen | 1,116 | 33.6 | −22.6 | |
| Conservative | Harry Davenport | 1,037 | 31.2 | +9.3 | |
| Turnout | 2,221 (est) | 74.1 (est) | −7.9 | ||
| Registered electors | 2,999 | ||||
| Majority | 57 | 1.7 | +8.8 | ||
| Conservative hold | Swing | +12.4 | |||
| Majority | 79 | 2.4 | N/A | ||
| Liberal hold | Swing | −22.7 | |||
Buckley resigned, causing a by-election.
| Party | Candidate | Votes | % | ± | |
|---|---|---|---|---|---|
| Liberal | Samuel Rathbone Edge | 1,330 | 57.3 | +23.7 | |
| Conservative | Charles Donaldson-Hudson | 990 | 42.7 | -23.8 | |
| Majority | 340 | 14.7 | +12.3 | ||
| Turnout | 2,320 | 68.3 | -5.8 | ||
| Registered electors | 3,396 | ||||
| Liberal gain from Conservative | Swing | +23.8 | |||
Elections in the 1880s
| Party | Candidate | Votes | % | ± | |
|---|---|---|---|---|---|
| Conservative | Charles Donaldson-Hudson | 1,484 | 37.9 | −28.6 | |
| Liberal | William Shepherd Allen | 1,252 | 32.0 | +15.2 | |
| Liberal | Samuel Rathbone Edge | 1,175 | 30.0 | +13.2 | |
| Majority | 232 | 5.9 | +4.2 | ||
| Turnout | 2,736 (est) | 84.6 (est) | +10.5 | ||
| Registered electors | 3,235 | ||||
| Conservative hold | Swing | −13.8 | |||
| Liberal hold | Swing | +14.8 | |||

| Party | Candidate | Votes | % | ± | |
|---|---|---|---|---|---|
| Liberal | William Shepherd Allen | 4,031 | 58.6 | −3.4 | |
| Conservative | Andrew Scoble | 2,848 | 41.4 | +3.5 | |
| Majority | 1,183 | 17.2 | N/A | ||
| Turnout | 6,879 | 87.8 | +3.2 (est) | ||
| Registered electors | 7,837 | ||||
| Liberal hold | Swing | +3.5 | |||
| Party | Candidate | Votes | % | ± | |
|---|---|---|---|---|---|
| Liberal Unionist | Douglas Coghill | 2,896 | 51.3 | +9.9 | |
| Liberal | John Beavis Brindley | 2,752 | 48.7 | -9.9 | |
| Majority | 144 | 2.6 | N/A | ||
| Turnout | 5,648 | 72.1 | -15.7 | ||
| Registered electors | 7,837 | ||||
| Liberal Unionist gain from Liberal | Swing | +9.9 | |||
Elections in the 1890s
.jpg)
| Party | Candidate | Votes | % | ± | |
|---|---|---|---|---|---|
| Liberal | William Allen | 4,024 | 57.8 | +9.1 | |
| Liberal Unionist | Douglas Coghill | 2,936 | 42.2 | −9.1 | |
| Majority | 1,088 | 15.6 | N/A | ||
| Turnout | 6,960 | 78.5 | +6.4 | ||
| Registered electors | 8,862 | ||||
| Liberal gain from Liberal Unionist | Swing | +9.1 | |||
| Party | Candidate | Votes | % | ± | |
|---|---|---|---|---|---|
| Liberal | William Allen | 3,510 | 50.8 | −7.0 | |
| Liberal Unionist | Arthur Morier Lee | 3,399 | 49.2 | +7.0 | |
| Majority | 111 | 1.6 | −14.0 | ||
| Turnout | 6,909 | 83.4 | +4.9 | ||
| Registered electors | 8,281 | ||||
| Liberal hold | Swing | −7.0 | |||
Elections in the 1900s
| Party | Candidate | Votes | % | ± | |
|---|---|---|---|---|---|
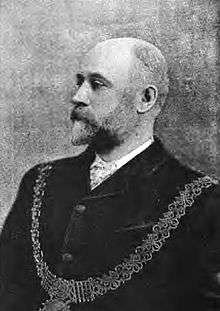
| Liberal Unionist | Alfred Seale Haslam | 3,750 | 51.2 | +2.0 | |
| Liberal | William Allen | 3,568 | 48.8 | −2.0 | |
| Majority | 182 | 2.4 | N/A | ||
| Turnout | 7,318 | 80.5 | −2.9 | ||
| Registered electors | 9,095 | ||||
| Liberal Unionist gain from Liberal | Swing | + 2.0 | |||
| Party | Candidate | Votes | % | ± | |
|---|---|---|---|---|---|
| Liberal | Josiah Wedgwood | 5,155 | 63.6 | +14.8 | |
| Liberal Unionist | Alfred Seale Haslam | 2,948 | 36.4 | -14.8 | |
| Majority | 2,207 | 27.2 | N/A | ||
| Turnout | 8,103 | 84.0 | +3.5 | ||
| Registered electors | 9,650 | ||||
| Liberal gain from Liberal Unionist | Swing | +14.8 | |||
Elections in the 1910s

| Party | Candidate | Votes | % | ± | |
|---|---|---|---|---|---|
| Liberal | Josiah Wedgwood | 5,613 | 56.9 | - 6.7 | |
| Liberal Unionist | Ewart Grogan | 4,245 | 43.1 | + 6.7 | |
| Majority | 1,368 | 13.8 | - 13.4 | ||
| Turnout | 93.8 | + 9.8 | |||
| Liberal hold | Swing | - 6.7 | |||
| Party | Candidate | Votes | % | ± | |
|---|---|---|---|---|---|
| Liberal | Josiah Wedgwood | 5,281 | 56.4 | - 0.5 | |
| Liberal Unionist | Ewart Grogan | 4,087 | 43.6 | + 0.5 | |
| Majority | 1,194 | 12.8 | - 1.0 | ||
| Turnout | 89.1 | - 4.7 | |||
| Liberal hold | Swing | - 0.5 | |||
General Election 1914/15:
Another General Election was required to take place before the end of 1915. The political parties had been making preparations for an election to take place and by the July 1914, the following candidates had been selected;
- Liberal: Josiah Wedgwood
- Unionist: Edgar Percy Hewitt
| Party | Candidate | Votes | % | ± | |
|---|---|---|---|---|---|
| Independent Liberal | Josiah Wedgwood* | Unopposed | |||
| Independent Liberal gain from Liberal | |||||
* Wedgwood was issued with a Coalition Coupon but did not accept it. He was also adopted by the local Liberal association, but considered himself an independent candidate.
Election results 1832-1868
Elections in the 1830s
| Party | Candidate | Votes | % | ± | |
|---|---|---|---|---|---|
| Tory | William Henry Miller | 607 | 36.3 | +7.1 | |
| Tory | Henry Willoughby | 587 | 35.1 | N/A | |
| Tory | Edmund Peel | 478 | 28.6 | −18.5 | |
| Majority | 109 | 6.5 | +0.9 | ||
| Turnout | 941 | 96.7 | c. +1.6 | ||
| Registered electors | 973 | ||||
| Tory hold | Swing | N/A | |||
| Tory hold | Swing | N/A | |||
| Party | Candidate | Votes | % | ± | |
|---|---|---|---|---|---|
| Conservative | Edmund Peel | 689 | 43.6 | +15.0 | |
| Conservative | William Henry Miller | 494 | 31.3 | −5.0 | |
| Conservative | Henry Willoughby | 397 | 25.1 | −10.0 | |
| Majority | 97 | 6.1 | −0.4 | ||
| Turnout | 922 | 93.4 | −3.3 | ||
| Registered electors | 987 | ||||
| Conservative hold | Swing | N/A | |||
| Conservative hold | Swing | N/A | |||
| Party | Candidate | Votes | % | ± | |
|---|---|---|---|---|---|
| Conservative | William Henry Miller | 669 | 41.9 | +10.6 | |
| Conservative | Spencer Horsey de Horsey | 635 | 39.8 | N/A | |
| Whig | Richard Badnall[33] | 292 | 18.3 | N/A | |
| Majority | 343 | 21.5 | +15.4 | ||
| Turnout | 881 | 88.9 | −4.5 | ||
| Registered electors | 991 | ||||
| Conservative hold | Swing | N/A | |||
| Conservative hold | Swing | N/A | |||
Elections in the 1840s
| Party | Candidate | Votes | % | ± | |
|---|---|---|---|---|---|
| Conservative | Edmund Buckley | 721 | 42.3 | +2.5 | |
| Whig | John Quincey Harris | 565 | 33.2 | +14.9 | |
| Conservative | William Henry Miller | 417 | 24.5 | −17.4 | |
| Turnout | 977 | 94.1 | +5.2 | ||
| Registered electors | 1,090 | ||||
| Majority | 156 | 9.2 | −12.3 | ||
| Conservative hold | Swing | −2.5 | |||
| Majority | 148 | 8.7 | N/A | ||
| Whig gain from Conservative | Swing | +14.9 | |||
Harris' election was declared void on petition on 11 May 1842, due to bribery by his agent, causing a by-election.[34]
| Party | Candidate | Votes | % | ± | |
|---|---|---|---|---|---|
| Whig | John Quincey Harris | 499 | 51.0 | +17.8 | |
| Conservative | John Campbell Colquhoun | 479 | 49.0 | −17.8 | |
| Majority | 20 | 2.0 | −6.7 | ||
| Turnout | 978 | 91.0 | −3.1 | ||
| Registered electors | 1,075 | ||||
| Whig hold | Swing | +17.8 | |||
Harris' election was again declared void on 23 July 1842, due to bribery by his agents, and Colquhoun was declared elected in his place.[35]
| Party | Candidate | Votes | % | ± | |
|---|---|---|---|---|---|
| Peelite | Samuel Christy | 571 | 32.5 | N/A | |
| Whig | William Jackson | 565 | 32.1 | +15.5 | |
| Conservative | Francis Egerton | 522 | 29.7 | −37.1 | |
| Whig | William Greig[36] | 101 | 5.7 | −10.9 | |
| Turnout | 880 (est) | 81.9 (est) | −12.2 | ||
| Registered electors | 1,074 | ||||
| Majority | 6 | 0.3 | N/A | ||
| Peelite gain from Conservative | Swing | N/A | |||
| Majority | 43 | 2.4 | −6.3 | ||
| Whig hold | Swing | +17.0 | |||
Christy resigned by accepting the office of Steward of the Chiltern Hundreds due to holding a government contract,[37] causing a by-election in which he stood.
| Party | Candidate | Votes | % | ± | |
|---|---|---|---|---|---|
| Peelite | Samuel Christy | 546 | 59.8 | +27.3 | |
| Whig | Thomas Ross | 367 | 40.2 | +3.6 | |
| Majority | 179 | 19.6 | +19.3 | ||
| Turnout | 913 | 85.0 | +3.1 | ||
| Registered electors | 1,074 | ||||
| Peelite hold | Swing | +11.9 | |||
Elections in the 1850s
| Party | Candidate | Votes | % | ± | |
|---|---|---|---|---|---|
| Whig | William Jackson | 622 | 42.6 | +10.5 | |
| Peelite | Samuel Christy | 585 | 40.1 | +7.6 | |
| Whig | Thomas Ross[38][39] | 252 | 17.3 | +11.6 | |
| Turnout | 730 (est) | 66.9 (est) | −15.0 | ||
| Registered electors | 1,090 | ||||
| Majority | 37 | 2.5 | +0.1 | ||
| Whig hold | Swing | +3.4 | |||
| Majority | 333 | 22.8 | +22.5 | ||
| Peelite hold | Swing | −14.9 | |||
| Party | Candidate | Votes | % | ± | |
|---|---|---|---|---|---|
| Peelite | Samuel Christy | 654 | 55.4 | +15.3 | |
| Whig | William Jackson | 413 | 35.0 | −7.6 | |
| Independent Liberal | John Riley[40][41] | 113 | 9.6 | N/A | |
| Majority | 241 | 20.4 | −2.4 | ||
| Turnout | 590 (est) | 59.2 (est) | −7.7 | ||
| Registered electors | 997 | ||||
| Peelite hold | Swing | +11.5 | |||
| Whig hold | Swing | −11.5 | |||
| Party | Candidate | Votes | % | ± | |
|---|---|---|---|---|---|
| Conservative | William Murray | Unopposed | |||
| Liberal | William Jackson | Unopposed | |||
| Registered electors | 994 | ||||
| Conservative gain from Peelite | |||||
| Liberal hold | |||||
Elections in the 1860s
| Party | Candidate | Votes | % | ± | |
|---|---|---|---|---|---|
| Liberal | William Shepherd Allen | 520 | 44.1 | N/A | |
| Conservative | Edmund Buckley | 494 | 41.9 | N/A | |
| Liberal | John Ashford Wise[42] | 166 | 14.1 | N/A | |
| Turnout | 1,014 (est) | 94.2 (est) | N/A | ||
| Registered electors | 1,077 | ||||
| Majority | 26 | 2.2 | N/A | ||
| Liberal hold | Swing | N/A | |||
| Majority | 328 | 27.8 | N/A | ||
| Conservative hold | Swing | N/A | |||
Pre-1832 election results
Elections in the 1830s
| Party | Candidate | Votes | % | ||
|---|---|---|---|---|---|
| Tory | Richardson Borradaile | 453 | 30.4 | ||
| Whig | William Henry Miller | 436 | 29.3 | ||
| Tory | Edmund Peel | 319 | 21.4 | ||
| Whig | Evelyn Denison | 280 | 18.8 | ||
| Turnout | 773 | c. 90.9 | |||
| Registered electors | c. 850 | ||||
| Majority | 17 | 1.1 | |||
| Tory hold | |||||
| Majority | 117 | 7.9 | |||
| Whig hold | |||||
| Party | Candidate | Votes | % | ± | |
|---|---|---|---|---|---|
| Tory | Edmund Peel | 746 | 47.1 | +25.7 | |
| Tory | William Henry Miller | 463 | 29.2 | −1.2 | |
| Whig | Josiah Wedgwood | 374 | 23.6 | −24.5 | |
| Majority | 89 | 5.6 | +4.5 | ||
| Turnout | 808 | c. 95.1 | c. +4.2 | ||
| Registered electors | c. 850 | ||||
| Tory hold | Swing | +19.0 | |||
| Tory gain from Whig | Swing | +5.5 | |||
See also
Notes and references
- Notes
- A borough constituency (for the purposes of election expenses and type of returning officer)
- As with all constituencies, the constituency elects one Member of Parliament (MP) by the first past the post system of election at least every five years.
- Usually e.g. H. D. G. Leveson-Gower, Granville George Leveson-Gower
- A series of marriages to heiresses by members of the Leveson-Gower family made the Dukes of Sutherland one of the richest landowning families in the Britain, they also owned Dunrobin Castle, Lancaster House as Stafford House and Stetchworth House.
- Date of Pride's Purge, which converted the Long Parliament into the Rump Parliament
- Date when Oliver Cromwell dissolved the Rump Parliament by force.
- Date when the members of the nominated or Barebones Parliament were selected at a "Convention". The parliamentary borough of Newcastle under Lyme was not represented in this body.
- Date when the members of the First Protectorate Parliament were elected. The parliamentary borough was represented in this body.
- Date when the members of the Second Protectorate Parliament were elected. The parliamentary borough was entitled to be represented in this body.
- The Rump Parliament was recalled and subsequently Pride's Purge was reversed, allowing the full Long Parliament to meet until it agreed to dissolve itself.
- The MPs of the last Parliament of England and 45 members co-opted from the former Parliament of Scotland, became the House of Commons of the 1st Parliament of Great Britain which assembled on 23 October 1707 (see below for the members in that Parliament).
- References
- "Electorate Figures - Boundary Commission for England". 2011 Electorate Figures. Boundary Commission for England. 4 March 2011. Archived from the original on 6 November 2010. Retrieved 13 March 2011.
- "GE2017: Marginal seats and turnout". 23 June 2017.
- List of Labour MPs elected in 2015 by % majority UK Political.info. Retrieved 2017-01-29
- "2010 post-revision map non-metropolitan areas and unitary authorities of England" (PDF). Archived from the original (PDF) on 29 October 2012. Retrieved 15 January 2013.
- "Tamworth Parliamentary Borough 1275-1832". The Staffordshire Encyclopaedia. Retrieved 26 October 2010.
- Leigh Rayment's Historical List of MPs – Constituencies beginning with "N" (part 1)
- Stooks Smith, Henry (1845). The Parliaments of England, from 1st George I., to the Present Time. Vol II: Oxfordshire to Wales Inclusive. London: Simpkin, Marshall, & Co. pp. 43–45. Retrieved 26 November 2018 – via Google Books.
- "Country Elections". Bell's Weekly Messenger. 5 July 1841. pp. 3–4. Retrieved 26 November 2018 – via British Newspaper Archive.
- "District News". Manchester Courier and Lancashire General Advertiser. 3 July 1841. pp. 2–3. Retrieved 26 November 2018 – via British Newspaper Archive.
- Morton, Edward, ed. (1854). The Parliamentary Handbook: Comprising a Pocket Peerage and Parliamentary Companion (Third ed.). London: Henry Adams. p. 220. Retrieved 7 June 2018.
- "Staffordshire Advertiser". 17 July 1847. p. 5. Retrieved 7 June 2018.
- "Newcastle-under-Lyme Parliamentary constituency". BBC News. BBC. Retrieved 1 December 2019.
- "Owen Meredith".
- "Election Data 2015". Electoral Calculus. Archived from the original on 17 October 2015. Retrieved 17 October 2015.
- "Election Data 2010". Electoral Calculus. Archived from the original on 26 July 2013. Retrieved 17 October 2015.
- "Election Data 2005". Electoral Calculus. Archived from the original on 15 October 2011. Retrieved 18 October 2015.
- "Election Data 2001". Electoral Calculus. Archived from the original on 15 October 2011. Retrieved 18 October 2015.
- "Election Data 1997". Electoral Calculus. Archived from the original on 15 October 2011. Retrieved 18 October 2015.
- "Election Data 1992". Electoral Calculus. Archived from the original on 15 October 2011. Retrieved 18 October 2015.
- "UK General Election results April 1992". Richard Kimber's Political Science Resources. Politics Resources. 9 April 1992. Archived from the original on 4 March 2016. Retrieved 6 December 2010.
- "Election Data 1987". Electoral Calculus. Archived from the original on 15 October 2011. Retrieved 18 October 2015.
- "Election Data 1983". Electoral Calculus. Archived from the original on 15 October 2011. Retrieved 18 October 2015.
- GENERAL ELECTION RESULTS SINCE 1966, accessed 27 October 2008
- UK Election Statistics: 1918-2004 RESEARCH PAPER 04/61 28 JULY 2004 Archived 14 February 2010 at the Wayback Machine, accessed 27 October 2008
- British Parliamentary Election Results 1918-1949, FWS Craig
- Craig, F. W. S., ed. (1977). British Parliamentary Election Results 1832-1885 (e-book)
|format=requires|url=(help) (1st ed.). London: Macmillan Press. ISBN 978-1-349-02349-3. - "Newcastle-under-Lyme". Birmingham Daily Gazette. 17 November 1868. p. 8. Retrieved 6 March 2018 – via British Newspaper Archive.
- British Parliamentary Election Results 1885-1918, FWS Craig
- The Liberal Year Book, 1907
- Debrett's House of Commons & Judicial Bench, 1886
- Debrett's House of Commons & Judicial Bench, 1901
- Debrett's House of Commons & Judicial Bench, 1916
- "18 August 1837". Chester Chronicle. p. 2. Retrieved 19 April 2020 – via British Newspaper Archive.
- "Imperial Parliament". Northampton Mercury. 14 May 1842. pp. 1–2. Retrieved 26 November 2018 – via British Newspaper Archive.
- "New Case of Disqualification of Members". Morning Chronicle. 26 July 1842. p. 3. Retrieved 26 November 2018 – via British Newspaper Archive.
- "Borough of Newcastle". Staffordshire Advertiser. 17 July 1847. p. 4. Retrieved 26 November 2018 – via British Newspaper Archive.
- "Newcastle-under-Lyme". Worcestershire Chronicle. 22 December 1847. p. 7. Retrieved 26 November 2018 – via British Newspaper Archive.
- "Elections". Monmouthshire Beacon. 18 December 1847. p. 3. Retrieved 7 June 2018 – via British Newspaper Archive.
- "Borough of Newcastle-under-Lyme". Staffordshire Advertiser. 10 July 1852. p. 3. Retrieved 7 June 2018 – via British Newspaper Archive.
- "Newcastle". Staffordshire Advertiser. 28 March 1857. p. 8. Retrieved 7 June 2018 – via British Newspaper Archive.
- "Local Election Intelligence". Wolverhampton Chronicle and Staffordshire Advertiser. 25 March 1857. p. 4. Retrieved 7 June 2018 – via British Newspaper Archive.
- "Election Intelligence". Leeds Intelligencer. 13 July 1865. p. 4. Retrieved 6 March 2018 – via British Newspaper Archive.
- Salmon, Philip. "Newcastle-under-Lyme". The History of Parliament. Retrieved 19 April 2020.
Sources
- The History of Parliament: the House of Commons - Newcastle-under-Lyme, Borough, 1386 to 1831
- Britain Votes/Europe Votes By-Election Supplement 1983-, compiled and edited by F.W.S. Craig (Parliamentary Research Services 1985-)