Birmingham Perry Barr (UK Parliament constituency)
Birmingham, Perry Barr is a constituency[n 1] of part of the city of Birmingham represented in the House of Commons of the UK Parliament.[n 2]
| Birmingham, Perry Barr | |
|---|---|
| Borough constituency for the House of Commons | |
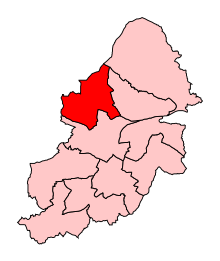 Boundary of Birmingham, Perry Barr in Birmingham | |
 Location of Birmingham within England | |
| County | West Midlands |
| Population | 107,090 (2011 census)[1] |
| Electorate | 71,794 (December 2010)[2] |
| Current constituency | |
| Created | 1950 |
| Member of Parliament | Khalid Mahmood (Labour) |
| Number of members | One |
| Created from | Birmingham Handsworth |
Members of Parliament
| Election | Member[3] | Party | |
|---|---|---|---|
| 1950 | Cecil Poole | Labour | |
| 1955 | Charles Howell | Labour | |
| 1964 | Wyndham Davies | Conservative | |
| 1966 | Christopher Price | Labour | |
| 1970 | Joseph Kinsey | Conservative | |
| Feb 1974 | Jeff Rooker | Labour | |
| 2001 | Khalid Mahmood | Labour | |
Boundaries
The constituency covers a broad area of north-west Birmingham.
2010–present: The City of Birmingham wards of Handsworth Wood, Lozells and East Handsworth, Oscott, Perry Barr, Birchfield
1997–2010: The City of Birmingham wards of Handsworth, Oscott, Perry Barr, and Sandwell.
1983–1997: The City of Birmingham wards of Handsworth, Kingstanding, Oscott, and Perry Barr.
1974–1983: The County Borough of Birmingham wards of Kingstanding, Oscott, and Perry Barr.
1950–1974: The County Borough of Birmingham wards of Kingstanding and Perry Barr.[4]
Elections
Elections in the 2010s
| Party | Candidate | Votes | % | ± | |
|---|---|---|---|---|---|
| Labour | Khalid Mahmood | 26,594 | 63.1 | ||
| Conservative | Raaj Shamji | 11,277 | 26.8 | ||
| Liberal Democrats | Gerry Jerome | 1,901 | 4.5 | ||
| Brexit Party | Annette Willcox | 1,382 | 3.3 | ||
| Green | Kefentse Dennis | 845 | 2.0 | ||
| Yeshua | Thomas Braich | 148 | 0.4 | ||
| Majority | 15,317 | 36.3 | |||
| Turnout | 42,262 | 58.69 | |||
| Labour hold | Swing | ||||
| Party | Candidate | Votes | % | ± | |
|---|---|---|---|---|---|
| Labour | Khalid Mahmood | 30,109 | 68.1 | ||
| Conservative | Charlotte Hodivala | 11,726 | 26.5 | ||
| Liberal Democrats | Harjun Singh | 1,080 | 2.4 | ||
| Socialist Labour | Shangara Bhatoe | 592 | 1.3 | ||
| Green | Vijay Rana | 591 | 1.3 | ||
| Open Borders | Harjinder Singh | 99 | 0.2 | ||
| Majority | 18,383 | 41.6 | |||
| Turnout | 44,197 | 63.1 | |||
| Labour hold | Swing | ||||
| Party | Candidate | Votes | % | ± | |
|---|---|---|---|---|---|
| Labour | Khalid Mahmood | 23,697 | 57.4 | ||
| Conservative | Charlotte Hodivala | 8,869 | 21.5 | ||
| UKIP | Harjinder Singh | 5,032 | 12.2 | ||
| Liberal Democrats | Harjun Singh | 2,001 | 4.8 | ||
| Green | James Lovatt | 1,330 | 3.2 | N/A | |
| TUSC | Robert Punton | 331 | 0.8 | N/A | |
| Majority | 14,828 | 35.9 | |||
| Turnout | 41,260 | 59.0 | |||
| Labour hold | Swing | ||||
| Party | Candidate | Votes | % | ± | |
|---|---|---|---|---|---|
| Labour | Khalid Mahmood | 21,142 | 50.3 | ||
| Liberal Democrats | Karen Hamilton | 9,234 | 22.0 | ||
| Conservative | William Norton | 8,960 | 21.3 | ||
| UKIP | Melvin J. Ward | 1,675 | 4.0 | ||
| Socialist Labour | John Tyrrell | 527 | 1.3 | ||
| Christian | Deborah Hey-Smith | 507 | 1.2 | N/A | |
| Majority | 11,908 | 28.3 | |||
| Turnout | 42,045 | 59.0 | |||
| Labour hold | Swing | ||||
Elections in the 2000s
| Party | Candidate | Votes | % | ± | |
|---|---|---|---|---|---|
| Labour | Khalid Mahmood | 18,269 | 47.0 | ||
| Liberal Democrats | Jonathan A. Hunt | 10,321 | 26.5 | ||
| Conservative | Naweed Khan | 6,513 | 16.7 | ||
| Respect | Mohammad Naseem | 2,173 | 5.6 | N/A | |
| Socialist Labour | Rajinder Clair | 890 | 2.3 | ||
| UKIP | Bimla Balu | 745 | 1.9 | ||
| Majority | 7,948 | 20.5 | |||
| Turnout | 38,911 | 55.5 | |||
| Labour hold | Swing | ||||
| Party | Candidate | Votes | % | ± | |
|---|---|---|---|---|---|
| Labour | Khalid Mahmood | 17,415 | 46.5 | ||
| Conservative | David Binns | 8,662 | 23.1 | ||
| Liberal Democrats | Jonathan A. Hunt | 8,566 | 22.9 | ||
| Socialist Labour | Avtar Singh Jouhl | 1,544 | 4.1 | N/A | |
| Socialist Alliance | Caroline Johnson | 465 | 1.2 | N/A | |
| UKIP | Natalya Nattrass | 352 | 0.9 | N/A | |
| Marxist Party | Michael Roche | 221 | 0.6 | N/A | |
| Muslim Party | Robert L. Davidson | 192 | 0.5 | N/A | |
| Majority | 8,753 | 23.4 | |||
| Turnout | 37,417 | 52.6 | |||
| Labour hold | Swing | ||||
Elections in the 1990s
| Party | Candidate | Votes | % | ± | |
|---|---|---|---|---|---|
| Labour | Jeff Rooker | 28,921 | 63.0 | ||
| Conservative | Andrew Dunnett | 9,964 | 21.7 | ||
| Liberal Democrats | Raymond Hassall | 4,523 | 9.9 | ||
| Referendum | Saeed Mahmood | 843 | 1.8 | N/A | |
| Liberal | William Baxter | 718 | 1.6 | N/A | |
| BNP | Lee Windridge | 544 | 1.2 | N/A | |
| Independent | Avtar Singh Panesar | 374 | 0.8 | N/A | |
| Majority | 18,957 | 41.3 | |||
| Turnout | 45,887 | 64.5 | |||
| Labour hold | Swing | ||||
| Party | Candidate | Votes | % | ± | |
|---|---|---|---|---|---|
| Labour | Jeff Rooker | 27,507 | 53.2 | ||
| Conservative | Graham G. Green | 18,917 | 36.6 | ||
| Liberal Democrats | Toby P.J.G. Philpott | 5,261 | 10.2 | ||
| Majority | 8,590 | 16.6 | |||
| Turnout | 51,685 | 71.6 | |||
| Labour hold | Swing | ||||
Elections in the 1980s
| Party | Candidate | Votes | % | ± | |
|---|---|---|---|---|---|
| Labour | Jeff Rooker | 25,894 | 50.4 | ||
| Conservative | John Taylor | 18,961 | 36.9 | ||
| Liberal | David D. Webb | 6,514 | 12.7 | ||
| Majority | 6,933 | 13.5 | |||
| Turnout | 51,369 | 69.6 | |||
| Labour hold | Swing | ||||
| Party | Candidate | Votes | % | ± | |
|---|---|---|---|---|---|
| Labour | Jeff Rooker | 27,061 | 52.5 | ||
| Conservative | Michael Portillo | 19,659 | 38.2 | ||
| Liberal | Cecil Gus-Williams | 4,773 | 9.3 | ||
| Majority | 7,402 | 14.4 | |||
| Turnout | 51,493 | 69.2 | |||
| Labour hold | Swing | ||||
Elections in the 1970s
| Party | Candidate | Votes | % | ± | |
|---|---|---|---|---|---|
| Labour | Jeff Rooker | 18,674 | 47.6 | ||
| Conservative | Joseph Kinsey | 18,183 | 46.3 | ||
| Liberal | Olive Lillian Griffiths | 1,811 | 4.6 | ||
| National Front | Keith Axon | 582 | 1.5 | ||
| Majority | 491 | 1.2 | |||
| Turnout | 39,250 | 75.8 | |||
| Labour hold | Swing | ||||
| Party | Candidate | Votes | % | ± | |
|---|---|---|---|---|---|
| Labour | Jeff Rooker | 18,291 | 47.5 | ||
| Conservative | Joseph Kinsey | 15,087 | 39.2 | ||
| Liberal | Kenneth John Hovers | 4,231 | 11.0 | ||
| National Front | Ralph Joseph Warren | 826 | 2.1 | ||
| More Prosperous Britain | Thomas Leslie Keen | 86 | 0.2 | N/A | |
| Majority | 3,204 | 8.3 | |||
| Turnout | 38,521 | 73.4 | |||
| Labour hold | Swing | ||||
| Party | Candidate | Votes | % | ± | |
|---|---|---|---|---|---|
| Labour | Jeff Rooker | 17,960 | 44.0 | ||
| Conservative | Joseph Kinsey | 15,937 | 39.1 | ||
| Liberal | Kenneth John Hovers | 6,044 | 14.8 | N/A | |
| National Front | Arthur Cosham Shorthouse | 853 | 2.1 | N/A | |
| Majority | 2,023 | 5.0 | |||
| Turnout | 40,794 | 78.3 | + | ||
| Labour gain from Conservative | Swing | ||||
| Party | Candidate | Votes | % | ± | |
|---|---|---|---|---|---|
| Conservative | Joseph Kinsey | 18,083 | 51.8 | ||
| Labour | Christopher Price | 16,817 | 48.2 | ||
| Majority | 1,266 | 3.6 | |||
| Turnout | 34,900 | 70.6 | |||
| Conservative gain from Labour | Swing | ||||
Elections in the 1960s
| Party | Candidate | Votes | % | ± | |
|---|---|---|---|---|---|
| Labour | Christopher Price | 20,222 | 55.0 | ||
| Conservative | Wyndham Davies | 16,557 | 45.0 | − | |
| Majority | 3,665 | 10.0 | |||
| Turnout | 36,779 | 76.2 | |||
| Labour gain from Conservative | Swing | ||||
| Party | Candidate | Votes | % | ± | |
|---|---|---|---|---|---|
| Conservative | Wyndham Davies | 18,483 | 50.5 | ||
| Labour | Charles Howell | 18,156 | 49.5 | ||
| Majority | 327 | 0.9 | |||
| Turnout | 36,639 | 74.9 | |||
| Conservative gain from Labour | Swing | ||||
Elections in the 1950s
| Party | Candidate | Votes | % | ± | |
|---|---|---|---|---|---|
| Labour | Charles Howell | 16,811 | 42.6 | ||
| Conservative | Stanley C Greatrix | 16,628 | 42.2 | ||
| Liberal | Wallace Lawler | 5,611 | 14.2 | N/A | |
| Communist | Bert Pearce | 424 | 1.1 | ||
| Majority | 183 | 0.5 | |||
| Turnout | 39,474 | 78.5 | |||
| Labour hold | Swing | ||||
| Party | Candidate | Votes | % | ± | |
|---|---|---|---|---|---|
| Labour | Charles Howell | 18,732 | 51.0 | ||
| Conservative | Frederick B Hingston | 17,052 | 46.5 | ||
| Communist | Bert Pearce | 928 | 2.5 | N/A | |
| Majority | 1,680 | 4.6 | |||
| Turnout | 36,712 | 72.8 | |||
| Labour hold | Swing | ||||
| Party | Candidate | Votes | % | ± | |
|---|---|---|---|---|---|
| Labour | Cecil Poole | 23,322 | 58.1 | ||
| Conservative | Sarah A Ward | 16,855 | 42.0 | ||
| Majority | 6,467 | 16.1 | |||
| Turnout | 40,177 | 81.1 | |||
| Labour hold | Swing | ||||
| Party | Candidate | Votes | % | ± | |
|---|---|---|---|---|---|
| Labour | Cecil Poole | 23,178 | 56.6 | N/A | |
| Conservative | Edward Boyle | 15,172 | 37.1 | N/A | |
| Liberal | Frances Nora Hinks | 2,581 | 6.3 | N/A | |
| Majority | 8,006 | 19.6 | N/A | ||
| Turnout | 40,931 | 83.0 | N/A | ||
| Labour win (new seat) | |||||
Notes and references
- Notes
- A borough constituency (for the purposes of election expenses and type of returning officer)
- As with all constituencies, the constituency elects one Member of Parliament (MP) by the first past the post system of election at least every five years.
- References
- "Birmingham, Perry Barr: Usual Resident Population, 2011". Neighbourhood Statistics. Office for National Statistics. Retrieved 30 January 2015.
- "Electorate Figures - Boundary Commission for England". 2011 Electorate Figures. Boundary Commission for England. 4 March 2011. Archived from the original on 6 November 2010. Retrieved 13 March 2011.
- Leigh Rayment's Historical List of MPs – Constituencies beginning with "P" (part 1)
- Craig, F.W.S., ed. (1972). Boundaries of parliamentary constituencies 1985-1972. Chichester, Sussex: Political Reference Publications. ISBN 0-900178-09-4.
- "Birmingham Perry Barr Parliamentary constituency". BBC News. BBC. Retrieved 13 December 2019.
- "Parliamentary General Election Results December 2019". Birmingham City Council. Retrieved 13 December 2019.
- "Statement of Persons Nominated and notice of poll". Birmingham City Council. Retrieved 11 May 2017.
- "Birmingham Perry Barr results". BBC News. Retrieved 9 June 2017.
- "Election Data 2015". Electoral Calculus. Archived from the original on 17 October 2015. Retrieved 17 October 2015.
- "Election Data 2010". Electoral Calculus. Archived from the original on 26 July 2013. Retrieved 17 October 2015.
- "Statement of Persons Nominated and Notice of Poll 2010" (PDF).
- "Election Data 2005". Electoral Calculus. Archived from the original on 15 October 2011. Retrieved 18 October 2015.
- "Election Data 2001". Electoral Calculus. Archived from the original on 15 October 2011. Retrieved 18 October 2015.
- "Election Data 1997". Electoral Calculus. Archived from the original on 15 October 2011. Retrieved 18 October 2015.
- "Election Data 1992". Electoral Calculus. Archived from the original on 15 October 2011. Retrieved 18 October 2015.
- "UK General Election results April 1992". Richard Kimber's Political Science Resources. Politics Resources. 9 April 1992. Archived from the original on 11 August 2011. Retrieved 6 December 2010.
- "Election Data 1987". Electoral Calculus. Archived from the original on 15 October 2011. Retrieved 18 October 2015.
- "UK General Election results June 1992". Richard Kimber's Political Science Resources. Politics Resources. 11 June 1987. Archived from the original on 5 March 2012. Retrieved 24 December 2012.
- "Election Data 1983". Electoral Calculus. Archived from the original on 15 October 2011. Retrieved 18 October 2015.
- "UK General Election results June 1983". Richard Kimber's Political Science Resources. Politics Resources. 9 June 1983. Archived from the original on 11 August 2011. Retrieved 24 December 2012.
- "UK General Election results May 1979". Richard Kimber's Political Science Resources. Politics Resources. 28 May 1979. Archived from the original on 11 August 2011. Retrieved 24 December 2012.
- "UK General Election results October 1974". Richard Kimber's Political Science Resources. Politics Resources. 10 October 1974. Archived from the original on 23 June 2013. Retrieved 24 December 2012.
- "UK General Election results February 1974". Richard Kimber's Political Science Resources. Politics Resources. 28 February 1974. Archived from the original on 23 June 2013. Retrieved 24 December 2012.
- "UK General Election results June 1970". Richard Kimber's Political Science Resources. Politics Resources. 18 June 1970. Archived from the original on 23 June 2013. Retrieved 24 December 2012.
- "UK General Election results March 1966". Richard Kimber's Political Science Resources. Politics Resources. 31 March 1966. Archived from the original on 23 June 2013. Retrieved 24 December 2012.
- "UK General Election results October 1964". Richard Kimber's Political Science Resources. Politics Resources. 15 October 1964. Archived from the original on 20 September 2011. Retrieved 24 December 2012.
- "UK General Election results October 1959". Richard Kimber's Political Science Resources. Politics Resources. 8 October 1959. Archived from the original on 23 June 2013. Retrieved 24 December 2012.
- "UK General Election results May 1955". Richard Kimber's Political Science Resources. Politics Resources. 26 May 1955. Archived from the original on 23 June 2013. Retrieved 24 December 2012.
- "UK General Election results October 1951". Richard Kimber's Political Science Resources. Politics Resources. 25 October 1951. Archived from the original on 23 June 2013. Retrieved 24 December 2012.
- "UK General Election results February 1950". Richard Kimber's Political Science Resources. Politics Resources. 23 February 1974. Archived from the original on 23 June 2013. Retrieved 24 December 2012.
External links
This article is issued from Wikipedia. The text is licensed under Creative Commons - Attribution - Sharealike. Additional terms may apply for the media files.