Macro-haplogroup L (mtDNA)
In human mitochondrial genetics, L is the mitochondrial DNA macro-haplogroup that is at the root of the anatomically modern human (Homo sapiens) mtDNA phylogenetic tree. As such, it represents the most ancestral mitochondrial lineage of all currently living modern humans, also dubbed "Mitochondrial Eve".
| Haplogroup L | |
|---|---|
| Time of origin | 230 to 150 kya[1][2] |
| Place of origin | Eastern Africa[3] |
| Descendants | L0, L1-6 |
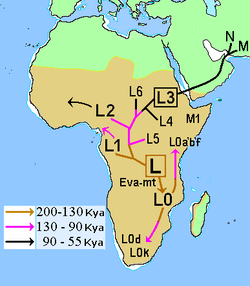
Its two sub-clades are L1-6 and L0. The split occurred during the Penultimate Glacial Period; L1-6 is estimated to have formed ca. 170 kya, and L0 ca. 150 kya. The formation of L0 is associated with the peopling of Southern Africa by populations ancestral to the Khoisan, ca. 140 kya, at the onset of the Eemian interglacial. L1-6 is further subdivided into L2-6 and L1, dated ca. 150 kya and 130 kya, respectively. Haplogroups L5 (120 kya), L2 and L6 (90 kya), L4 (80 kya) and L3 (70 kya) derive from L2-6.
Origin
The outgroup for mtDNA phylogeny of modern humans is the mtDNA of archaic humans, specifically Neanderthals and Denisovans. The split of the modern human lineage from the Neanderthal and Denisovan lineage is dated to between ca. 760–550 kya based on full genome analysis. This is consistent with the estimate based on Y-chromosomal DNA, which places the split between ca. 806–447 kya.[4] In terms of mtDNA, however, it appears that modern humans and Neanderthals form a sister clade, with Denisovans as basal outgroup. The split of Neanderthal and modern human mtDNA is dated to about 498–295 kya, i.e. significantly younger than the date estimated based on nuclear DNA. This has been explained as reflecting early gene flow from Africa into the Neanderthal genome, around 270 kya or earlier, i.e. around the time of the first emergence of anatomically modern humans (Jebel Irhoud). Posth et al. (2017) suggest the possibility that early Homo sapiens mtDNA from Africa may have replaced the original Neanderthal mtDNA entirely even when assuming minimal admixture. The Neanderthal and Denisovan lineages diverged before about 430 kya, and Denisovan mtDNA was not affected by the introgression. [4]
The most recent common ancestor of modern human mtDNA (dubbed "Mitochondrial Eve") is dated to ca. 230–150 kya. The emergence of haplogroup L1-6 by definition dates a later time, at an estimated 200–130 kya,[1] possibly in a population in eastern Africa.[3] Haplogroup L0 emerges from the basal haplogroup L1-6* somewhat later, at an estimated 190–110 kya.
The deep time depth of these lineages entails that substructure of this haplogroup within Africa is complex and poorly understood.[5] Date estimates are necessarily imprecise. The intervals cited above represent high and low estimates of the 95% confidence interval following Soares et al. (2009), the most likely ages are to be taken near the center of these intervals.[1]
Phylogeny
L1-6
| Haplogroup L1-6 | |
|---|---|
| Possible time of origin | 200 to 130 kya[6] |
| Ancestor | L (Mitochondrial Eve) |
| Descendants | L1, L2-6 |
| Defining mutations | 146, 182, 4312, 10664, 10915, 11914, 13276, 16230[7] |
| Haplogroup L phylogeny | |||||||||||||||||||||||||||||||||||||||||||||||||||||||||||||||||||||
|
Haplogroup L1-6 (also L1'2'3'4'5'6, or L(3'4'6'2'5)'1) split off undifferentiated haplogroup L roughly 20,000 years after Mitochondrial Eve, or at roughly 170,000 years ago (167±36 kya in the estimate of Soares et al. 2009). It diverged, in its turn, into L1 (150 kya), L5 (120 kya), and L2 (90 kya) before the recent out-of Africa event of ca. 70 kya. L3 emerges around 70 kya and is closely associated with the out-of-Africa event; it may have arisen either in East Africa or in Asia. L6 and L4 are a sister clades of L3, but they are limited to East Africa and did not participate in the out-of-Africa migration.
Undifferentiated L1'2'3'4'5'6 has been found in Neanderthal fossils from the Caucasus (Mezmaiskaya cave) and the Altai (Denisova Cave), dated to before 50 kya. This suggests that an earlier wave of expansion of Homo sapiens left Africa between about 200–130 kya (during the Penultimate Glacial Period, c.f. Skhul and Qafzeh hominins) and left genetic traces by interbreeding with Neanderthals before disappearing.[8]
Haplogroup L1 diverged from L1-6 at about 140,000 years ago. Its emergence is associated with the early peopling of Africa by anatomically modern humans during the Eemian, and it is now mostly found in African pygmies.
Haplogroup L5 was formerly classified as L1e, but is now recognized as having diverged from L2-6 (also L2'3'4'5'6, or L(3'4'6'2)'5) at about 120 kya. It is also mostly associated with pygmies, with highest frequency in Mbuti pygmies from Eastern Central Africa at 15%.[9]
Haplogroup L2 diverged from L(3'4'6)'2 at about 90 kya, associated with the peopling of West Africa. As a result of the Bantu migration it is now widespread throughout Sub-Saharan Africa, at the expense of the previously more widespread L0, L1 and L5.[10]
Haplogroup L6 diverged from L3'4'6 at about the same time, ca. 90 kya. It is now a minor haplogroup with distribution mostly limited to the Horn of Africa and southern Arabia.
Haplogroup L3 diverged from L3'4 at about 70 kya, likely shortly before the Southern Dispersal event (Out-of-Africa migration), possibly in East Africa. The mtDNA of all non-Africans is derived from L3, divided into two main lineages, M and N.
Haplogroup L4 is a minor haplogroup of East Africa that arose around 70 kya but did not participate in the out-of-Africa migration. The haplogroup formerly named L7 has been re-classified as a subclade of L4, named L4a.
L0
Haplogroup L0 arose between about 200 and 130 kya,[11] that is, at about the same time as L1, before the beginning of the Eemian. It is associated with the peopling of Southern Africa after about 140,000 years ago.
Its subclades are L0d and L0k. Both are almost exclusively restricted to the Khoisan of southern Africa, but L0d has also been detected among the Sandawe people of Tanzania, which suggests an ancient connection between the Khoisan and East African speakers of click languages.[12]
Haplogroup L0f is present in relatively small frequencies in Tanzania among the Sandawe people who are known to be older then the Khoisan. L0a is most prevalent in South-East African populations (25% in Mozambique), and L0b is found in Ethiopia.
Distribution
Putting aside its sub-branches, haplogroups M and N, the L haplogroups are predominant all over sub-Saharan Africa; L is at 96–100%, apart. It is found in North Africa, Arabian Peninsula, Middle East, Americas, Europe, ranging from low to high frequencies depending on the country.
Africa
With the exception of a number of lineages that returned to Africa from Eurasia after the out of Africa migration, all African lineages belong to haplogroup L. The "back-to-Africa" haplogroups including U6, X1 and possibly M1 have returned to Africa possibly as far back as 45,000 years ago.[13] Haplogroup H, which is common among Berbers, is also believed to have entered Africa from Europe during the post-glacial expansion.[14] The mutations that are used to identify the basal lineages of haplogroup L, are ancient and may be 150,000 years old. The deep time depth of these lineages entails that substructure of this haplogroup within Africa is complex and, at present, poorly understood.[5] The first split within haplogroup L occurred 140–200kya, with the mutations that define macrohaplogroups L0 and L1-6. These two haplogroups are found throughout Africa at varying frequencies and thus exhibit an entangled pattern of mtDNA variation. However the distribution of some subclades of haplogroup L is structured around geographic or ethnic units. For example, the deepest clades of haplogroup L0, L0d and L0k are almost exclusively restricted to the Khoisan of southern Africa. L0d has also been detected among the Sandawe of Tanzania, which suggests an ancient connection between the Khoisan and East African populations.[12]

- North Africa.[15][16]
- Sudan.[16]
- Ethiopia.[16][17]
- West Africa.[15]
- East Africa (Kenya, Uganda, Tanzania).[16][18][19]
- Southeast Africa (Mozambique).[20]
- Native Southern Africans (!Xung, !Kung and Khwe khoisans).[18][21]
- Mbenga Pygmies (Baka, Bi-Aka and Ba-Kola).[18][22]
- Ba-Mbuti Pygmies.[18]
- Hadza/Sandawe.[18]
North Africa
Haplogroup L is also found at moderate frequencies in North Africa. For example, the various Berber populations have frequencies of haplogroup L lineages that range from 3% to 45%.[23][24] Haplogroup L has also been found at a small frequency of 2.2% in North African Jews from Morocco, Tunisia and Libya. Frequency was the highest in Libyan Jews 3.6%.[25] Moroccan Arabs have more elevated SSA maternal admixture at around 21% to 36% Via L-mtDNA sequences, Highest frequencies of L-mtDNA is reported to Moroccan Arabs of The Surrounding area of El jadida at 33%[26]
West Asia
Haplogroup L is also found in West Asia at low to moderate frequencies, most notably in Yemen where frequencies as high as 60% have been reported.[27] It is also found at 15.50% in Bedouins from Israel, 13.68% in Palestinians, 12.55% in Jordanians, 9.48% in Iraqis, 9.15% in Syrians, 7.5% in the Hazara of Afghanistan, 6.66% in Saudi Arabians, 2.84% in Lebanese, 2.60% in Druzes from Israel, 2.44% in Kurds and 1.76% in Turks.[28][29] Overall the Arab slave trade and expansion of foreign empires that encapsulated Saudi Arabia were linked to the negligible presence of haplogroup L in the Saudi Arabian gene pool.[30]
Europe
In Europe, haplogroup L is found at low frequencies, typically less than 1% with the exception of Iberia (Spain and Portugal) where regional frequencies as high as 18.2% have been reported and some regions of Italy where frequencies between 2 and 3% have been found. Overall frequency in Iberia is higher in Portugal than in Spain where frequencies are only high in the south and west of the country. Increasing frequencies are observed for Galicia (3.26%) and northern Portugal (3.21%), through the center (5.02%) and to the south of Portugal (11.38%).[31] Relatively high frequencies of 7.40% and 8.30% were also reported respectively in South Spain, in the present population of Huelva and Priego de Cordoba by Casas et al. 2006.[32] Significant frequencies were also found in the Autonomous regions of Portugal, with L haplogroups constituting about 13% of the lineages in Madeira and 3.4% in the Azores. In the Spanish archipelago of Canary Islands, frequencies have been reported at 6.6%.[33] According to some researchers L lineages in Iberia are associated to Islamic invasions, while for others it may be due to more ancient processes as well as more recent ones through the introduction of these lineages by means of the modern slave trade. The highest frequency (18.2%) of Sub-Saharan lineages found so far in Europe were observed by Alvarez et al. 2010 in the comarca of Sayago in Spain and in Alcacer do Sal in Portugal.[34][35] In Italy, Haplogroup L lineages are present in some regions at frequencies between 2 and 3% in Latium (2.90%), parts of Tuscany,[29] Basilicata and Sicily.[36] In 2015 study found that a prehistoric episode would be the main contributor to the sub-Saharan presence in Mediterranean Europe and Iberia [37] A 2018 study ascribed high levels of African admixture in Spain and Portugal to two separate episodes, one during the North African Islamic expansions into Iberia and one later one, possibly related to the slave trade.[38]
The Americas
Haplogroup L lineages are found in the African diaspora of the Americas as well as indigenous Americans. Haplogroup L lineages are predominant among African Americans, Afro-Caribbeans and Afro-Latin-Americans. In Brazil, Pena et al. report that 85% of self-identified Afro-Brazilians have Haplogroup L mtDNA sequences.[39] Haplogroup L lineages are also found at moderate frequencies in self-identified White Brazilians. Alves Silva reports that 28% of a sample of White Brazilians belong to haplogroup L.[40] In Argentina, a minor contribution of African lineages was observed throughout the country.[41] Haplogroup L lineages were also reported at 8% in Colombia,[42] and at 4.50% in North-Central Mexico.[43] In North America, haplogroup L lineages were reported at a frequency of 0.90% in White Americans of European ancestry.[44]
Haplogroup L Frequencies (> 1%)
| Region | Population or Country | Number tested | Reference | % |
| North Africa | Libya (Jews) | 83 | Behar et al. (2008) | 3.60% |
| North Africa | Tunisia (Jews) | 37 | Behar et al. (2008) | 2.20% |
| North Africa | Morocco (Jews) | 149 | Behar et al. (2008) | 1.34% |
| North Africa | Tunisia | 64 | Turchi et al. (2009) | 48.40% |
| North Africa | Tunisia (Takrouna) | 33 | Frigi et al. (2006) | 3.03% |
| North Africa | Tunisia (Zriba) | 50 | Turchi et al. (2009) | 8.00% |
| North Africa | Morocco | 56 | Turchi et al. (2009) | 26.80% |
| North Africa | Morocco (Berbers) | 64 | Turchi et al. (2009) | 3.20% |
| North Africa | Algeria (Mozabites) | 85 | Turchi et al. (2009) | 12.90% |
| North Africa | Algeria | 47 | Turchi et al. (2009) | 20.70% |
| Europe | Italy (Latium) | 138 | Achilli et al. (2007) | 2.90% |
| Europe | Italy (Volterra) | 114 | Achilli et al. (2007) | 2.60% |
| Europe | Italy (Basilicata) | 92 | Ottoni et al. (2009) | 2.20% |
| Europe | Italy (Sicily) | 154 | Ottoni et al. (2009) | 2.00% |
| Europe | Malta | 132 | Caruana et al. (2016) | 15.90%[45] |
| Europe | Spain | 312 | Alvarez et al. (2007) | 2.90% |
| Europe | Spain (Galicia) | 92 | Pereira et al. (2005) | 3.30% |
| Europe | Spain (North East) | 118 | Pereira et al. (2005) | 2.54% |
| Europe | Spain (Priego de Cordoba) | 108 | Casas et al. (2006) | 8.30% |
| Europe | Spain (Zamora) | 214 | Alvarez et al. (2010) | 4.70% |
| Europe | Spain (Sayago) | 33 | Alvarez et al. (2010) | 18.18% |
| Europe | Spain (Catalonia) | 101 | Alvarez-Iglesias et al. (2009) | 2.97% |
| Europe | South Iberia | 310 | Casas et al. (2006) | 7.40% |
| Europe | Spain (Canaries) | 300 | Brehm et al. (2003) | 6.60% |
| Europe | Spain (Balearic Islands) | 231 | Picornell et al. (2005) | 2.20% |
| Europe | Spain (Andalusia) | 1004 | Barral-Arca et al. (2016) | 2.6% |
| Europe | Spain (Castilla y Leon) | 428 | Barral-Arca et al. (2016) | 2.1% |
| Europe | Spain (Aragón) | 70 | Barral-Arca et al. (2016) | 4.3% |
| Europe | Spain (Asturias) | 99 | Barral-Arca et al. (2016) | 4.0% |
| Europe | Spain (Galicia) | 98 | Barral-Arca et al. (2016) | 2.0% |
| Europe | Spain (Madrid) | 178 | Barral-Arca et al. (2016) | 1.70% |
| Europe | Spain (Castilla-La Mancha) | 207 | Barral-Arca et al. (2016) | 1.40% |
| Europe | Spain (Extremadura) | 87 | Barral-Arca et al. (2016) | 1.10% |
| Europe | Spain (Huelva) | 280 | Hernández et al. (2015) | 3.93% |
| Europe | Spain (Granada) | 470 | Hernández et al. (2015) | 1.49% |
| Europe | Portugal | 594 | Achilli et al. (2007) | 6.90% |
| Europe | Portugal (North) | 188 | Achilli et al. (2007) | 3.19% |
| Europe | Portugal (Central) | 203 | Achilli et al. (2007) | 6.40% |
| Europe | Portugal (South) | 203 | Achilli et al. (2007) | 10.84% |
| Europe | Portugal | 549 | Pereira et al. (2005) | 5.83% |
| Europe | Portugal (North) | 187 | Pereira et al. (2005) | 3.21% |
| Europe | Portugal (Central) | 239 | Pereira et al. (2005) | 5.02% |
| Europe | Portugal (South) | 123 | Pereira et al. (2005) | 11.38% |
| Europe | Portugal (Madeira) | 155 | Brehm et al. (2003) | 12.90% |
| Europe | Portugal (Açores) | 179 | Brehm et al. (2003) | 3.40% |
| Europe | Portugal (Alcacer do Sal) | 50 | Pereira et al. (2010) | 22.00% |
| Europe | Portugal (Coruche) | 160 | Pereira et al. (2010) | 8.70% |
| Europe | Portugal (Pias) | 75 | Pereira et al. (2010) | 3.90% |
| Europe | Portugal | 1429 | Barral-Arca et al. (2016) | 6.16% |
| West Asia | Yemen | 115 | Kivisild et al. (2004) | 45.70% |
| West Asia | Yemen (Jews) | 119 | Behar et al. (2008) | 16.81% |
| West Asia | Bedouins (Israel) | 58 | Behar et al. (2008) | 15.50% |
| West Asia | Palestinians (Israel) | 117 | Achilli et al. (2007) | 13.68% |
| West Asia | Jordania | 494 | Achilli et al. (2007) | 12.50% |
| West Asia | Iraq | 116 | Achilli et al. (2007) | 9.48% |
| West Asia | Syria | 328 | Achilli et al. (2007) | 9.15% |
| West Asia | Saudi Arabia | 120 | Abu-Amero et al. (2007) | 6.66% |
| West Asia | Lebanon | 176 | Achilli et al. (2007) | 2.84% |
| West Asia | Druzes (Israel) | 77 | Behar et al. (2008) | 2.60% |
| West Asia | Kurds | 82 | Achilli et al. (2007) | 2.44% |
| West Asia | Turkey | 340 | Achilli et al. (2007) | 1.76% |
| South America | Colombia (Antioquia) | 113 | Bedoya et al. (2006) | 8.00% |
| North America | Mexico (North-Central) | 223 | Green et al. (2000) | 4.50% |
| South America | Argentina | 246 | Corach et al. (2009) | 2.03% |
See also
- Peopling of Africa
- Homo sapiens
- Recent African origin of modern humans
- Middle Stone Age
References
- 151.6–233.6 ka 95% CI according to: Soares P, Ermini L, Thomson N, et al. (June 2009). "Correcting for purifying selection: an improved human mitochondrial molecular clock". Am. J. Hum. Genet. 84 (6): 740–59. doi:10.1016/j.ajhg.2009.05.001. PMC 2694979. PMID 19500773.
- Age estimates (ka, 95% CI in angular brackets): ML whole-mtDNA age estimate: 178.8 [155.6; 202.2], ρ whole-mtDNA age estimate: 185.2 [153.8; 216.9], ρ synonymous age estimate (ka): 174.8 [153.8; 216.9]: Rito T, Richards MB, Fernandes V, Alshamali F, Cerny V, Pereira L, Soares P., "The first modern human dispersals across Africa", PLoS One 2013 Nov 13; 8(11):e80031. doi: 10.1371/journal.pone.0080031.
- Gonder MK, Mortensen HM, Reed FA, de Sousa A, Tishkoff SA (March 2007). "Whole-mtDNA genome sequence analysis of ancient African lineages". Mol. Biol. Evol. 24 (3): 757–68. doi:10.1093/molbev/msl209. PMID 17194802.
- Cosimo Posth et al., "Deeply divergent archaic mitochondrial genome provides lower time boundary for African gene flow into Neanderthals" Nature Communications 8 (23 March 2017), doi:10.1038/ncomms16046.
- Behar DM, Villems R, Soodyall H, et al. (May 2008). "The dawn of human matrilineal diversity". American Journal of Human Genetics. 82 (5): 1130–40. doi:10.1016/j.ajhg.2008.04.002. PMC 2427203. PMID 18439549.
-
166.8+36.7
−36.1 kya (Soares et al. 2009). - van Oven, Mannis; Manfred Kayser (13 Oct 2008). "Updated comprehensive phylogenetic tree of global human mitochondrial DNA variation". Human Mutation. 30 (2): E386–E394. doi:10.1002/humu.20921. PMID 18853457. Archived from the original on 4 December 2012. Retrieved 2009-05-20.
- Briggs, A. W., Good, J. M., Green, R. E., Krause, J., Maricic, T., Stenzel, U., et al. "Targeted Retrieval and Analysis of Five Neandertal mtDNA Genomes", Science 325 (2009), 318–321, doi:10.1126/science.1174462. Renata C. Ferreira, Camila R. Rodrigues, James R. Broach, "Neandertal signatures in modern human mitochondrial genome haplogroups?" (2018), doi:10.1101/190363.
- Sarah A. Tishkoff et al. 2007, History of Click-Speaking Populations of Africa Inferred from mtDNA and Y Chromosome Genetic Variation. Molecular Biology and Evolution 2007 24(10):2180-2195
- Marina Silva, Farida Alshamali, Paula Silva, Carla Carrilho, Flávio Mandlate, Maria Jesus Trovoada, Viktor Černý, Luísa Pereira, Pedro Soares, "60,000 years of interactions between Central and Eastern Africa documented by major African mitochondrial haplogroup L2", Sci Rep. 2015; 5: 12526, doi:10.1038/srep12526
- point estimate 168.5 ka (136.3–201.1 ka 95% CI) according to Heinz, Tanja; et al. (2017). "Updating the African human mitochondrial DNA tree: Relevance to forensic and population genetics". Forensic Science International: Genetics. 27: 156–159. doi:10.1016/j.fsigen.2016.12.016. PMID 28086175. (table 2). 150 ka suggested in:Soares, Pedro; Ermini, Luca; Thomson, Noel; Mormina, Maru; Rito, Teresa; Röhl, Arne; Salas, Antonio; Oppenheimer, Stephen; MacAulay, Vincent (2009). "Correcting for Purifying Selection: An Improved Human Mitochondrial Molecular Clock". The American Journal of Human Genetics. 84 (6): 740–59. doi:10.1016/j.ajhg.2009.05.001. PMC 2694979. PMID 19500773..
- Gonder MK, Mortensen HM, Reed FA, de Sousa A, Tishkoff SA (March 2007). "Whole-mtDNA genome sequence analysis of ancient African lineages". Molecular Biology and Evolution. 24 (3): 757–68. doi:10.1093/molbev/msl209. PMID 17194802.
the presence of haplogroups N1 and J in Tanzania suggest "back" migration from the Middle East or Eurasia into eastern Africa, which has been inferred from previous studies of other populations in eastern Africa
- Olivieri A, Achilli A, Pala M, et al. (December 2006). "The mtDNA legacy of the Levantine early Upper Palaeolithic in Africa". Science. 314 (5806): 1767–70. Bibcode:2006Sci...314.1767O. doi:10.1126/science.1135566. PMID 17170302.
- Cherni L, Fernandes V, Pereira JB, et al. (June 2009). "Post-last glacial maximum expansion from Iberia to North Africa revealed by fine characterization of mtDNA H haplogroup in Tunisia". American Journal of Physical Anthropology. 139 (2): 253–60. doi:10.1002/ajpa.20979. PMID 19090581.
- Rosa A. et al. 2004, MtDNA Profile of West Africa Guineans: Towards a Better Understanding of the Senegambia Region.
- Abu-Amero KK, Larruga JM, Cabrera VM, González AM (2008). "Mitochondrial DNA structure in the Arabian Peninsula". BMC Evol. Biol. 8: 45. doi:10.1186/1471-2148-8-45. PMC 2268671. PMID 18269758.
- Kivisild T, Reidla M, Metspalu E, et al. (November 2004). "Ethiopian mitochondrial DNA heritage: tracking gene flow across and around the gate of tears". Am. J. Hum. Genet. 75 (5): 752–70. doi:10.1086/425161. PMC 1182106. PMID 15457403.
- Tishkoff SA, Gonder MK, Henn BM, et al. (October 2007). "History of click-speaking populations of Africa inferred from mtDNA and Y chromosome genetic variation". Mol. Biol. Evol. 24 (10): 2180–95. doi:10.1093/molbev/msm155. PMID 17656633.
- Anderson, Sadie 2006, Phylogenetic and phylogeographic analysis of African mitochondrial DNA variation. Archived 2011-09-10 at the Wayback Machine
- Salas A, Richards M, De la Fe T, et al. (November 2002). "The making of the African mtDNA landscape". Am. J. Hum. Genet. 71 (5): 1082–111. doi:10.1086/344348. PMC 385086. PMID 12395296.
- Chen YS, Olckers A, Schurr TG, Kogelnik AM, Huoponen K, Wallace DC (April 2000). "mtDNA variation in the South African Kung and Khwe-and their genetic relationships to other African populations". Am. J. Hum. Genet. 66 (4): 1362–83. doi:10.1086/302848. PMC 1288201. PMID 10739760.
- Quintana, Lluis et al 2003, MtDNA diversity in Central Africa: from hunter-gathering to agriculturalism
- Cherni L, Loueslati BY, Pereira L, Ennafaâ H, Amorim A, El Gaaied AB (February 2005). "Female gene pools of Berber and Arab neighboring communities in central Tunisia: microstructure of mtDNA variation in North Africa". Human Biology. 77 (1): 61–70. doi:10.1353/hub.2005.0028. hdl:10216/109267. PMID 16114817.
- Turchi C, Buscemi L, Giacchino E, et al. (June 2009). "Polymorphisms of mtDNA control region in Tunisian and Moroccan populations: an enrichment of forensic mtDNA databases with Northern Africa data". Forensic Science International: Genetics. 3 (3): 166–72. doi:10.1016/j.fsigen.2009.01.014. PMID 19414164.
- Behar DM, Metspalu E, Kivisild T, et al. (2008). MacAulay V (ed.). "Counting the founders: the matrilineal genetic ancestry of the Jewish Diaspora". PLoS ONE. 3 (4): e2062. Bibcode:2008PLoSO...3.2062B. doi:10.1371/journal.pone.0002062. PMC 2323359. PMID 18446216.
- Harich et al 2010 (May 10, 2010). "The trans-Saharan slave trade – clues from interpolation analyses and high-resolution characterization of mitochondrial DNA lineages". BMC Evolutionary Biology. 10: 138. doi:10.1186/1471-2148-10-138. PMC 2875235. PMID 20459715.
- Cerný V, Mulligan CJ, Rídl J, et al. (June 2008). "Regional differences in the distribution of the sub-Saharan, West Eurasian, and South Asian mtDNA lineages in Yemen". American Journal of Physical Anthropology. 136 (2): 128–37. doi:10.1002/ajpa.20784. PMID 18257024.
- Whale, John Willian (September 2012). "Mitochondrial DNA Analysis of Four Ethnic Groups of Afghanistan" (PDF). University of Portsmouth. Archived from the original (PDF) on 2 August 2017. Retrieved 2 August 2017.
- Achilli A, Olivieri A, Pala M, et al. (April 2007). "Mitochondrial DNA variation of modern Tuscans supports the near eastern origin of Etruscans". American Journal of Human Genetics. 80 (4): 759–68. doi:10.1086/512822. PMC 1852723. PMID 17357081.
- Abu-Amero KK, González AM, Larruga JM, Bosley TM, Cabrera VM (2007). "Eurasian and African mitochondrial DNA influences in the Saudi Arabian population". BMC Evolutionary Biology. 7: 32. doi:10.1186/1471-2148-7-32. PMC 1810519. PMID 17331239.
- Pereira L, Cunha C, Alves C, Amorim A (April 2005). "African female heritage in Iberia: a reassessment of mtDNA lineage distribution in present times". Human Biology. 77 (2): 213–29. doi:10.1353/hub.2005.0041. hdl:10216/109268. PMID 16201138.
- Casas MJ, Hagelberg E, Fregel R, Larruga JM, González AM (December 2006). "Human mitochondrial DNA diversity in an archaeological site in al-Andalus: genetic impact of migrations from North Africa in medieval Spain". Am. J. Phys. Anthropol. 131 (4): 539–51. doi:10.1002/ajpa.20463. PMID 16685727.
- Brehm A, Pereira L, Kivisild T, Amorim A (December 2003). "Mitochondrial portraits of the Madeira and Açores archipelagos witness different genetic pools of its settlers". Human Genetics. 114 (1): 77–86. doi:10.1007/s00439-003-1024-3. PMID 14513360.
- Alvarez L, Santos C, Ramos A, Pratdesaba R, Francalacci P, Aluja MP (August 2010). "Mitochondrial DNA patterns in the Iberian Northern plateau: population dynamics and substructure of the Zamora province". Am. J. Phys. Anthropol. 142 (4): 531–39. doi:10.1002/ajpa.21252. PMID 20127843.
- Alvarez L, Santos C, Ramos A, Pratdesaba R, Francalacci P, Aluja MP (August 2010). "Mitochondrial DNA patterns in the Iberian Northern plateau: population dynamics and substructure of the Zamora province". Am. J. Phys. Anthropol. 142 (4): 531–39. doi:10.1002/ajpa.21252. PMID 20127843.
As regards sub-Saharan Hgs (L1b, L2b, and L3b), the high frequency found in the southern regions of Zamora, 18.2% in Sayago and 8.1% in Bajo Duero, is comparable to that described for the South of Portugal
- Ottoni C, Martinez-Labarga C, Vitelli L, et al. (2009). "Human mitochondrial DNA variation in Southern Italy". Annals of Human Biology. 36 (6): 785–811. doi:10.3109/03014460903198509. PMID 19852679.
- Hernández, Candela L.; Soares, Pedro; Dugoujon, Jean M.; Novelletto, Andrea; Rodríguez, Juan N.; Rito, Teresa; Oliveira, Marisa; Melhaoui, Mohammed; Baali, Abdellatif; Pereira, Luisa; Calderón, Rosario (2015). "Early Holocenic and Historic mtDNA African Signatures in the Iberian Peninsula: The Andalusian Region as a Paradigm". PLOS ONE. 10 (10): e0139784. Bibcode:2015PLoSO..1039784H. doi:10.1371/journal.pone.0139784. PMC 4624789. PMID 26509580.
- https://www.biorxiv.org/content/biorxiv/early/2018/03/12/250191.full.pdf
- Pena, S.D.J.; Bastos-Rodrigues, L.; Pimenta, J.R.; Bydlowski, S.P. (2009). "DNA tests probe the genomic ancestry of Brazilians". Brazilian Journal of Medical and Biological Research. 42 (10): 870–76. doi:10.1590/S0100-879X2009005000026. PMID 19738982.
- Alves-Silva J, da Silva Santos M, Guimarães PE, et al. (August 2000). "The ancestry of Brazilian mtDNA lineages". American Journal of Human Genetics. 67 (2): 444–61. doi:10.1086/303004. PMC 1287189. PMID 10873790.
- Bobillo MC, Zimmermann B, Sala A, et al. (August 2009). "Amerindian mitochondrial DNA haplogroups predominate in the population of Argentina: towards a first nationwide forensic mitochondrial DNA sequence database". International Journal of Legal Medicine. 124 (4): 263–68. doi:10.1007/s00414-009-0366-3. PMID 19680675.
- Bedoya G, Montoya P, García J, et al. (May 2006). "Admixture dynamics in Hispanics: a shift in the nuclear genetic ancestry of a South American population isolate". Proceedings of the National Academy of Sciences of the United States of America. 103 (19): 7234–49. Bibcode:2006PNAS..103.7234B. doi:10.1073/pnas.0508716103. PMC 1464326. PMID 16648268.
- Green LD, Derr JN, Knight A (March 2000). "mtDNA affinities of the peoples of North-Central Mexico". American Journal of Human Genetics. 66 (3): 989–98. doi:10.1086/302801. PMC 1288179. PMID 10712213.
- Gonçalves VF, Prosdocimi F, Santos LS, Ortega JM, Pena SD (2007). "Sex-biased gene flow in African Americans but not in American Caucasians". Genetics and Molecular Research. 6 (2): 256–61. PMID 17573655.
- Josef Caruana et al. 2016, The Genetic Heritage of the Maltese Islands: A Matrilineal perspective
External links
| Wikimedia Commons has media related to Macro-haplogroup L (mtDNA). |
- PhyloTree.org – mtDNA subtree L, Macro-haplogroup L by van Oven & Kayser M.
|
Phylogenetic tree of human mitochondrial DNA (mtDNA) haplogroups | |||||||||||||||||||||||||||||||||||||||
| Mitochondrial Eve (L) | |||||||||||||||||||||||||||||||||||||||
| L0 | L1–6 | ||||||||||||||||||||||||||||||||||||||
| L1 | L2 | L3 | L4 | L5 | L6 | ||||||||||||||||||||||||||||||||||
| M | N | ||||||||||||||||||||||||||||||||||||||
| CZ | D | E | G | Q | O | A | S | R | I | W | X | Y | |||||||||||||||||||||||||||
| C | Z | B | F | R0 | pre-JT | P | U | ||||||||||||||||||||||||||||||||
| HV | JT | K | |||||||||||||||||||||||||||||||||||||
| H | V | J | T | ||||||||||||||||||||||||||||||||||||