List of municipalities of the Dominican Republic
The provinces of the Dominican Republic are divided into two or more municipalities (municipios singular municipio) with the exception of the Distrito Nacional which consists of only one municipality – Santo Domingo. They are the second-level political and administrative subdivisions of the country.
 |
|---|
| This article is part of a series on the politics and government of the Dominican Republic |
|
|
Legislature |
|
|
|
Administrative divisions |
|
|
|
The division of the provinces into municipalities is laid down in the constitution (Titulo I Seccion II Art. 5 2002 constitution).[1] and enacted by law. Currently by law 5220 about the territorial division of the Dominican Republic (Ley No. 5220 sobre División Territorial de la República Dominicana) issued 1959 and frequently amended to create new provinces, municipalities and lower level administrative units.
Administration
The municipalities are governed by municipal councils (ayuntamientos) and a mayor (Síndico) elected by their inhabitants as determined by the constitution (Titulo VIII Art. 82 2002 constitution)[1] and law 3455 about the administration of municipalities (Ley 3455 de Organización Municipal).[2]
When a municipality consists of more than one urban center those beside the municipality's seat can be elevated to the status of a municipal district (distrito municipal). A municipal council (Junta Municipal) for such a municipal district is nominated by the municipal council of the municipality to which it belongs (Ley 3455 Titulo I Capitulo IV).[2]
The rural parts of a municipality are divided into districts (Secciones literally sections) which are further divided into neighborhoods (Parajes literally places). The municipal councils appoint district mayors (Alcalde pedáneo) which represent the municipal administration at district level (Ley 3455 Titulo I Capitulo V).[2]
As the municipalities differ largely by population they or the urban centers of them may be cities (Ciudades), the capital of a province or with more than 10,000 inhabitants, towns (Villas), the seat of a municipality or with more than 1,000 inhabitants or villages (Poblados) with less than 1,000 inhabitants.
Municipalities
The following is a list of the 160 municipalities (municipios) of the Dominican Republic as of June 7, 2014.[3]157 Municipios de la Rep. Dominicana
| Name | Province | Created | Population[4] | Area (km2) | Density | Old names |
|---|---|---|---|---|---|---|
| Altamira | Puerto Plata | |||||
| Arenoso | Duarte | |||||
| Azua de Compostela | Azua | |||||
| Baitoa | Santiago | |||||
| Bajos de Haina | San Cristóbal | |||||
| Baní | Peravia | |||||
| Bánica | Elías Piña | |||||
| Bayaguana | Monte Plata | |||||
| Boca Chica | Santo Domingo | |||||
| Bohechío | San Juan | |||||
| Bonao | Monseñor Nouel | |||||
| Cabral | Barahona | |||||
| Cabrera | María Trinidad Sánchez | Tres Amarras | ||||
| Cambita Garabitos | San Cristóbal | |||||
| Castañuela | Monte Cristi | |||||
| Castillo | Duarte | |||||
| Cayetano Germosen | Espaillat | |||||
| Cevicos | Sánchez Ramírez | |||||
| Comendador | Elías Piña | |||||
| Concepción de La Vega | La Vega | |||||
| Constanza | La Vega | |||||
| Consuelo | San Pedro de Macorís | |||||
| Cotuí | Sánchez Ramírez | |||||
| Cristóbal | Independencia | |||||
| Dajabón | Dajabón | |||||
| Duvergé | Independencia | |||||
| El Cercado | San Juan | |||||
| El Factor | María Trinidad Sánchez | |||||
| El Llano | Elías Piña | |||||
| El Peñón | Barahona | |||||
| El Pino | Dajabón | |||||
| El Valle | Hato Mayor | |||||
| Enriquillo | Barahona | |||||
| Esperanza | Valverde | |||||
| Estebanía | Azua | |||||
| Eugenio María de Hostos | Duarte | |||||
| Fantino | Sánchez Ramírez | |||||
| Fundación | Barahona | |||||
| Galván | Bahoruco | |||||
| Gaspar Hernández | Espaillat | |||||
| Guananico | Puerto Plata | |||||
| Guayabal | Azua | |||||
| Guayacanes | San Pedro de Macorís | |||||
| Guaymate | La Romana | |||||
| Guayubín | Monte Cristi | |||||
| Hato Mayor del Rey | Hato Mayor | |||||
| Hondo Valle | Elías Piña | |||||
| Imbert | Puerto Plata | Blanco | ||||
| Jamao al Norte | Espaillat | |||||
| Jánico | Santiago | |||||
| Jaquimeyes | Barahona | |||||
| Jarabacoa | La Vega | |||||
| Jima Abajo | La Vega | |||||
| Jimaní | Independencia | |||||
| Juan de Herrera | San Juan | |||||
| Juan Santiago | Elías Piña | |||||
| La Ciénaga | Barahona | |||||
| La Descubierta | Independencia | |||||
| La Mata | Sánchez Ramírez | |||||
| La Romana | La Romana | |||||
| Laguna Salada | Valverde | |||||
| Las Charcas | Azua | |||||
| Las Guáranas | Duarte | |||||
| Las Matas de Farfán | San Juan | |||||
| Las Matas de Santa Cruz | Monte Cristi | |||||
| Las Terrenas | Samaná | |||||
| Licey al Medio | Santiago | |||||
| Loma de Cabrera | Dajabón | |||||
| Los Alcarrizos | Santo Domingo | |||||
| Los Cacaos | San Cristóbal | |||||
| Los Hidalgos | Puerto Plata | |||||
| Los Ríos | Bahoruco | |||||
| Luperón | Puerto Plata | Bajabónico | ||||
| Maimón | Monseñor Nouel | |||||
| Matanzas | Peravia | |||||
| Mella | Independencia | |||||
| Miches | El Seibo | El Jovero | ||||
| Moca | Espaillat | |||||
| Monción | Santiago Rodríguez | |||||
| Monte Plata | Monte Plata | |||||
| Nagua | María Trinidad Sánchez | San José de Matanzas | ||||
| Neiba | Bahoruco | |||||
| Nizao | Peravia | |||||
| Oviedo | Pedernales | |||||
| Padre Las Casas | Azua | |||||
| Paraíso | Barahona | |||||
| Partido | Dajabón | |||||
| Pedernales | Pedernales | |||||
| Pedro Brand | Santo Domingo | |||||
| Pedro Santana | Elías Piña | |||||
| Pepillo Salcedo | Monte Cristi | Manzanillo | ||||
| Peralta | Azua | |||||
| Peralvillo | Monte Plata | |||||
| Piedra Blanca | Monseñor Nouel | |||||
| Pimentel | Duarte | |||||
| Polo | Barahona | |||||
| Postrer Río | Independencia | |||||
| Pueblo Viejo | Azua | |||||
| Puñal | Santiago | |||||
| Quisqueya | San Pedro de Macorís | |||||
| Ramón Santana | San Pedro de Macorís | |||||
| Rancho Arriba | San José de Ocoa | |||||
| Restauración | Dajabón | |||||
| Río San Juan | María Trinidad Sánchez | |||||
| Sabana de la Mar | Hato Mayor | |||||
| Sabana Grande de Boyá | Monte Plata | |||||
| Sabana Grande de Palenque | San Cristóbal | |||||
| Sabana Iglesia | Santiago | |||||
| Sabana Larga | San José de Ocoa | |||||
| Sabana Yegua | Azua | |||||
| Salcedo | Hermanas Mirabal | Juana Núñez | ||||
| Salinas | Barahona | |||||
| Salvaleón de Higüey | La Altagracia | |||||
| San Antonio de Guerra | Santo Domingo | |||||
| San Cristóbal | San Cristóbal | |||||
| San Felipe de Puerto Plata | Puerto Plata | |||||
| San Fernando de Monte Cristi | Monte Cristi | |||||
| San Francisco de Macorís | Duarte | |||||
| San Gregorio de Nigua | San Cristóbal | |||||
| San Ignacio de Sabaneta | Santiago Rodríguez | |||||
| San José de las Matas | Santiago | |||||
| San José de los Llanos | San Pedro de Macorís | |||||
| San José de Ocoa | San José de Ocoa | |||||
| San Juan de la Maguana | San Juan | |||||
| San Luis | Santo Domingo | |||||
| San Pedro de Macorís | San Pedro de Macorís | |||||
| San Rafael del Yuma | La Altagracia | |||||
| San Víctor | Espaillat | |||||
| Sánchez | Samaná | |||||
| Santa Bárbara de Samaná | Samaná | |||||
| Santa Cruz de Barahona | Barahona | |||||
| Santa Cruz de El Seibo | El Seibo | |||||
| Santa Cruz de Mao | Valverde | |||||
| Santiago de los Caballeros | Santiago | |||||
| Santo Domingo | Distrito Nacional | |||||
| Santo Domingo Este | Santo Domingo | |||||
| Santo Domingo Norte | Santo Domingo | |||||
| Santo Domingo Oeste | Santo Domingo | |||||
| Sosúa | Puerto Plata | |||||
| Tábara Arriba | Azua | |||||
| Tamayo | Bahoruco | |||||
| Tamboril | Santiago | Peña | ||||
| Tenares | Hermanas Mirabal | |||||
| Vallejuelo | San Juan | |||||
| Vicente Noble | Barahona | |||||
| Villa Altagracia | San Cristóbal | |||||
| Villa Bisonó | Santiago | |||||
| Villa González | Santiago | |||||
| Villa Hermosa | La Romana | |||||
| Villa Isabela | Puerto Plata | |||||
| Villa Jaragua | Bahoruco | |||||
| Villa Los Almácigos | Santiago Rodríguez | |||||
| Villa Montellano | Puerto Plata | |||||
| Villa Riva | Duarte | San Antonio del Yuna | ||||
| Villa Tapia | Hermanas Mirabal | La Jagua | ||||
| Villa Vásquez | Monte Cristi | Santa Ana, Villa Isabel | ||||
| Yaguate | San Cristóbal | |||||
| Yamasá | Monte Plata | |||||
| Yayas de Viajama | Azua | |||||
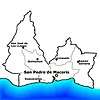
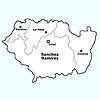
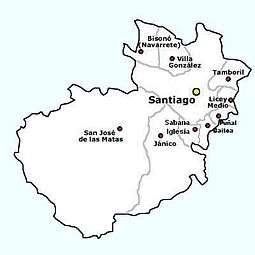
Map
.PNG)
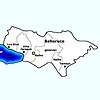
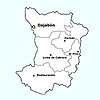
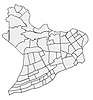
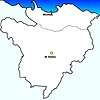
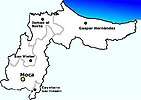
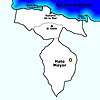
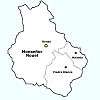
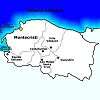
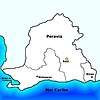
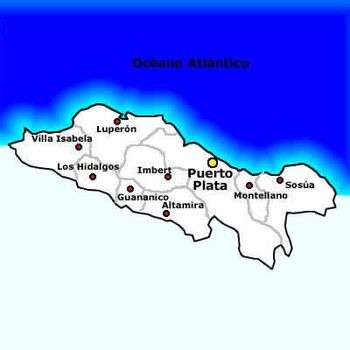
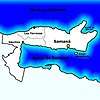
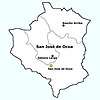
Provincial maps with their municipalities
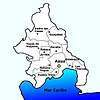
 Bahoruco Province
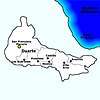


 La Romana Province
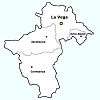


Statistics
For population figures as of the 2002 census for the urban centers and seats (cabeceras literally heads) of municipalities and municipal districts with more than 10,000 inhabitants see the list of cities in the Dominican Republic.
References
- Asamblea Nacional. "CONSTITUCION POLITICA DE LA REPUBLICA DOMINICANA DE 2002" (in Spanish). Retrieved 2007-02-24.
- Congreso Nacional. "Ley No. 3455, Organización Municipal, del 18 de diciembre del 1952" (PDF) (in Spanish). Archived from the original (PDF) on 2007-03-29. Retrieved 2007-03-02.
- Oficina Nacional de Estadistica, Departamento de Cartografia, Division de Limites y Linderos. "Listado de Codigos de Provincias, Municipio y Distritos Municipales, Actualizada a Junio 20 del 2006" (in Spanish). Archived from the original on 14 March 2007. Retrieved 4 November 2018.CS1 maint: multiple names: authors list (link)
- Consejo Nacional de Población y Familia. "Estamaciones y Proyecciones de la Población Dominicana por Regiones, Provincias, Municipios y Distritos Municipales, 2014" (in Spanish). Archived from the original (PDF) on 11/2/2018. Retrieved 2014-02-02. Check date values in:
|archivedate=(help)
External links
- (in Spanish) Federación Dominicana de Municipios - FEDOMU, Dominican federation of municipalities
- (in Spanish) Oficina Nacional de Estadística, Statistics Portal of the Dominican Republic
Administrative divisions of the Americas | ||
|---|---|---|
| ||
| Sovereign states |
| .svg.png) |
| ||
Dominican Republic articles | |||||
|---|---|---|---|---|---|
| History |
| | |||
| Geography |
| ||||
| Politics |
| ||||
| Economy | |||||
| Society |
| ||||
Dominican Republic articles | |||||
|---|---|---|---|---|---|
| History |
| | |||
| Geography |
| ||||
| Politics |
| ||||
| Economy | |||||
| Society |
| ||||