List of countries by tax revenue to GDP ratio
This article lists countries alphabetically, with total tax revenue as a percentage of gross domestic product (GDP) for the listed countries. The tax percentage for each country listed in the source has been added to the chart.
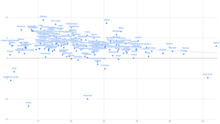
Relation between the tax revenue to GDP ratio and the real GDP growth rate (average rate in years 2013-2018, according to List of countries by real GDP growth rate, data mainly from the World Bank)
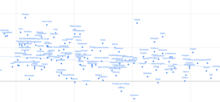
Relation between the tax revenue to GDP ratio and the real GDP growth rate (average rate in years 2013-2018, according to List of countries by real GDP growth rate, data mainly from the World Bank) - zoom
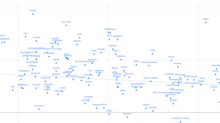
Relation between the tax revenue to GDP ratio and the real GDP growth rate (average rate in years 2013-2018, according to List of countries by real GDP growth rate, data mainly from the World Bank) - big zoom
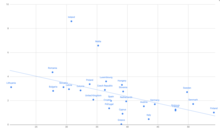
Relation between the tax revenue to GDP ratio and the real GDP growth rate (average rate in years 2013-2018, according to List of countries by real GDP growth rate, data mainly from the World Bank) - European Union

Tax as % of GDP
| Country | Tax as % of GDP (2015)[1] |
|---|---|
| 60.4 | |
| 30.26 | |
| 64.07 | |
| 10.33 | |
| 24.95 | |
| 24.1 | |
| 28.5 | |
| 42.7 | |
| 17.8 | |
| 18.7 | |
| 4.8 | |
| 8.5 | |
| 32.6 | |
| 24.2 | |
| 47.9[2] | |
| 21.6 | |
| 15.4 | |
| 10.7 | |
| 27.0 | |
| 41.2 | |
| 35.2 | |
| 34.4 | |
| 27.8[3] | |
| 11.5 | |
| 17.4 | |
| 8.0 | |
| 18.2 | |
| 31.7 [4] | |
| 23.0 | |
| 4.2 | |
| 26.3 [5][6] | |
| 20.1 | |
| 16.1 | |
| 12.0 | |
| 5.9 | |
| 21.0 | |
| 15.3 | |
| 36.7 | |
| 44.8 | |
| 39.2 | |
| 36.3 | |
| 50.8[8] | |
| 20.0 | |
| 30.3 | |
| 12.0 | |
| 13.2 | |
| 13.2 | |
| 15.8 | |
| 13.3 | |
| 1.7 | |
| 32.3 | |
| 11.6 | |
| European Union[9] | 35.7 |
| 21.8 | |
| 54.2 [4] | |
| 47.9[10] | |
| 10.3 | |
| 18.9 | |
| 21.7 | |
| 44.5 | |
| 20.8 | |
| 39.0[10] | |
| 11.9 | |
| 8.2 | |
| 11.5 | |
| 31.9 | |
| 9.4 | |
| 15.6 | |
| 13.0 | |
| 39.1 | |
| 40.4 | |
| 10.9[11] | |
| 12.0 | |
| 6.1 | |
| 30.8 | |
| 36.8 | |
| 43.5 | |
| 27.2 | |
| 35.9[4] | |
| 21.1 | |
| 26.8 | |
| 18.4 | |
| 20.7 | |
| 33.6 [4] | |
| 1.5 | |
| 21.4 | |
| 10.8 | |
| 30.4 | |
| 14.4 | |
| 42.9 | |
| 13.2 | |
| 2.7 | |
| 20.9 | |
| 36.5 | |
| 20.1 | |
| 10.7 | |
| 20.7 | |
| 15.5 | |
| 20.5 | |
| 15.3 | |
| 35.2 | |
| 15.4 | |
| 19.0 | |
| 23.7 [4] | |
| 12.3 | |
| 33.8 | |
| 33.8 | |
| 28.0 | |
| 22.3 | |
| 13.4 | |
| 4.9 | |
| 28.8 | |
| 23.1[12] | |
| 39.8 | |
| 34.5 | |
| 17.8 | |
| 11.0 | |
| 6.1 | |
| 29.3 | |
| 54.8[4] | |
| OECD[13] | 34.8 |
| 2.0 | |
| 11.0 | |
| 10.6 | |
| 24.5 | |
| 12.0 | |
| 18.0 | |
| 14.4 | |
| 33.8 | |
| 37.0 | |
| 2.2 | |
| 27.7[8] | |
| 19.5 | |
| 14.1 | |
| 23.1 | |
| 26.5 | |
| 25.5 | |
| 17.4 | |
| 5.3 | |
| 19.2 | |
| 34.1 | |
| 32.0 | |
| 10.5 | |
| 14.2 | |
| 29.5 | |
| 39.3 | |
| 24.7 | |
| 26.9 | |
| 37.3 | |
| 11.6 | |
| 6.3 | |
| 22.1 | |
| 39.8 | |
| 49.8 [4] | |
| 27.8 [14] | |
| 10.7 | |
| 13.0[15] | |
| 16.5 | |
| 12.0 | |
| 17.0 | |
| 61.5[16] | |
| 15.5 | |
| 27.0 | |
| 28.0 | |
| 14.9 | |
| 24.9[17] | |
| 20.2 | |
| 14.2 | |
| 28.1 | |
| 1.4 | |
| 34.4 | |
| 24.3 [18] | |
| 23.1 | |
| 21.0 | |
| 17.8 | |
| 25.0 | |
| 13.8 | |
| 7.1 | |
| 16.1 | |
| 24.3 |
See also
| Wikimedia Commons has media related to Tax by country. |
- Tax rates around the world
- Tax rates of Europe
- Taxation in the United States
- Income tax in the United States
- Government budget by country
- List of countries by social welfare spending
References
- Data based on Heritage Foundation (2015). "2015 Macro-economic Data". and Index of Economic Freedom, Heritage Foundation. Note: Tax revenue as a percentage of GDP was obtained from the individual country pages, under the "Fiscal Freedom" section. These numbers change. Please update the numbers for individual countries in the list. Figures may vary if additional of reference provided.
- "Europa -Total Tax Revenue by Country". Europa.
- "Europa - Tax Revenue by Country". Europa.
- "General government - General government revenue - OECD Data". theOECD. Retrieved 13 October 2018.
- Hernández Garrido, Ximena. "Cuenta Pública Participativa 2018" (PDF). Tesorería General de la República. Retrieved 15 December 2019.
Total tax revenue in 2018 of 50,24 billion
- "Cuentas Nacionales". Banco Central de Chile. Retrieved 15 December 2019.
PIB a precios corrientes de 191.249 billones en 2018
- "Archived copy". Archived from the original on 2019-06-24. Retrieved 2017-12-07.CS1 maint: archived copy as title (link)
- "Europa - Total Tax Revenue by Country". Europa.
- Directorate-General for Taxation and Customs Union and Eurostat (2013). Taxation trends in the European Union: Data for the EU Member States, Iceland and Norway (2013 ed.). Publications Office of the European Union. p. 172. doi:10.2778/30605. ISBN 978-92-79-28852-4. Archived from the original on 2013-11-24. (unweighted average)
- "Europa - Tax Revenue as a % of GDP". Europa.
- https://economictimes.indiatimes.com/budget-faqs/what-is-tax-to-gdp-ratio-where-does-india-fare-on-this-indicator/articleshow/73222499.cms
- "आर्थिक सर्वेक्षण २०७४/७५" (PDF). Ministry of Finance, Nepal. Retrieved 28 May 2018.
- Total tax revenue as percentage of GDP. Table, 1965 to 2009 (it does not have each year). OECD (Organisation for Economic Co-operation and Development). Publication date: December 15, 2010. To view the .xls table you can use the free Excel Viewer. Most of the data is for 2009 and is provisional. 2008 data is shown for Australia, Japan, Netherlands, Poland and Portugal. The table is from the 2010 edition of the OECD book, Revenue Statistics. See the bottom of the page for links to editions for various years. Taxation: Key Tables from OECD - OECD iLibrary. See "Total tax revenue" links (Web, PDF, XLS). This table covers the time period 2002 to 2009. OECD. Statistics from A to Z - Beta version. See "Total tax revenue" links. Click the "Get real-time data" link to get a detailed 1965 to 2009 table with data for each year.
- FFA, Federal Finance Administration. "index". Retrieved 13 October 2018.
- "105 年稅收徵起情形分析" (PDF). 財政部統計處. Retrieved 2017-03-15.
- "Economic Data and Statistics on World Economy and Economic Freedom". www.heritage.org. Retrieved 13 October 2018.
- http://www.tuik.gov.tr/PreHaberBultenleri.do?id=21512
- "OECD Revenue Statistics United States" (PDF).
Further reading
Some of these provide additional info for various countries.
- Tax revenues fall in OECD countries. Dec. 15, 2010. OECD (Organisation for Economic Co-operation and Development). At the end of the article are links to tables.
- Federal Tax Revenue as Share of GDP 1990-2009 for 148 Countries - excludes voluntary insurance programs. World Bank.
- 5506.0 - Taxation Revenue, Australia, 2008-09. Australian Bureau of Statistics.
- OECD Taxes as Share of GDP 1999-2005. Tax Policy Center (Urban Institute, Brookings Institution).
- Tax revenue as an automatic fiscal stabiliser - a South African perspective. September 2002. By A.S. Swanepoel (South African Reserve Bank), and Nicolaas J. Schoeman (Department of Economics, University of Pretoria). South African Journal of Economic and Management Sciences (SAJEMS). See table 2 on page 576. Total taxes of 26.4% of GDP in 2001. Research Repository of the University of Pretoria, South Africa:
- RGST to raise tax-to-GDP ratio to 12pc. By Nasir Jamal. Oct 6, 2010. Dawn (Pakistan's oldest, and most widely read English-language newspaper).
This article is issued from Wikipedia. The text is licensed under Creative Commons - Attribution - Sharealike. Additional terms may apply for the media files.