Effect of taxes and subsidies on price
Taxes and subsidies change the price of goods and, as a result, the quantity consumed. There is a difference between an Ad valorem tax and a specific tax or subsidy in the way how it is applied on the price of the good. The final effect stays similar though. In the end levying a tax moves the market to a new equilibrium where the price of a good paid by buyers increases and the price received by sellers decreases. The incidence of a tax does not depend on whether the buyers or sellers are taxed. Most of the burden of a tax falls on the less elastic side of the market because of the lower ability to respond to the tax by changing the quantity sold or bought. Introduction of a subsidy, on the other hand, lowers the price of production which encourages firms to produce more. Such a policy is beneficial both to sellers and buyers, who can buy the good for lower price.
Specific tax impact[1]
The effect of a specific tax can be divided into three steps.
First, in the case of a specific tax, the immediate impact of the tax hits the sellers. The demand for a good is the same for a given price level so the demand curve does not change. On the other hand, the tax makes the good in fact more expensive to produce for the seller. This means that the business is less profitable for a given price level and the supply curve shifts upwards.
Second, the higher cost of producing the good reduces the quantity supplied at any given price. The upward shifted supply curve is parallel to the original supply curve because no matter the quantity supplied, the seller’s expenses on the production are the same. Therefore the distance between the original and the new shifted supply curve is equal to the amount of tax imposed. Whatever the price of the good, the price for which the sellers are selling is effectively lower by the amount of the tax. This makes the sellers supply the amount of the good as if the price were lower by the amount of the tax. In order for them to supply a given quantity of the good, the market price needs to be higher by the amount of tax so that it will compensate for it.
Last, after the shift of the supply curve is taken into account, the difference between the initial and after-tax equlibrium can be observed. The growth of market price is determined by the price elasticities of demand and supply. In the case of demand being more elastic than supply, the incidence of the tax falls more heavily on sellers and the consumers feel a smaller growth of price and vice versa. In both cases, the consumers pay more for the good and while the sellers initially receive more money, after the tax is accounted for, they are left with less money than if there were no tax imposed.
The tax both raises the price the customers buy the good for and lowers the price the producers are effectively selling the good for. The difference between the two prices remains the same no matter who bears most of the burden of the tax. But imposing a tax always impacts both the buyer and the seller.
Example
The original equilibrium price is $3.00 and the equilibrium quantity is 100. The government then levies a tax of $0.50 on the sellers. This leads to a new supply curve which is shifted upward by $0.50 compared to the original supply curve. The new equilibrium price will sit between $3.00 and $3.50 and the equilibrium quantity will decrease. If we say that the consumers pay $3.30 and the new equilibrium quantity is 80, then the producers keep $2.80 and the total tax revenue equals $0.50 x 80 = $4.00. The burden of the tax paid by buyers is $0.30 x 80 = $2.40 and the burden paid by sellers equals $0.20 x 80 = $1.60.
Ad valorem tax impact[1]
Similarly the effect can be broken down into three steps.
First, the tax again affects the sellers. The quantity demanded at a given price remains unchanged and therefore the demand curve stays the same. The seller has to again deal with more expensive production but the effect is different for each price level. Since the tax is a certain percentage of the price, with increasing price, the tax grows as well. The supply curve shifts upward but the new supply curve is not parallel to the original one.
Second, the tax raises the production cost similarly as the specific tax but the amount of tax varies with price level. The upward shift of the supply curve is accompanied by a pivot upwards and to the left of the original supply curve. The vertical distance between the two supply curves is equal to the amount of tax in per cent. The effective price to the sellers is again lower by the amount of the tax and they will supply the good as if the price were lower by the amount of tax.
Last, the total impact of the tax can be observed. The equilibrium price of the good rises and the equilibrium quantity decreases. The buyers and sellers again share the burden of the tax relative to their price elasticities. The buyers have to pay more for the good and the sellers receive less money than before the tax has been imposed.
Example
The pre-tax equilibrium price is $5.00 with respective equilibrium quantity of 100. The government imposes a 20 per cent tax on the sellers. A new supply curve emerges. It is shifted upward and pivoted to the left and upwards in comparison to the original supply curve and their distance is always 20 per cent of the original price. In the pre-tax equilibrium the distance equals $5.00 x 0.20 = $1.00. This burden of the tax is again shared by the buyer and seller. If the new equilibrium quantity decreases to 85 and the buyer bears a higher proportion of the tax burden (e.g. $0.75), the total amount of tax collected equals $1.00 x 85 = $85.00. The buyer then faces the tax of $0.75 x 85 = $63.75 and the tax paid by the seller equals $0.25 x 85 = $21.25. The price the consumer buys the good for equals $5.75 but the seller only receives $4.75.
Subsidy impact
Marginal subsidies on production will shift the supply curve to the right until the vertical distance between the two supply curves is equal to the per unit subsidy; when other things remain equal, this will decrease price paid by the consumers (which is equal to the new market price) and increase the price received by the producers. Similarly, a marginal subsidy on consumption will shift the demand curve to the right; when other things remain equal, this will decrease the price paid by consumers and increase the price received by producers by the same amount as if the subsidy had been granted to producers. However, in this case, the new market price will be the price received by producers. The end result is that the lower price that consumers pay and the higher price that producers receive will be the same, regardless of how the subsidy is administered.[2]
Effect of elasticity
Depending on the price elasticities of demand and supply, who bears more of the tax or who receives more of the subsidy may differ. Where the supply curve is less elastic than the demand curve, producers bear more of the tax and receive more of the subsidy than consumers as the difference between the price producers receive and the initial market price is greater than the difference borne by consumers. Where the demand curve is more inelastic than the supply curve, the consumers bear more of the tax and receive more of the subsidy as the difference between the price consumers pay and the initial market price is greater than the difference borne by producers.
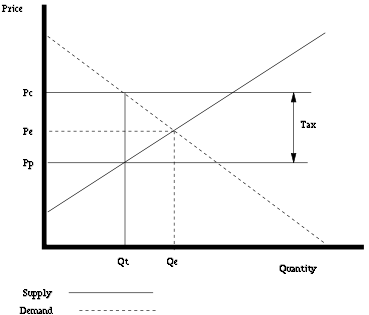
An illustration
The effect of this type of tax can be illustrated on a standard supply and demand diagram. Without a tax, the equilibrium price will be at Pe and the equilibrium quantity will be at Qe.
After a tax is imposed, the price consumers pay will shift to Pc and the price producers receive will shift to Pp. The consumers' price will be equal to the producers' price plus the cost of the tax. Since consumers will buy less at the higher consumer price (Pc) and producers will sell less at a lower producer price (Pp), the quantity sold will fall from Qe to Qt.
See also
References
- Mankiw, Gregory N.; Taylor, Mark P. (2014). Economics. Andover: Cengage Learning. ISBN 978-1-4080-9379-5.
- Watkins, Thayer. The Impact of an Excise Tax or Subsidy on Price, San Jose State University http://www.sjsu.edu/faculty/watkins/taximpact.htm Retrieved July 25, 2011