List of countries by alcohol consumption per capita

This is a list of countries by alcohol consumption measured in equivalent litres of pure alcohol (ethanol) consumed per capita per year.

World Health Organization (WHO) data

The World Health Organization periodically publishes The Global Status Report on Alcohol:

  • 1999 was first published by WHO in 1999.[1]
  • 2004 is the second global status report on alcohol published by WHO.
  • 2011 is the third global report on alcohol published by WHO.
  • 2014 is the fourth global report on alcohol published by WHO with data from 2010.

2010 WHO data

Map of countries by prevalence of alcohol consumption (2008)

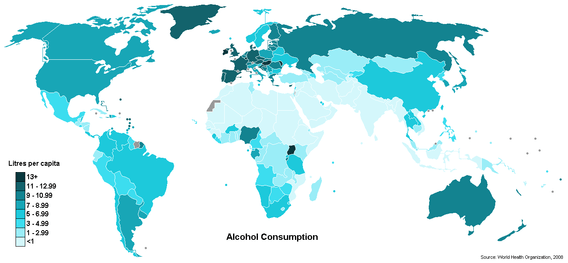
The table below for 191 countries uses 2010 data from the WHO report published in 2014. The methodology used by the WHO calculated use by persons 15 years of age or older. All data in columns refer to year 2010. The column "recorded" refers to the average recorded consumption for the period 2010. Unrecorded consumption (homebrew, moonshine, smuggled alcohol, surrogate alcohol etc.) was calculated using empirical investigations and expert judgments. Total is the sum of the recorded and unrecorded consumption. The next four columns are a breakdown of the recorded alcohol consumption by type. Beer refers to malt beer, wine refers to grape wine, spirits refers to all distilled beverages such as vodka and similar products, and the column "other" refers to all other alcoholic beverages, such as rice wine, sake, mead, cider, kvass, and African beers (kumi kumi, kwete, banana beer, millet beer, umqombothi etc.). Worldwide consumption in 2010 was equal to 6.2 litres of pure alcohol consumed per person aged 15 years or older.

Pure alcohol consumption among persons (age 15+) in litres per capita per year, 2010[2]


1
2
3
4
5
6
7
8
9
10
11
12
13
14
15
16
17
18
19
20
21
22
23
24
25
26
27
28
29
30
31
32
33
34
35
36
37
38
39
40
41
42
43
44
45
46
47
48
49
50
51
52
53
54
55
56
57
58
59
60
61
62
63
64
65
66
67
68
69
70
71
72
73
74
75
76
77
78
79
80
81
82
83
84
85
86
87
88
89
90
91
92
93
94
95
96
97
98
99
100
101
102
103
104
105
106
107
108
109
110
111
112
113
114
115
116
117
118
119
120
121
122
123
124
125
126
127
128
129
130
131
132
133
134
135
136
137
138
139
140
141
142
143
144
145
146
147
148
149
150
151
152
153
154
155
156
157
158
159
160
161
162
163
164
165
166
167
168
169
170
171
172
173
174
175
176
177
178
179
180
181
182
183
184
185
186
187
188
189
190
191
CountryTotalRecorded
consumption
Unrecorded
consumption
Beer
(%)
Wine
(%)
Spirits
(%)
Other
(%)
2015
projection
 Belarus17.614.43.217.35.246.630.917.1
 Moldova16.86.310.530.45.164.50.017.4
 Lithuania15.512.92.546.57.834.111.616.2
 Russia15.111.53.637.611.451.00.014.5
 Romania14.410.44.050.028.921.10.012.9
 Ukraine13.98.95.040.59.048.02.611.8
 Andorra13.812.41.434.645.320.10.09.1
 Hungary13.311.32.036.329.434.30.012.4
 Czech Republic13.011.81.253.520.526.00.014.1
 Slovakia13.011.41.730.118.346.25.512.5
 Portugal12.911.01.930.855.510.92.812.5
 Serbia12.69.62.951.523.924.60.012.9
 Grenada12.511.90.729.34.366.20.210.4
 Poland12.510.91.655.19.335.50.011.5
 Latvia12.310.51.846.910.737.05.410.6
 Finland12.310.02.346.017.524.012.611.9
 South Korea12.39.82.525.01.62.970.510.9
 France12.211.80.418.856.423.11.711.6
 Australia12.210.41.844.036.712.56.812.6
 Croatia12.210.22.039.544.815.40.211.7
 Ireland11.911.40.548.126.118.77.710.9
 Luxembourg11.911.40.536.242.821.00.011.2
 Germany11.811.30.553.627.818.60.010.6
 Slovenia11.610.61.044.546.98.60.010.9
 United Kingdom11.610.41.236.933.821.87.512.0
 Denmark11.410.41.037.748.214.10.010.2
 Bulgaria11.410.31.139.316.544.10.111.3
 Spain11.210.01.249.720.128.21.810.6
 Belgium11.010.50.549.236.314.40.110.8
 South Africa11.08.22.948.117.816.717.411.5
 New Zealand10.99.31.638.233.915.212.511.2
 Gabon10.98.92.068.311.919.80.111.8
 Namibia10.86.84.096.70.30.92.111.8
  Switzerland10.710.20.531.849.417.61.210.4
 Saint Lucia10.410.10.229.712.656.11.510.4
 Austria10.39.70.650.435.514.00.08.5
 Estonia10.39.50.841.211.136.810.99.4
 Greece10.38.32.028.147.324.20.49.3
 Kazakhstan10.36.83.531.83.165.10.08.2
 Canada10.28.22.051.222.026.80.010.3
 Nigeria10.19.11.08.00.40.990.711.3
 Netherlands9.99.40.546.836.416.90.09.6
 Uganda9.88.31.59.40.11.988.610.5
 Rwanda9.86.83.011.10.00.488.410.0
 Chile9.67.62.029.940.729.40.09.3
 Sierra Leone9.38.31.040.748.05.55.87.6
 Burundi9.36.33.024.50.00.175.49.8
 United States9.28.70.550.017.332.70.09.0
 Cyprus9.28.21.040.924.733.70.79.1
 Sweden9.27.22.037.046.615.11.48.7
 Venezuela8.97.71.375.60.823.40.28.3
 Paraguay8.87.31.551.118.228.82.09.6
 Brazil8.77.21.559.64.036.30.19.1
 Argentina8.76.72.06.40.50.792.38.2
 Montenegro8.74.93.910.947.041.70.413.3
 Belize8.56.81.767.62.030.30.18.3
 Cameroon8.45.82.663.922.113.80.27.7
 Botswana8.45.43.056.011.811.520.77.7
 Saint Kitts and Nevis8.27.70.544.07.448.00.67.0
 Guyana8.17.11.023.00.376.60.18.6
 Peru8.16.12.046.86.147.10.05.2
 Panama8.07.20.869.24.626.00.27.7
 Niue8.07.01.047.01.751.30.07.7
 Palau7.96.91.077.75.916.40.0
 Norway7.76.71.044.234.719.02.17.0
 Tanzania7.75.72.011.00.21.887.08.1
 Georgia7.75.42.317.049.833.20.16.7
 Uruguay7.66.61.030.659.99.50.07.0
 Angola7.55.91.664.313.717.44.77.6
 Laos7.36.21.135.60.064.40.07.5
 Japan7.27.00.219.24.152.024.77.5
 Mexico7.25.51.875.71.522.20.56.8
 Ecuador7.24.23.067.31.231.50.06.1
 Dominica7.16.60.513.77.177.91.26.6
 Iceland7.16.60.561.821.216.50.56.9
 Thailand7.16.40.727.00.472.60.08.3
 Bosnia and Herzegovina7.14.62.573.39.717.00.07.5
 São Tomé and Príncipe7.14.22.923.560.216.30.06.8
 Malta7.06.60.439.432.727.20.77.2
 Albania7.04.92.131.819.848.40.06.6
 Bahamas6.96.30.534.014.650.41.04.2
 Dominican Republic6.96.20.754.52.742.70.17.6
 Mongolia6.94.92.027.62.869.60.07.8
 Cape Verde6.94.02.944.41.20.254.27.2
 Barbados6.86.30.539.710.249.30.86.5
 Burkina Faso6.84.32.510.03.03.183.87.4
 Italy6.76.50.223.065.611.50.06.1
 Trinidad and Tobago6.76.40.354.02.043.80.36.6
 China6.75.01.727.83.069.20.07.6
 Lebanon6.73.92.847.439.912.60.05.7
 Saint Vincent and the Grenadines6.66.30.333.43.063.10.57.2
 Equatorial Guinea6.65.80.827.872.20.00.08.1
 Suriname6.65.61.040.02.357.20.56.5
 Vietnam6.62.04.697.30.62.10.08.7
 Lesotho6.52.83.751.30.218.929.66.4
 Haiti6.45.90.60.20.299.60.05.9
 Cook Islands6.45.90.50.022.677.40.04.8
 Colombia6.24.22.066.11.132.50.36.6
 Ivory Coast6.04.02.016.13.00.480.56.5
 Bolivia5.93.82.176.83.819.30.15.8
 Eswatini5.74.71.033.60.80.765.06.4
 Zimbabwe5.74.71.023.71.76.867.74.8
 Seychelles5.64.11.567.022.210.80.06.7
 Cambodia5.52.23.345.70.853.50.06.1
 Puerto Rico5.44.90.566.66.726.40.3-
 Netherlands Antilles5.44.90.436.416.447.00.33.2
 Philippines5.44.60.926.90.372.70.05.6
 Costa Rica5.44.41.059.34.735.50.55.1
 Armenia5.33.81.59.75.384.90.05.5
 Cuba5.24.21.038.82.258.90.05.5
 Nicaragua5.03.51.538.80.560.60.04.6
 Jamaica4.93.41.542.04.951.41.65.1
 Ghana4.81.83.030.09.72.957.35.4
 Liberia4.73.11.610.81.088.10.05.2
 Uzbekistan4.62.42.118.36.375.40.04.8
 Chad4.40.44.066.33.43.826.54.4
 United Arab Emirates4.32.81.510.32.986.70.04.3
 Kyrgyzstan4.32.41.922.64.272.90.33.9
 India4.32.22.26.80.193.10.04.6
 Turkmenistan4.32.22.215.426.158.40.05.0
 Kenya4.31.82.556.11.821.620.44.0
 Ethiopia4.20.73.549.70.68.241.44.3
 Honduras4.03.01.040.11.158.70.04.0
 Guinea-Bissau4.02.51.519.614.922.443.04.3
 Zambia4.02.51.522.72.913.660.74.0
 Congo3.91.72.278.49.810.90.83.9
 Guatemala3.82.21.641.91.656.30.23.9
 Central African Republic3.81.82.016.20.62.181.13.8
 North Korea3.73.20.55.10.094.90.04.4
 Sri Lanka3.72.21.513.00.185.21.74.5
 Mauritius3.62.61.066.212.321.30.24.0
 Samoa3.62.61.070.916.612.50.0
 DR Congo3.62.31.324.00.72.073.33.4
 Nauru3.51.02.585.414.60.00.03.0
 Gambia3.42.41.05.60.70.393.53.2
 F.S. Micronesia3.32.31.047.014.138.90.03.5
 El Salvador3.22.21.041.71.756.60.03.5
 Fiji3.02.01.067.70.931.10.23.2
 Papua New Guinea3.01.51.551.30.947.70.03.1
 Kiribati3.01.02.036.92.260.90.02.9
 Tajikistan2.80.32.510.21.188.70.02.4
 Israel2.80.32.544.06.249.50.33.1
 Sudan2.71.71.08.00.013.578.52.7
 Malawi2.51.51.09.11.213.476.22.5
 North Macedonia2.41.90.518.229.152.40.32.2
 Azerbaijan2.31.31.028.77.663.30.02.1
 Mozambique2.31.31.063.07.325.44.32.0
 Togo2.31.31.048.926.92.421.81.9
   Nepal2.20.22.047.70.951.40.02.1
 Bahrain2.12.00.136.66.357.00.12.4
 Benin2.11.11.054.621.77.216.52.2
 Singapore2.01.50.570.113.514.71.72.9
 Turkey2.01.40.663.68.627.90.02.4
 Madagascar1.80.81.056.09.534.50.01.9
 Solomon Islands1.71.20.581.12.116.70.01.6
 Tonga1.61.10.557.97.634.30.12.1
 Tunisia1.51.30.268.627.73.70.01.2
 Tuvalu1.51.00.510.015.574.50.01.3
 Qatar1.50.90.61.213.984.60.31.3
 Vanuatu1.40.90.540.522.836.70.01.2
 Djibouti1.31.10.223.25.371.50.00.9
 Malaysia1.30.31.076.22.021.80.11.7
 Syria1.21.00.38.527.963.50.01.4
 Maldives1.20.70.529.129.441.20.01.0
 Mali1.10.60.513.31.52.183.11.0
 Eritrea1.10.50.663.60.00.136.31.4
 Algeria1.00.70.362.635.50.02.00.6
 Iran1.00.01.024.852.11.01.0
 Oman0.90.70.254.63.342.20.00.9
 Brunei0.90.60.389.82.37.20.70.8
 Morocco0.90.50.543.536.519.90.00.7
 Jordan0.70.50.222.42.175.40.10.7
 Bhutan0.70.40.3100.00.00.00.01.1
 Guinea0.70.20.578.916.33.71.10.7
 Myanmar0.70.10.682.65.711.80.00.7
 Afghanistan0.70.00.718.938.31.01.2
 Senegal0.60.30.355.141.33.60.00.5
 Indonesia0.60.10.584.50.115.30.00.6
 East Timor0.60.10.59.375.914.80.01.2
 Iraq0.50.20.376.11.022.90.00.5
 Somalia0.50.00.59.219.20.50.5
 Egypt0.40.20.253.85.440.30.50.3
 Niger0.30.10.246.013.240.70.00.3
 Yemen0.30.10.2100.00.00.00.00.2
 Comoros0.20.10.123.322.254.60.00.2
 Saudi Arabia0.20.10.10.01.997.90.20.2
 Bangladesh0.20.00.29.017.60.20.2
 Kuwait0.10.00.158.110.830.70.40.1
 Libya0.10.00.12.55.00.00.0
 Mauritania0.10.00.10.1
 Pakistan0.10.00.01.23.00.10.1

2016 WHO data for OECD (Organisation for Economic Co-operation and Development) countries

The following is a list of OECD countries by the 2016 total alcohol consumption per capita age 15+ in litres of pure alcohol as published by the World Health Organization.[3]

2016 total alcohol consumption per capita (age 15+) for OECD nations


1
2
3
4
5
6
7
8
9
10
11
12
13
14
15
16
17
18
19
20
21
22
23
24
25
26
27
28
29
30
31
32
33
CountryAlcohol
consumption
(Litres/year)
Relative alcohol consumption
 Czech Republic14.1 14.1
 
 Australia12.6 12.6
 
 Portugal12.5 12.5
 
 Slovakia12.5 12.5
 
 Hungary12.4 12.4
 
 United Kingdom12.0 12
 
 Finland11.9 11.9
 
 France11.6 11.6
 
 Poland11.5 11.5
 
 Luxembourg11.2 11.2
 
 New Zealand11.2 11.2
 
 Ireland10.9 10.9
 
 Slovenia10.9 10.9
 
 South Korea10.9 10.9
 
 Belgium10.8 10.8
 
 Germany10.6 10.6
 
 Spain10.6 10.6
 
  Switzerland10.4 10.4
 
 Canada10.3 10.3
 
 Denmark10.2 10.2
 
 Netherlands9.6 9.6
 
 Chile9.3 9.3
 
 Greece9.3 9.3
 
 United States9.0 9
 
 Sweden8.7 8.7
 
 Austria8.5 8.5
 
 Japan7.5 7.5
 
 Norway7.0 7
 
 Iceland6.9 6.9
 
 Mexico6.8 6.8
 
 Italy6.1 6.1
 
 Israel3.1 3.1
 
 Turkey2.4 2.4
 

OECD Data

2013 OECD statistics

The table below lists OECD countries by the annual consumption of pure alcohol in litres, per person, aged 15 years old and over, as published in the 2013 OECD Health Data. Note that the methodology to convert alcoholic drinks to pure alcohol may differ across countries. Typically beer is weighted as 4–5%, wine as 11–16% and spirits as 40% of pure alcohol equivalent.

This table is an accurate reflection of the annual consumption of pure alcohol in litres by OECD countries.


1
2
3
4
5
6
7
8
9
10
11
12
13
14
15
16
17
18
19
20
21
22
23
24
25
26
27
28
29
30
31
32
33
34
CountryLitres per
capita[4]
Relative sizeYear
 Austria12.2 12.2
 
2011
 Estonia12.0 12
 
2011
 France11.8 11.8
 
2011
 Ireland11.7 11.7
 
2011
 Czech Republic11.5 11.5
 
2011
 South Africa11.4 11.4
 
2011
 Luxembourg11.4 11.4
 
2011
 Germany11.2 11.2
 
2011
 Slovenia10.6 10.6
 
2011
 Denmark10.5 10.5
 
2011
 Poland10.3 10.3
 
2011
 Portugal10.3 10.3
 
2011
 United Kingdom10.3 10.3
 
2011
 Slovakia10.2 10.2
 
2011
 Australia10.0 10
 
2011
  Switzerland10.0 10
 
2011
 Belgium9.8 9.8
 
2011
 Finland9.8 9.8
 
2011
 Spain9.8 9.8
 
2010
 New Zealand9.5 9.5
 
2011
 Netherlands9.2 9.2
 
2011
 South Korea8.9 8.9
 
2011
 United States8.6 8.6
 
2011
 Canada8.0 8
 
2011
 Chile7.9 7.9
 
2010
 Greece7.4 7.4
 
2011
 Japan7.3 7.3
 
2011
 Sweden7.3 7.3
 
2011
 Norway6.4 6.4
 
2011
 Iceland6.3 6.3
 
2010
 Italy6.1 6.1
 
2010
 Mexico5.1 5.1
 
2011
 Israel2.6 2.6
 
2011
 Turkey1.5 1.5
 
2011

See also

References

This article is issued from Wikipedia. The text is licensed under Creative Commons - Attribution - Sharealike. Additional terms may apply for the media files.