La Roque-Sainte-Marguerite
La Roque Ste Marguerite is a commune in the Aveyron department in southern France.
La Roque-Sainte-Marguerite | |
|---|---|
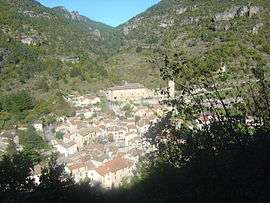 A general view of La Roque-Sainte-Marguerite | |
Location of La Roque-Sainte-Marguerite 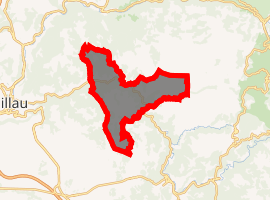
| |
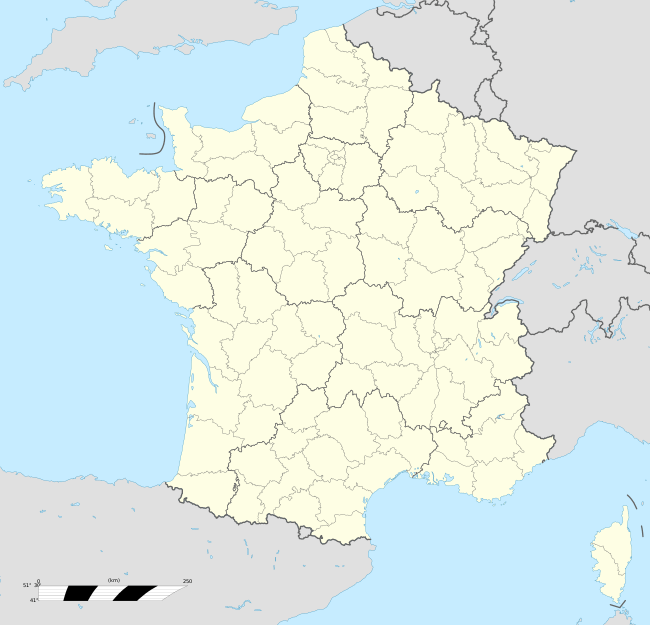 La Roque-Sainte-Marguerite 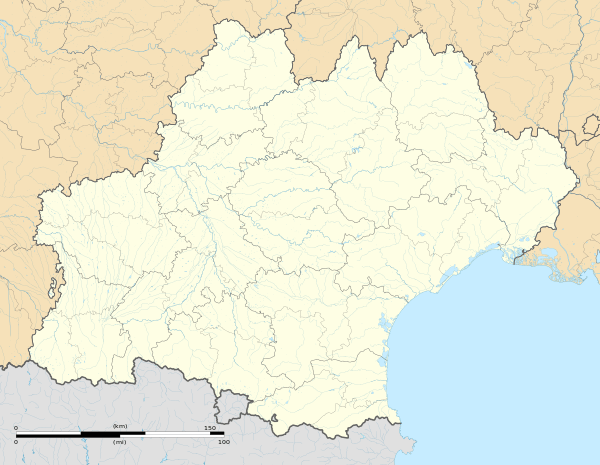 La Roque-Sainte-Marguerite | |
| Coordinates: 44°07′33″N 3°13′25″E | |
| Country | France |
| Region | Occitanie |
| Department | Aveyron |
| Arrondissement | Millau |
| Canton | Tarn et Causses |
| Intercommunality | Millau Grands Causses |
| Government | |
| • Mayor (2008–2014) | Paul Dumousseau |
| Area 1 | 49.4 km2 (19.1 sq mi) |
| Population (2017-01-01)[1] | 182 |
| • Density | 3.7/km2 (9.5/sq mi) |
| Time zone | UTC+01:00 (CET) |
| • Summer (DST) | UTC+02:00 (CEST) |
| INSEE/Postal code | 12204 /12100 |
| Elevation | 385–909 m (1,263–2,982 ft) (avg. 404 m or 1,325 ft) |
| 1 French Land Register data, which excludes lakes, ponds, glaciers > 1 km2 (0.386 sq mi or 247 acres) and river estuaries. | |
Lying deep in the scenic Dourbie gorge, the commune absorbed the formerly separate commune of St Verin in 1940, and it also incorporates the village of Pierrefiche du Larzac, which lies much higher on the Causse du Larzac (Larzac Plateau), at about 670 metres above sea level.
The village lies about 15 km (9.3 mi) east of Millau. The main industry for the residents who still work locally is tourism: the most visited site in Aveyron for tourists, Le Chaos de Montpellier-le-Vieux, is within its bounds. But most working residents commute into Millau.
On the Causse du Larzac, the villagers of Pierrefiche were shepherds, bringing their ewes' milk to the village dairy to make cheese for the world-famous Roquefort. Until recently there were two flocks of 50 & 200 ewes. The droughts of 2004 have reduced this to one. The sheepskin & fleeces went to Millau for the world-leading glove industry.
The castle was the western defence of the formerly heavily guarded Dourbie valley, which was a rich agricultural area in the Middle Ages. Old vine terraces can still be seen lining the deep chasm cut by the river through the Causse plateaux, some 300 m deep.
Population
| Historical population | ||
|---|---|---|
| Year | Pop. | ±% |
| 1962 | 73 | — |
| 1968 | 142 | +94.5% |
| 1975 | 158 | +11.3% |
| 1982 | 145 | −8.2% |
| 1990 | 144 | −0.7% |
| 1999 | 172 | +19.4% |
| 2008 | 198 | +15.1% |
See also
References
- "Populations légales 2017". INSEE. Retrieved 6 January 2020.
| Wikimedia Commons has media related to La Roque-Sainte-Marguerite. |
| Authority control |
|
|---|