European Americans
European Americans (also referred to as Euro-Americans) are Americans of European ancestry.[2][3] This term includes people who are descended from the first European settlers in America as well as people who are descended from more recent European arrivals. European Americans are the largest panethnic group (or, variously considered an ethnic group in its own right) in the United States, both historically and at present.
| Total population | |
|---|---|
| 193,515,388[1] 59.1% of the total U.S. population (2018) | |
| Regions with significant populations | |
| Contiguous United States and Alaska smaller populations in Hawaii and the territories | |
| Languages | |
| Predominantly English French • Russian • German • Italian • Spanish • Portuguese • Polish • Yiddish • Greek • Serbo-Croatian • others | |
| Religion | |
| Predominantly Christianity (Mainly Protestantism and Roman Catholicism); Minority religions: Judaism, Islam | |
| Related ethnic groups | |
| Non-Hispanic Whites, White Southerners, European diaspora, Europeans, European Canadians, European Australians, European New Zealanders, White South Africans, British (English, Scottish, Welsh, Ulster-Scots), German, Irish, Italian, Greek, Russian, Polish, Croatian, Albanian, Bosnian |

The Spaniards are thought to be the first Europeans to establish a continuous presence in what is now the contiguous United States, with Martín de Argüelles (b. 1566) in St. Augustine, then a part of Spanish Florida.[4][5] Virginia Dare, born August 18, 1587, was the first English child to be born in the Americas. She was born in Roanoke Colony, located in present-day North Carolina, which was the first attempt, made by Queen Elizabeth I, to establish a permanent English settlement in North America.
In the 2016 American Community Survey, German Americans (13.9%), Irish Americans (10.0%), English Americans (7.4%), Italian Americans (5.2%), and Polish Americans (3%) were the five largest self-reported European ancestry groups in the United States forming over a third of the total population.[6] However, the English Americans and British Americans demography is considered by some to be under-counted, as the people in that demographic tend to identify themselves simply as Americans (20,151,829 or 7.2%).[7][8][9][10] In the 2000 census over 56 million or 19.9% of the United States population ignored the ancestry question completely and are classified as "unspecified" and "not reported".[11]
Terminology
| Number of European Americans: 1800–2010 | ||||
|---|---|---|---|---|
| Year | Population | % of the United States | Ref(s) | |
| 1800 | 4,306,446 | 81.1% | [12] | |
| 1850 | 19,553,068 | 84.3% | [12] | |
| 1900 | 66,809,196 | 87.9% | [12] | |
| 1950 | 134,942,028 | 89.5% | [12] | |
| 2010 | 223,553,265 | 72.4% | [13] | |
Use
In 1995, as part of a review of the Office of Management and Budget's Statistical Policy Directive No. 15 (Race and Ethnic Standards for Federal Statistics and Administrative Reporting), a survey was conducted of census recipients to determine their preferred terminology for the racial/ethnic groups defined in the Directive. For the White group, European American came third, preferred by 2.35% of panel interviewees.[14]
The term is sometimes used interchangeably with Caucasian American, White American, and Anglo American in many places around the United States.[15] However, the terms Caucasian and White are purely racial terms, not geographic, and include some populations whose origin is outside of Europe; and Anglo-American also has another definition, meaning, European Americans with English ancestry.
Origin
The term is used by some to emphasize the European cultural and geographical ancestral origins of Americans, in the same way as is done for African Americans and Asian Americans. A European American awareness is still notable because 90% of the respondents classified as white in the U.S. Census knew their European ancestry.[16] Historically, the concept of an American originated in the United States as a person of European ancestry, thus excluding non-European groups.[17]
As a linguistic concern, the term is sometimes meant to discourage a dichotomous view of the racial landscape between the white category and everyone else.[18] Margo Adair suggests that the recognition of specific European American ancestries allows certain Americans to become aware that they come from a variety of different cultures.[19]
Subgroups
There are a number of subgroupings of European Americans.[20] While these categories may be approximately defined, often due to the imprecise or cultural regionalization of Europe, the subgroups are nevertheless used widely in cultural or ethnic identification.[21] This is particularly the case in diasporic populations, as with European people in the United States generally.[22] In alphabetical order, some of the subgroups are:
- Eastern European Americans, including Belarusian Americans, Moldovan Americans, Russian Americans and Ukrainian Americans
- Northwestern European Americans, including Austrian Americans, British Americans, Belgian Americans, Dutch Americans, French Americans, German Americans, Irish Americans, Scandinavian Americans and Swiss Americans
- Southern European Americans, including Greek Americans, Italian Americans, Portuguese Americans and Spanish Americans
History
| Historical immigration / est. origins | ||
|---|---|---|
| Country | Immigration before 1790 |
Population ancestry: 1790[23] |
| England* | 230,000 | 1,900,000 |
| Ulster Scotch-Irish* | 135,000 | 320,000 |
| Germany[lower-alpha 1] | 103,000 | 280,000 |
| Scotland* | 48,500 | 160,000 |
| Ireland | 8,000 | 200,000 |
| Netherlands | 6,000 | 100,000 |
| Wales* | 4,000 | 120,000 |
| France | 3,000 | 80,000 |
| Sweden and Other[lower-alpha 2] | 500 | 20,000 |
| *Totals, British | 417,500 | 2,500,000+ |
| 950,000 | 3,929,214 | |
| Source:[24](excludes African population.) | ||
Since 1607, some 57 million immigrants have come to the United States from other lands. Approximately 10 million passed through on their way to some other place or returned to their original homelands, leaving a net gain of some 47 million people.[25]
Colonial settlers
Between 1607 and 1776 most European settlements were British or Dutch. Colonial stock of English, Scottish, Scotch-Irish, Cornish or Welsh descent, may be found throughout the country but is especially dominant in New England and the South. Some people of colonial stock, especially in the Mid-Atlantic states, are also of Swedish, Hugenot or German descent. The vast majority of these are Protestants. The Pennsylvania Dutch (German American) population gave the state of Pennsylvania a high German cultural character. French descent, which can also be found throughout the country, is most concentrated in Louisiana, while Spanish descent is dominant in the Southwest and Florida. These are primarily Roman Catholic and were assimilated with the Louisiana Purchase and the aftermath of the Mexican–American War and Adams–Onís Treaty, respectively. Some Russians remained in Alaska for missionary.
1820–1890
The first large wave of European migration after the Revolutionary War came from Northern and Central-Western Europe between about 1820 and 1890. Most of these immigrants were from Ireland, Germany, Sweden, Denmark, and Britain, and with large numbers of Irish and German Catholics immigrating, Roman Catholicism became an important minority religion. Polish Americans usually used to come as German or Austrian citizens, since Poland lost its independence in the period between 1772 and 1795. Descendants of the first wave are dominant in the Midwest and West, although German descent is extremely common in Pennsylvania, and Irish descent is also common in urban centers in the Northeast. The Irish and Germans held onto their ethnic identity throughout the 19th and early half of the 20th centuries, as well as other European ethnic groups. Most people of Polish origin live in the Northeast and the Midwest (see also White ethnic).
Second wave 1890–1920
The second wave of European Americans arrived from the mid-1890s to the 1920s, mainly from Southern, Central and Eastern Europe, as well as Ireland.[16] This wave included Irish, Italians, Greeks, Hungarians, Portuguese, Spaniards, Romanians, Ukrainians, Russians, Poles and other Slavs. With large numbers of immigrants from Mexico, Spanish Caribbean, and South and Central America, White Hispanics have increased to 8% of the US population, and Texas, California, New York, and Florida are important centers for them.
Shifts in European migration
Before 1881, the vast majority of immigrants, almost 86% of the total, arrived from northwest Europe, principally Great Britain, Ireland, Germany, and Scandinavia. The years between 1881 and 1893 the pattern shifted, in the sources of U.S. "New immigration". Between 1894 and 1914, immigrants from southern, central, and eastern Europe accounted for 69% of the total.[26][27][28] Prior to 1960, the overwhelming majority came from Europe or of European descent from Canada. The shift in European immigration has been in decline since the mid-20th century, with 75.0% of the total foreign-born population born in Europe compared to 12.1% recorded in the 2010 census.[29]
Immigration since 1820
| European immigration to the US 1820–1970 | |||||
|---|---|---|---|---|---|
| Years | Arrivals | Years | Arrivals | Years | Arrivals |
| 1820–1830 | 98,816 | 1901–1910 | 8,136,016 | 1981–1990 | |
| 1831–1840 | 495,688 | 1911–1920 | 4,376,564 | 1991–2000 | |
| 1841–1850 | 1,597,502 | 1921–1930 | 2,477,853 | ||
| 1851–1860 | 2,452,657 | 1931–1940 | 348,289 | ||
| 1861–1870 | 2,064,407 | 1941–1950 | 621,704 | ||
| 1871–1880 | 2,261,904 | 1951–1960 | 1,328,293 | ||
| 1881–1890 | 4,731,607 | 1961–1970 | 1,129,670 | ||
| 1891–1900 | 3,558,793 | 1971–1980 | |||
| Arrivals | Total (150 yrs) | 35,679,763 | |||
| Source:[30][31][32][33][34] | |||||
| Country of origin 1820–1978 | |||||
|---|---|---|---|---|---|
| Country | Arrivals | % of total | Country | Arrivals | % of total |
| Germany1 | 6,978,000 | 14.3% | Norway | 856,000 | 1.8% |
| Italy | 5,294,000 | 10.9% | France | 751,000 | 1.5% |
| Great Britain | 4,898,000 | 10.01% | Greece | 655,000 | 1.3% |
| Ireland | 4,723,000 | 9.7% | Portugal | 446,000 | 0.9% |
| Austria-Hungary1, 2 | 4,315,000 | 8.9% | Denmark | 364,000 | 0.7% |
| Russia1, 2 | 3,374,000 | 6.9% | Netherlands | 359,000 | 0.7% |
| Sweden | 1,272,000 | 2.6% | Finland | 33,000 | 0.1% |
| Total (158 yrs) | 34,318,000 | ||||
| Source:[35][36][37] Note: Many returned to their country of origin | |||||
- European-born population
The figures below show that of the total population of specified birthplace in the United States. A total of 11.1% were born-overseas of the total population.
| Population / Proportion born in Europe in 1850–2016 | |||
|---|---|---|---|
| Year | Population | % of foreign-born | |
| 1850 | 2,031,867 | 92.2% | |
| 1860 | 3,807,062 | 92.1% | |
| 1870 | 4,941,049 | 88.8% | |
| 1880 | 5,751,823 | 86.2% | |
| 1890 | 8,030,347 | 86.9% | |
| 1900 | 8,881,548 | 86.0% | |
| 1910 | 11,810,115 | 87.4% | |
| 1920 | 11,916,048 | 85.7% | |
| 1930 | 11,784,010 | 83.0% | |
| 1960 | 7,256,311 | 75.0% | |
| 1970 | 5,740,891 | 61.7% | |
| 1980 | 5,149,572 | 39.0% | |
| 1990 | 4,350,403 | 22.9% | |
| 2000 | 4,915,557 | 15.8% | |
| 2010 | 4,817,437 | 12.1% | |
| 2016 | 4,785,267 | 10.9% | |
| Source:[38][39][40][41] | |||
| Birthplace | Population in 2010 |
Percent in 2010 |
Population in 2016 |
Percent in 2016 | |
|---|---|---|---|---|---|
| Totals, European-born | 4,817,437 | 12.0% | 4,785,267 | 10.9% | |
| Northern Europe | 923,564 | 2.3% | 950,872 | 2.2% | |
| United Kingdom | 669,794 | 1.7% | 696,896 | 1.6% | |
| Ireland | 124,457 | 0.3% | 125,840 | 0.3% | |
| Other Northern Europe | 129,313 | 0.3% | 128,136 | 0.3% | |
| Western Europe | 961,791 | 2.4% | 939,383 | 2.1% | |
| Germany | 604,616 | 1.5% | 563,985 | 1.3% | |
| France | 147,959 | 0.4% | 175,250 | 0.4% | |
| Other Western Europe | 209,216 | 0.5% | 200,148 | 0.4% | |
| Southern Europe | 779,294 | 2.0% | 760,352 | 1.7% | |
| Italy | 364,972 | 0.9% | 335,763 | 0.8% | |
| Portugal | 189,333 | 0.5% | 176,638 | 0.4% | |
| Other Southern Europe | 224,989 | 0.6% | 247,951 | 0.5% | |
| Eastern Europe | 2,143,055 | 5.4% | 2,122,951 | 4.9% | |
| Poland | 475,503 | 1.2% | 424,928 | 1.0% | |
| Russia | 383,166 | 1.0% | 397,236 | 0.9% | |
| Other Eastern Europe | 1,284,286 | 3.2% | 1,300,787 | 3.0% | |
| Other Europe (no country specified) | 9,733 | 0.0% | 11,709 | 0.0% | |
Source: 2010 and 2016[42] | |||||
Demographics

The numbers below give numbers of European Americans as measured by the U.S. Census in 1980, 1990, and 2000. The numbers are measured according to declarations in census responses. This leads to uncertainty over the real meaning of the figures: For instance, as can be seen, according to these figures, the European American population dropped 40 million in ten years, but in fact, this is a reflection of changing census responses. In particular, it reflects the increased popularity of the "American" option following its inclusion as an example in the 2000 census forms.
Breakdowns of the European American population into sub-components is a difficult and rather arbitrary exercise. Farley (1991) argues that "because of ethnic intermarriage, the numerous generations that separate respondents from their forebears and the apparent unimportance to many whites of European origin, responses appear quite inconsistent".[44]
In particular, a large majority of European Americans have ancestry from a number of different countries and the response to a single "ancestry" gives little indication of the backgrounds of Americans today. When only prompted for a single response, the examples given on the census forms and a pride in identifying the more distinctive parts of one's heritage are important factors; these will likely adversely affect the numbers reporting ancestries from the British Isles. Multiple response ancestry data often greatly increase the numbers reporting for the main ancestry groups, although Farley goes as far to conclude that "no simple question will distinguish those who identify strongly with a specific European group from those who report symbolic or imagined ethnicity." He highlights responses in the Current Population Survey (1973) where for the main "old" ancestry groups (e.g., German, Irish, English, and French), over 40% change their reported ancestry over the six-month period between survey waves (page 422).
An example is that in 1980 23.75 million Americans claimed English ancestry and 25.85 claimed English ancestry together with one or more other. This represents 49.6 million people. The table below shows that in 1990 when only single and primary responses were allowed this fell to 32 million and in 2000 to 24 million.[45]
The largest self-reported ancestries in 2000, reporting over 5 million members, were in order: German, Irish, English, American, Italian, French, and Polish. They have different distributions within the United States; in general, the northern half of the United States from Pennsylvania westward is dominated by German ancestry, and the southern-half by English and American. Irish may be found throughout the entire country.
Italian ancestry is most common in the Northeast, Polish in the Great Lakes Region and the Northeast, and French in New England and Louisiana. U.S. Census Bureau statisticians estimate that approximately 62 percent of European Americans today are either wholly or partly of English, Welsh, Irish, or Scottish ancestry. Approximately 86% of European Americans today are of northwestern and central European ancestry, and 14% are of southeastern European and White Hispanic and Latino American descent.
Ancestral origins
| Ancestral origin | 1980 / %[46] | 1990 / %[47] | 2000 / %[48] | 2016 (est.) / %[49] | Pop. change 1990–2016 | ||||
|---|---|---|---|---|---|---|---|---|---|
| United States population | 226,545,805 | 100.0 | 248,709,873 | 100.0 | 281,421,906 | 100.0 | 318,558,162 | 100.0 | |
| Total ancestries reported | 188,302,438 | 83.1 | 248,709,873 | 100.0 | 287,304,886 | 102.1 | |||
| Acadian/Cajun | 668,271 | 0.3 | 85,414 | 0.0 | 115,312 | 0.04 | |||
| Albanian | 38,658 | 0.02 | 47,710 | 0.0 | 113,661 | 0.0 | 191,463 | 0.06 | |
| Alsatian | 42,390 | 0.02 | 16,465 | 0.0 | 15,601 | 0.0 | 11,107 | 0.00 | |
| American | 12,395,999 | 5.0 | 20,625,093 | 7.3 | 22,097,012 | 6.94 | |||
| Austrian | 948,558 | 0.42 | 864,783 | 0.3 | 735,128 | 0.3 | 702,772 | 0.22 | |
| Basque | 43,140 | 0.0 | 47,956 | 0.0 | 57,793 | 0.0 | |||
| Bavarian | 4,348 | 0.0 | |||||||
| Belarusian | 7,381 | 0.00 | 4,277 | 0.0 | |||||
| Belgian | 360,277 | 0.16 | 380,498[lower-alpha 4] | 0.2 | 360,642 | 0.1 | 359,121 | 0.11 | |
| British | 1,119,154 | 0.4 | 1,085,720 | 0.4 | 1,370,222 | 0.43 | |||
| Bulgarian | 42,504 | 0.02 | 29,595 | 0.0 | 55,489 | 0.0 | 98,410 | 0.03 | |
| Carpatho Rusyn | 7,602 | 0.0 | 7,921 | 0.00 | |||||
| Celtic | 29,652 | 0.0 | 65,638 | 0.0 | 50,058 | 0.02 | |||
| Cornish | 3,991 | 0.0 | |||||||
| Croatian | 252,970 | 0.11 | 544,270 | 0.2 | 374,241 | 0.1 | 410,003 | 0.13 | |
| Cypriot | 6,053 | 0.00 | 4,897 | 0.0 | 7,663 | 0.0 | 7,332 | 0.00 | |
| Czech | 1,892,456 | 0.84 | 1,296,411[lower-alpha 5] | 0.5 | 1,262,527 | 0.4 | 1,435,359 | 0.45 | |
| Czechoslovakian | 315,285 | 0.1 | 441,403 | 0.2 | 300,424 | 0.09 | |||
| Danish | 1,518,273 | 0.67 | 1,634,669 | 0.7 | 1,430,897 | 0.5 | 1,297,738 | 0.41 | |
| Dutch | 6,304,499 | 2.78 | 6,227,089 | 2.5 | 4,542,494 | 1.6 | 4,210,787 | 1.32 | |
| Eastern European[lower-alpha 6] | 62,404 | 0.03 | 132,332 | 0.1 | 546,280 | 0.17 | |||
| English | 49,598,035 | 21.89 | 32,651,788 | 13.1 | 24,515,138 | 8.7 | 24,426,623 | 7.67 | |
| Estonian | 25,994 | 0.01 | 26,762 | 0.0 | 25,034 | 0.0 | 27,864 | 0.01 | |
| European[lower-alpha 6] | 175,461 | 0.08 | 466,718 | 0.2 | 1,968,696 | 0.7 | 3,922,881 | 1.23 | |
| Finnish | 615,872 | 0.27 | 658,870 | 0.3 | 623,573 | 0.2 | 645,053 | 0.20 | |
| Flemish | 14,157 | 0.0 | |||||||
| French (except Basque) | 12,892,246 | 5.69 | 10,320,935 | 4.1 | 8,309,908 | 3.0 | 8,151,499 | 2.56 | |
| French Canadian | 780,488 | 0.34 | 2,167,127 | 0.9 | 2,349,684 | 0.8 | 2,084,903 | 0.65 | |
| German | 49,224,146 | 21.73 | 57,947,171[lower-alpha 7] | 23.3 | 42,885,162 | 15.2 | 45,879,360 | 14.40 | |
| German Russian | 10,153 | 0.0 | 10,535 | 0.0 | 23,772 | 0.01 | |||
| Greek | 959,856 | 0.42 | 1,110,373 | 0.4 | 1,153,307 | 0.4 | 1,282,655 | 0.40 | |
| Gypsy (Rom) | 6,322 | 0.00 | 5,693 | 0.0 | |||||
| Hungarian | 1,776,902 | 0.78 | 1,582,302 | 0.6 | 1,398,724 | 0.5 | 1,423,144 | 0.45 | |
| Icelandic | 32,586 | 0.01 | 40,529 | 0.0 | 42,716 | 0.0 | 50,572 | 0.02 | |
| Irish | 40,165,702 | 17.73 | 38,735,539[lower-alpha 8] | 15.6 | 30,528,492 | 10.8 | 33,093,550 | 10.39 | |
| Italian | 12,183,692 | 5.38 | 14,664,550[lower-alpha 9] | 5.9 | 15,723,555 | 5.6 | 17,174,741 | 5.39 | |
| Latvian | 92,141 | 0.04 | 100,331 | 0.0 | 87,564 | 0.0 | 86,128 | 0.03 | |
| Lithuanian | 742,776 | 0.33 | 811,865 | 0.3 | 659,992 | 0.2 | 648,514 | 0.20 | |
| Luxemburger | 49,994 | 0.02 | 49,061 | 0.0 | 45,139 | 0.0 | 40,760 | 0.01 | |
| Macedonian | 20,365 | 0.0 | 38,051 | 0.0 | 57,221 | 0.02 | |||
| Maltese | 31,645 | 0.01 | 39,600 | 0.0 | 40,159 | 0.0 | 39,985 | 0.01 | |
| Manx | 9,220 | 0.00 | 6,317 | 0.0 | 6,955 | 0.0 | |||
| Moravian | 3,781 | 0.0 | |||||||
| Northern Irish | 16,418 | 0.01 | 4,009 | 0.0 | 3,693 | 0.0 | |||
| Norwegian | 3,453,839 | 1.52 | 3,869,395 | 1.6 | 4,477,725 | 1.6 | 4,454,964 | 1.40 | |
| Pennsylvania German | 305,841 | 0.1 | 255,807 | 0.1 | 301,483 | 0.09 | |||
| Polish | 8,228,037 | 3.63 | 9,366,106 | 3.8 | 8,977,444 | 3.2 | 9,344,126 | 2.93 | |
| Portuguese | 1,024,351 | 0.45 | 1,153,351 | 0.5 | 1,177,112 | 0.4 | 1,367,476 | 0.43 | |
| Prussian | 25,469 | 0.0 | |||||||
| Romanian | 315,258 | 0.14 | 365,544 | 0.1 | 367,310 | 0.1 | 459,841 | 0.14 | |
| Russian | 2,781,432 | 1.23 | 2,952,987 | 1.2 | 2,652,214 | 0.9 | 2,795,443 | 0.88 | |
| Saxon | 4,519 | 0.0 | |||||||
| Scandinavian | 475,007 | 0.21 | 678,880 | 0.3 | 425,099 | 0.2 | 629,819 | 0.20 | |
| Scotch-Irish | 5,617,773 | 2.3 | 4,319,232 | 1.5 | 3,056,848 | 0.96 | |||
| Scottish | 10,048,816 | 4.44 | 5,393,581 | 2.2 | 4,890,581 | 1.7 | 5,457,798 | 1.71 | |
| Serbian | 100,941 | 0.04 | 116,795 | 0.0 | 140,337 | 0.0 | 189,425 | 0.06 | |
| Sicilian | 50,389 | 0.0 | |||||||
| Slavic | 172,696 | 0.08 | 76,931 | 0.0 | 127,137 | 0.0 | 125,571 | 0.04 | |
| Slovak | 776,806 | 0.34 | 1,882,897 | 0.8 | 797,764 | 0.3 | 714,557 | 0.22 | |
| Slovene | 126,463 | 0.06 | 124,437 | 0.1 | 176,691 | 0.1 | 172,511 | 0.05 | |
| Soviet | 7,729 | 0.0 | 2,459 | 0.00 | |||||
| Spaniard | 94,528 | 0.04 | 360,935 | 0.1 | 299,948[50] | 0.1 | 768,252[51] | 0.24 | |
| Swedish | 4,345,392 | 1.92 | 4,680,863 | 1.9 | 3,998,310 | 1.4 | 3,908,762 | 1.23 | |
| Swiss | 981,543 | 0.43 | 1,045,495 | 0.4 | 911,502 | 0.3 | 937,376 | 0.29 | |
| Ukrainian | 730,056 | 0.32 | 740,723 | 0.3 | 892,922 | 0.3 | 986,597 | 0.31 | |
| Welsh | 1,664,598 | 0.73 | 2,033,893 | 0.8 | 1,753,794 | 0.6 | 1,805,577 | 0.57 | |
| West German | 3,885 | 0.0 | |||||||
| Yugoslavian | 360,174 | 0.16 | 257,994 | 0.1 | 328,547 | 0.1 | 276,360 | 0.09 | |
- Notes
- Jewish Americans, particularly those of Ashkenazi and Sephardi descent, are a diaspora population with origins in South Western Asia, but are often classified as White rather than Asian. In addition, all of the original peoples of the Middle East are classified as White by the US Census Bureau.[52][53]
- Romani Americans are a diaspora group with origins in South Asia, but Romani of European descent are sometimes classified as European.
Culture
-3_new.jpg)
European-American culture forms the basis of the culture of the United States. As the largest component of the American population, the overall American culture deeply reflects the European-influenced culture that predates the United States of America as an independent state. Much of American culture shows influences from the diverse nations of the United Kingdom and Ireland, such as the English, Irish, Cornish, Manx, Scotch-Irish and Welsh. Colonial ties to Great Britain spread the English language, legal system and other cultural attributes.[3] Scholar David Hackett Fischer asserts in Albion's Seed: Four British Folkways in America that the folkways of four groups of people who moved from distinct regions of the United Kingdom to the United States persisted and provide a substantial cultural basis for much of the modern United States.[55] Fischer explains "the origins and stability of a social system which for two centuries has remained stubbornly democratic in its politics, capitalist in its economy, libertarian in its laws and individualist in its society and pluralistic in its culture."[56]
Much of the European-American cultural lineage can be traced back to Western and Northern Europe, which is institutionalized in the government, traditions, and civic education in the United States.[57] Since most later European Americans have assimilated into American culture, most European Americans now generally express their individual ethnic ties sporadically and symbolically and do not consider their specific ethnic origins to be essential to their identity; however, European American ethnic expression has been revived since the 1960s.[16] Some European Americans such as Italians, Greeks, Poles, Germans, Ukrainians, Irish, and others have maintained high levels of ethnic identity. In the 1960s, Mexican Americans, Jewish Americans, and African Americans started exploring their cultural traditions as the ideal of cultural pluralism took hold.[16] European Americans followed suit by exploring their individual cultural origins and having less shame of expressing their unique cultural heritage.[16]
American flag
- Flag of the United States – Based on the first flag of the United States of America the Grand Union Flag was first flown on December 2, 1775.
Law
The American legal system also has its roots in French philosophy with the separation of powers and the federal system[58] along with English law in common law.[59] For example, elements of the Magna Carta in it contain provisions on criminal law that were incorporated into the Bill of Rights of the U.S. Constitution. It as well as other documents had elements influencing and incorporated into the United States Constitution.[60]
Cuisine
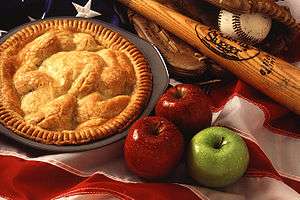
- Apple pie – New England was the first region to experience large-scale English colonization in the early 17th century, beginning in 1620, and it was dominated by East Anglian Calvinists, better known as the Puritans. Baking was a particular favorite of the New Englanders and was the origin of dishes seen today as quintessentially "American", such as apple pie and the oven-roasted Thanksgiving turkey.[61] "As American as apple pie" is a well-known phrase used to suggest that something is all-American.
- Hamburger – Invented in the United States and known as "Hamburger" after German immigrants from Hamburg who named the unnamed food,[62] this cultural and widely known icon has trans international reach and has been internationally known for decades as a symbol of American fast food.
- Maxwell Street Polish Hot Dog – Consists of a grilled or fried length of Polish sausage topped with grilled onions and yellow mustard and optional pickled whole, green sport peppers, served on a bun. The sandwich traces its origins to Chicago's Maxwell Street market, and has been called one of "the classic foods synonymous with Chicago".[63]
- Buffalo wings – Invented in 1964 at Anchor Bar in Buffalo, New York by Italian-American Teressa Bellissimo. Now popular all over the country it has become a symbol of American cuisine.[64]
Thanksgiving
- Thanksgiving – In the United States, it has become a national secular holiday (official since 1863) with religious origins. The first Thanksgiving was celebrated by English settlers to give thanks to God and the Native Americans for helping the Pilgrims of Plymouth Colony survive the brutal winter.[65] The modern Thanksgiving holiday traces its origins from a 1621 celebration at the Plymouth Plantation, where the Plymouth settlers held a harvest feast with the Native Americans after a successful growing season. William Bradford is credited as the first to proclaim the American cultural event which is generally referred to as the "First Thanksgiving".
Sports
- Baseball – The earliest recorded game of base-ball involved the family of the Prince of Wales, played indoors in London in November 1748. The Prince is reported as playing "Bass-Ball" again in September 1749 in Walton-on-Thames, Surrey, against Lord Middlesex.[66] English lawyer William Bray recorded a game of baseball on Easter Monday 1755 in Guildford, Surrey; Bray's diary was verified as authentic in September 2008.[67][68] This early form of the game was apparently brought to North America by English immigrants. The first appearance of the term that exists in print was in "A Little Pretty Pocket-Book" in 1744, where it is called Base-Ball.
- American football – can be traced to modified early versions of rugby football played in England and Canadian football mixed with and ultimately changed by American innovations which led over time to the finished version of the game from 1876 to now. The basic set of rules were first developed in American universities in the mid-19th century.[69]
Music
Another area of cultural influence are American Patriotic songs:
- American National Anthem – takes its melody from the 18th-century English song "To Anacreon in Heaven" written by John Stafford Smith for the Anacreontic Society, a men's social club in London and lyrics written by American Francis Scott Key. This became a well-known and recognized patriotic song throughout the United States, which was officially designated as the American national anthem in 1931.[70][71][72]
Before 1931, other songs served as the hymns of American officialdom.
- Amazing Grace – written by English poet and clergyman John Newton. Popular among African Americans, it became an icon in American culture and has been used for a variety of secular purposes and marketing campaigns.[73]
- Hail, Columbia – initial presidential inauguration song up until early 20th century. Now used for the Vice President.
- Battle Hymn of the Republic – Patriotic song sung during the civil war time between 1861 and 1865.
Automotive industry
- David Dunbar Buick was a Scottish-born American, a Detroit-based inventor, best known for founding the Buick Motor Company.
- Louis Chevrolet was a Swiss-born American race car driver who co-founded the Chevrolet Motor Car Company in 1911.
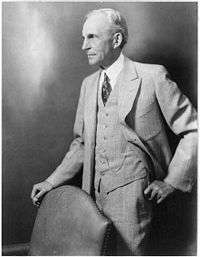
- Henry Ford was of Anglo-Irish and Belgian descent who was the founder of the Ford Motor Company.
- Harley-Davidson – The Davidson brothers, two of the three founders of one of the largest and most recognizable American motorcycle manufacturers, were of Scottish descent (William. A., Walter and Arthur Davidson). The third founder, William S. Harley, was of English descent.[74]
Notable people
Presidents
Most of the heritage that all 44 US Presidents come from (or in some combination thereof): is British (English, Scottish, Scotch-Irish or Welsh) ancestry. Others include John F. Kennedy of Irish descent, Martin Van Buren of Dutch descent and three presidents whose fathers were of German descent: Dwight D. Eisenhower (whose original family name was Eisenhauer), Herbert Hoover (Huber), and Donald Trump. Later US Presidents' ancestry can often be traced to ancestors from multiple nations in Europe.[75]
|
|
Royalty
- John Owen Dominis – European-American statesman, Prince, married to Queen Liliʻuokalani (Kingdom of Hawaii; of the House of Kalākaua).
- Wallis Simpson – European-American actress, Duchess of Windsor, married to King Edward VIII, leading to his abdication (United Kingdom; of the House of Windsor).
- Grace Kelly – European-American actress, Princess, married to Prince Rainier III (Principality of Monaco; of the House of Grimaldi).
- Hope Cooke – Irish-American writer, Gyalmo, married to Palden Thondup Namgyal (Kingdom of Sikkim; of the Namgyal dynasty).
- Meghan Markle – multiracial (African-American and European-American) actress, Duchess of Sussex, married to Prince Harry (United Kingdom; of the House of Windsor).
Admixture in Non-Hispanic Whites
Some White Americans have varying amounts of American Indian and Sub-Saharan African ancestry. In a recent study, Gonçalves et al. 2007 reported Sub-Saharan and Amerindian mtDna lineages at a frequency of 3.1% (respectively 0.9% and 2.2%) in American Caucasians (Please note that in the US, "Caucasian" includes people from North Africa and Western Asia as well as Europeans).[76] Recent research on Y-chromosomes and mtDNA detected no African admixture in European-Americans. The sample included 628 European-American Y-chromosomes and mtDNA from 922 European-Americans[77]
DNA analysis on White Americans by geneticist Mark D. Shriver showed an average of 0.7% Sub-Saharan African admixture and 3.2% Native American admixture.[78] The same author, in another study, claimed that about 30% of all White Americans, approximately 66 million people, have a median of 2.3% of Black African admixture.[79] Later, Shriver retracted his statement, saying that actually around 5% of White Americans exhibit some detectable level of African ancestry.[80]
From the 23andMe database, about 5 to at least 13 percent of self-identified White American Southerners have greater than 1 percent African ancestry.[81] Southern states with the highest African American populations, tended to have the highest percentages of hidden African ancestry.[82] White Americans (European Americans) on average are: "98.6 percent European, 0.19 percent African and 0.18 percent Native American." Inferred British/Irish ancestry is found in European Americans from all states at mean proportions of above 20%, and represents a majority of ancestry, above 50% mean proportion, in states such as Mississippi, Arkansas, and Tennessee. Scandinavian ancestry in European Americans is highly localized; most states show only trace mean proportions of Scandinavian ancestry, while it comprises a significant proportion, upwards of 10%, of ancestry in European Americans from Minnesota and the Dakotas.[81][82]
See also
- American ethnicity
- Anglo
- Ethnic groups in Europe
- European Canadians
- Europhobia
- Immigration to the United States
- Melting pot
- Non-Hispanic Whites
- Stereotypes of European Americans
- White Americans
- White Anglo-Saxon Protestant
- White ethnic
- White Hispanic and Latino Americans
- White Southerners
Notes
- Germany in this time period consisted of a large number of separate countries, the largest of which was Prussia.
- The Other category probably contains mostly English ancestry settlers; but the loss of several states' census records in makes closer estimates difficult. The summaries of the 1790 and 1800 census from all states surveyed.
- Total represents total immigration over the approximately 130-year span of colonial existence of the U.S. colonies as found in the 1790 census. At the time of the American Revolution the foreign born population was estimated to be from 300,000 to 400,000.
- Excludes Flemish.[47]
- Excludes Moravian.[47]
- This category represents a general type response, which may encompass several ancestry groups.[47]
- Excludes Bavarian, Prussian, Saxon, and West German.[47]
- Excludes Northern Irish and Celtic.[47]
- Excludes Sicilian.[47]
References
- "ACS Demographic and Housing Estimates". U.S. Census Bureau. December 2019. Retrieved March 20, 2020.
- "Euro-American". Merriam Webster Dictionary. Merriam-Webster, Incorporated. Retrieved March 13, 2014.
- Ethnic Groups of the Americas: An Encyclopedia: An Encyclopedia: By James B. Minahan – Americans of European descent (Page: 17-18)
- "A Spanish Expedition Established St. Augustine in Florida". Library of Congress. Retrieved March 27, 2009.
- Figueredo, D. H. (2007). Latino Chronology. ISBN 9780313341540. Retrieved February 4, 2015.
- SELECTED SOCIAL CHARACTERISTICS IN THE UNITED STATES – 2016 American Community Survey 1-Year Estimates
- Sharing the Dream: White Males in a Multicultural America By Dominic J. Pulera.
- Farley, Reynolds (1991). "The New Census Question about Ancestry: What Did It Tell Us?". Demography. 28 (3): 411–29. doi:10.2307/2061465. JSTOR 2061465. PMID 1936376.
- Stanley Lieberson and Lawrence Santi, "The Use of Nativity Data to Estimate Ethnic Characteristics and Patterns", Social Science Research, Vol. 14, No. 1 (1985), pp. 44-6.
- Stanley Lieberson and Mary C. Waters, "Ethnic Groups in Flux: The Changing Ethnic Responses of American Whites", Annals of the American Academy of Political and Social Science, Vol. 487, No. 79 (September 1986), pp. 82–86.
- Ancestry: 2000 – Census Bureau
- "Official census statistics of the United States race and Hispanic origin population" (PDF). US Statistics Bureau. Archived from the original (PDF) on March 27, 2010.
- Karen R. Humes; Nicholas A. Jones; Roberto R. Ramirez (March 2011). "Overview of Race and Hispanic Origin: 2010" (PDF). US Census Bureau. Retrieved March 11, 2016.
- "A Test of Methods For Collecting Racial and Ethnic Information: May 1995" (Press release). CPS Publications. October 26, 1995. Archived from the original on December 12, 2011. Retrieved March 24, 2015.
- Sandra Soo-Jin Lee; Joanna Mountain; Barbara A. Koenig (May 24, 2001). "The Meanings of Race in the New Genomics: Implications for Health Disparities Research" (PDF). Yale University. p. 54. Archived from the original (PDF) on March 3, 2016. Retrieved March 11, 2016.
- Randolph, Gayle (2007). "Why Study European Immigrants". Iowa State University. Archived from the original on May 6, 2005. Retrieved June 14, 2007.
- Crevecoeur, Hector St. John. Letters from an American Farmer. "What is an American." 1782.
- Bhopal, Raj. (1998). "White, European, Western, Caucasian or What? Inappropriate Labeling in Research on Race, Ethnicity and Health". Am J Public Health. 88 (9): 1303–7. doi:10.2105/ajph.88.9.1303. PMC 1509085. PMID 9736867.
- Adair, Margo (1990). "Challenging White Supremacy Workshop" (PDF). cwsworkshop.org. Retrieved November 5, 2006.
- Victor C. Romero (2014). "The Criminalization of Undocumented Migrants". In Lois Ann Lorentzen (ed.). Hidden Lives and Human Rights in the United States (3 volumes): Understanding the Controversies and Tragedies of Undocumented Immigration. Praeger Publications. p. 16. ISBN 978-1440828478.
The 1924 act also sought to curtail the large number of eastern and southern European migrants who began entering the United States in 1890. Through the National Origins Quota formula, the act pegged future immigration at up to 2 percent of the number of foreign-born persons from a particular country already in the United States as of the 1890 census. Through race-neutral in language, the formula favored northwestern Europeans by using the 1890 census as its referent
- Paul Spickard (2007). "The Great Wave, 1870-1930". Almost All Aliens: Immigration, Race, and Colonialism in American History and Identity: Race, Colonialism, and Immigration in American History and Identity. Routledge. p. 176. ISBN 978-0415935937.
Although many histories of immigration describe this period from the 1870s to the 1920s as one when the sources of migrants shifted from Northwest Europe to Southern and Eastern Europe - “Old Immigration” versus the “New Immigration,” Northwest Europeans continued to come and stay in very large numbers.
- Benjamin Bailey (2002). "Introduction". Language, Race, and Negotiation of Identity: A Study of Dominican Americans. University of Massachusetts Amherst. p. 15.
During the heightened immigration associated with the 1880-1920 period, many doubted that the largely Southern and Eastern European newcomers would ever assimilate to the culture of the dominant groups, who were of predominantly Northwestern European origin ... Social differences between these immigrants and European Americans who were already in America were perceived as insurmountable.
- Data From Ann Arbor, MI: Inter-university Consortium for Political and Social Research (ICPS).
- The source: a guidebook to American genealogy. By Loretto Dennis Szucs, Sandra Hargreaves Luebking
- Waters, Mary C.; Ueda, Reed; Marrow, Helen B. (June 30, 2009). The New Americans. ISBN 9780674044937. Retrieved February 4, 2015.
- Raymond L. Cohn (August 15, 2001). "Immigration to the United States". EH.Net Encyclopedia. Archived from the original on January 13, 2006. Retrieved March 24, 2015.
- "MPI Data Hub Graph". migrationinformation.org. Archived from the original on April 22, 2007. Retrieved March 24, 2015.
- Loretto Dennis Szucs; Sandra Hargreaves Luebking (2006). The Source: A Guidebook to American Genealogy. Ancestry Publishing. p. 367. ISBN 978-1-59331-277-0. Retrieved March 11, 2016.
- Elizabeth M. Grieco; Yesenia D. Acosta; G. Patricia de la Cruz; Christine Gambino; Thomas Gryn; Luke J. Larsen; Edward N. Trevelyan; Nathan P. Walters (May 2012). "The Foreign-Born Population in the United States: 2010" (PDF). US Census Bureau. Archived from the original (PDF) on February 9, 2015. Retrieved March 11, 2016.
- Statistical Abstract of the United States (Page: 98) Immigration from 1820
- Almost All Aliens: Immigration, Race, and Colonialism in American History ... By Paul Spickard
- Statistical Abstract of the United States (Page: 89)
- Statistical Abstract of the United States Immigration by country of origin 1851–1940 (Page: 107)
- Statistical Abstract of the United States (Page: 92)
- Public Opinion and the Immigrant: Mass Media Coverage, 1880–1980 Archived August 13, 2015, at the Wayback Machine Rita James Simon
- Wagner, Francis S; Wagner-Jones, Christina (1985). Nation-building in the United States. ISBN 978-0-912404-12-7.
- "European emigration statistics". Archived from the original on August 24, 2000.
- Campbell Gibson; Kay Jung (February 2006). "Population Division: Historical census statistics on the foreign-born population of the United States: 1850 to 2000 (Working Paper No. 81)" (PDF). US Census Bureau. Retrieved March 11, 2016.
- Elizabeth M. Grieco; Yesenia D. Acosta; G. Patricia de la Cruz; Christine Gambino; Thomas Gryn; Luke J. Larsen; Edward N. Trevelyan; Nathan P. Walters (May 2012). "The Foreign-Born Population in the United States: 2010" (PDF). US Census Bureau. Archived from the original (PDF) on February 9, 2015. Retrieved March 11, 2016.
- "Foreign-Born Population by Country of Birth: 1960, 1970, 1980, and 1990 plus 2000, 2006–2011" (XLSX). Migration Policy Institute. Retrieved March 11, 2016.
- United States Demographics & Social Archived July 6, 2016, at the Wayback Machine 2015% Foreign-Born population in the United States
- "PLACE OF BIRTH FOR THE FOREIGN-BORN POPULATION IN THE UNITED STATES. Universe: Foreign-born population excluding population born at sea". factfinder.census.gov. Archived from the original on February 14, 2020. Retrieved April 23, 2018.
- "Yearbook of Immigration Statistics: 2011 Supplemental Table 2". U.S. Department of Homeland Security. Retrieved February 23, 2013.
- Farley, Reynolds (1991). "The New Census Question about Ancestry: What Did It Tell Us?". Demography. 28 (3): 411–429. doi:10.2307/2061465. JSTOR 2061465. PMID 1936376.
- World Culture Encyclopedia EveryCulture.com Archived April 2, 2015, at the Wayback Machine
- "Ancestry of the Population by State: 1980 – Table 2" (PDF). United States Census Bureau. Retrieved November 21, 2018.
- "1990 Census of Population – Detailed Ancestry Groups for States" (PDF). United States Census Bureau. Retrieved November 21, 2018.
- "Ancestry: 2000". United States Census Bureau. Archived from the original on February 13, 2020. Retrieved November 21, 2018.
- "2016 American Community Survey – People Reporting Ancestry". United States Census Bureau. Archived from the original on February 13, 2020. Retrieved November 21, 2018.
- "Ancestry: 2000 – Table 2" (PDF). United States Census Bureau. Retrieved November 21, 2018.
- "2016 American Community Survey – Hispanic or Latino Origin". United States Census Bureau. Archived from the original on February 13, 2020. Retrieved November 21, 2018.
- "No Evidence from Genome-Wide Data of a Khazar Origin for the Ashkenazi Jews" (PDF). Retrieved February 4, 2015.
- Lazaridis, Iosif; Patterson, Nick; Mittnik, Alissa; Renaud, Gabriel; Mallick, Swapan; Kirsanow, Karola; Sudmant, Peter H.; Schraiber, Joshua G.; Castellano, Sergi; Lipson, Mark; Berger, Bonnie; Economou, Christos; Bollongino, Ruth; Fu, Qiaomei; Bos, Kirsten I.; Nordenfelt, Susanne; Li, Heng; De Filippo, Cesare; Prüfer, Kay; Sawyer, Susanna; Posth, Cosimo; Haak, Wolfgang; Hallgren, Fredrik; Fornander, Elin; Rohland, Nadin; Delsate, Dominique; Francken, Michael; Guinet, Jean-Michel; Wahl, Joachim; et al. (2014). "Ancient human genomes suggest three ancestral populations for present-day Europeans". Nature. 513 (7518): 409–413. arXiv:1312.6639. Bibcode:2014Natur.513..409L. doi:10.1038/nature13673. PMC 4170574. PMID 25230663.
- Mount Rushmore National Memorial Archived September 2, 2011, at the Wayback Machine. December 6, 2005.60 SD Web Traveler, Inc. Retrieved April 7, 2006.
- David Hackett Fischer, Albion's Seed (Oxford University Press, 1989), p. 6
- Hackett Fischer, David. Albion's Seed Oxford University Press, 1989.
- Kirk, Russell. The Heritage Lecture Series. "America Should Strengthen its European Cultural Roots." Washington D.C:1949
- Separation of powers#Checks and balances
- "Features – Sources of United States of America Legal Information in Languages Other than English – LLRX.com". Archived from the original on April 2, 2015. Retrieved March 17, 2015.
- "Magna Charta – Magna Charta". Retrieved March 17, 2015.
- Fischer, pp. 74, 114, 134–39.
- according to a theory; see Hamburger
- Clark, Sandy Thorne. (June 26, 2006), "Getting a taste of Chicago: City's signature flavors have tourists and locals lining up for more, more, more", Chicago Sun-Times, S1.
- The Italian American Cookbook: A Feast of Food from a Great American Cooking – By John Mariani, Galina Mariani
- William Bradford, Of Plymouth Plantation 1620–1647, 85
- Sulat, Nate (July 26, 2013). "Why isn't baseball more popular in the UK?". BBC News Online. New York. Retrieved March 1, 2018.
- "UK – England – Baseball 'origin' uncovered". BBC. September 17, 2008. Retrieved February 4, 2015.
- "BBC – South Today – Features – Baseball history". BBC.
- Pope, S. W.; Pope, Steven W. (1997). The New American Sport History. ISBN 9780252065675. Retrieved February 4, 2015.
- "John Stafford Smith: Composer of the Star Spangled Banner". visit-gloucestershire.co.uk. Archived from the original on July 11, 2007.
- "Fort McHenry: Birthplace of Our National Anthem". bcpl.net. Archived from the original on July 21, 2007.
- Lesley Nelson. "Star Spangled Banner". contemplator.com. Retrieved February 4, 2015.
- "Amazing Grace". NPR. December 29, 2002. Retrieved March 24, 2015.
- "Harley: The Littleport Connection "Without Littleport, there'd be no Harley-Davidson"". clutchandchrome.com. Archived from the original on April 21, 2006. Retrieved March 24, 2015.
- "The Presidents". americanheritage.com. Archived from the original on February 10, 2006.
- Sample of 1387 American Caucasian individuals catalogued in the FBI mtDNA population database, Gonçalves et al. 2007, Sex-biased gene flow in African Americans but not in American Caucasians Archived November 8, 2017, at the Wayback Machine
- Manfred Kayser et al. 2003, Y Chromosome STR Haplotypes and the Genetic Structure of U.S. Populations of African, European, and Hispanic Ancestry
- Shriver, et al., "Skin pigmentation, biogeographical ancestry and admixture mapping Archived December 30, 2014, at the Wayback Machine, Hum Genet (2003) 112 : 387–39.
- Sailer, Steve (May 8, 2002). "Analysis: White prof finds he's not". United Press International.
- Wootan, Jim (December 2003). "Race Reversal Man Lives as 'Black' for 50 Years – Then Finds Out He's Probably Not". ABC News. Archived from the original on August 3, 2004.
- Bryc, Katarzyna; Durand, Eric Y; MacPherson, J Michael; Reich, David; Mountain, Joanna (2014). "The genetic ancestry of African, Latino, and European Americans across the United States". bioRxiv 10.1101/009340.
- Scott Hadly, "Hidden African Ancestry Redux", DNA USA* Archived March 22, 2015, at the Wayback Machine, 23andMe, March 4, 2014.