Demographics of New England
New Englanders are the inhabitants of the New England region in the Northeastern United States. Beginning with the New England Colonies, the name "New Englander" refers to those who live in the six New England states or those with cultural or family ties to the region. Originally inhabited by Algonquin American Indians, including tribes Abenakis, Mi'kmaq, Penobscot, Pequots, Mohegans, Narragansetts, Pocumtucks, and Wampanoag. The region was first settled by European colonists from the Mayflower as part of the Plymouth Company in 1620. The region has seen many different waves of immigration since 1620, creating a unique and diverse culture. New Englanders have played a prominent role in the colonial and modern history of the United States, from political dynasties[13] to influential artists and writers.[14] Famous for their distinct dialect and attitude,[15][16] New Englanders hold a strong regional identity and a distinct history and culture within the United States.
.svg.png) Historic Flag of New England | |
| Total population | |
|---|---|
| 14,810,001[1] (2017 est.) | |
| Regions with significant populations | |
| States of New England: Connecticut, Maine, Massachusetts, New Hampshire, Rhode Island, Vermont | |
| 3,588,184[2] | |
| 1,335,907[3] | |
| 6,859,819[4] | |
| 1,342,795[5] | |
| 1,059,639[6] | |
| 623,657[7] | |
| Languages | |
| English (New England English),[8][9] Spanish, Portuguese, French (New England French)[10] | |
| Religion | |
| Predominantly Christianity (Roman Catholicism, Congregationalism), Judaism, Irreligious | |
| Related ethnic groups | |
| Acadians,[11] New England Planters[12] | |
Terminology
The region was named "New England" by English explorer John Smith in 1616.[17] While the term "New Englander" can refer to anyone who resides in New England or has cultural ties to the region, the term "Native New Englander" refers to those New Englanders who were born in the region.
Another term to refer to those who live in New England is "Yankee". Depending on the context Yankee may refer to all Americans in general, but in the colloquial American context, it refers to those who live in the Northeastern United States and even more specifically New England. Originally employed to describe New Englanders with ancestral roots to the original English settlers, the term has evolved throughout American history to have a variety of contextual meanings.[18]
Demography

According to the 2018 American Community Survey, New England had an estimated population of 14,853,290, of which 48.7% were male and 51.3% were female. Approximately 19.7% of the population were under 18 years of age; 17.4% were 65 years of age or over.[21]
In terms of race and ethnicity, White Americans made up 80.7% of New England's population, of which 74.4% were whites of non-Hispanic origin. Black Americans comprised 7.1% of the region's population, of which 6.4% were blacks of non-Hispanic origin. Native Americans made up 0.3% of the population, numbering 43,917. There were over 737,000 Asian Americans residing in New England at the time of the survey, making up 5.0% of the region's population. There were over 240,000 Chinese Americans, constituting 1.6% of the region's total population, and over 212,000 Indian Americans (1.4%).[22] Pacific Islander Americans numbered 5,794, or 0.04% of the populace.[21]
Multiracial Americans made up 3.1% of New England's population. The largest mixed-race group comprised those of African and European descent; there were over 171,000 people of black and white ancestry, making up 1.2% of the population. People of mixed Native American and European American ancestry made up 0.4% of the population, and people of Asian and European heritage 0.6%.[21]
Hispanic and Latino Americans are New England's largest minority, and they are the second-largest group in the region behind non-Hispanic European Americans. Hispanics and Latinos of any race made up 11.4% of New England's population, and there were nearly 1.7 million Hispanic and Latino individuals reported in the survey. Puerto Ricans were the most numerous of the Hispanic and Latino subgroups. Over 710,000 Puerto Ricans live in New England, forming 4.8% of the population. There are also over 281,000 Dominican Americans[23] and 136,000 Mexican Americans. Americans of Cuban descent are scant in number; there were roughly 33,000 Cuban Americans in the region as of 2018. People of other Hispanic and Latino ancestries, for example Salvadoran, Colombian, and Bolivian, formed 5.5% of New England's population, and numbered over 811,000.[21]
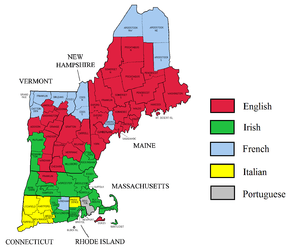
New England's European American population is ethnically diverse. The majority of the Euro-American population is of Irish, Italian, French, or English descent. Smaller but significant populations of Germans, Poles, and Portuguese descent exist as well.
According to the 2018 survey, the top ten largest European ancestries were:
Language
English is, by far, the most common language spoken at home. As of 2018, approximately 80.4% of all residents (11.1 million people) over the age of five spoke only English at home. Roughly 1.2 million people (8.4% of the population) spoke Spanish at home, and roughly 1.0 million people (7.1% of the population) spoke other Indo-European languages at home. Over 418,000 people (3.0% of the population) spoke an Asian or Pacific Island language at home.[25] Fewer than 150,000 people (about 1%) spoke French at home,[26] although this figure is above 20% in some parts of northern New England, which borders francophone Québec.[27] Roughly 156,000 people (1.1% of the population) spoke languages other than these at home.[25]
Population
| Historical population | |||
|---|---|---|---|
| Census | Pop. | %± | |
| 1790 | 1,009,408 | — | |
| 1800 | 1,233,011 | 22.2% | |
| 1810 | 1,471,973 | 19.4% | |
| 1820 | 1,660,065 | 12.8% | |
| 1830 | 1,954,717 | 17.7% | |
| 1840 | 2,234,822 | 14.3% | |
| 1850 | 2,728,116 | 22.1% | |
| 1860 | 3,135,283 | 14.9% | |
| 1870 | 3,487,924 | 11.2% | |
| 1880 | 4,010,529 | 15.0% | |
| 1890 | 4,700,749 | 17.2% | |
| 1900 | 5,592,017 | 19.0% | |
| 1910 | 6,552,681 | 17.2% | |
| 1920 | 7,400,909 | 12.9% | |
| 1930 | 8,166,341 | 10.3% | |
| 1940 | 8,437,290 | 3.3% | |
| 1950 | 9,314,453 | 10.4% | |
| 1960 | 10,509,367 | 12.8% | |
| 1970 | 11,841,663 | 12.7% | |
| 1980 | 12,348,493 | 4.3% | |
| 1990 | 13,206,943 | 7.0% | |
| 2000 | 13,922,517 | 5.4% | |
| 2010 | 14,444,865 | 3.8% | |
| Source:[21][28] | |||
As of 2018, the vast majority of New England's inhabitants, roughly 12.8 million people or 86.4% of the population, are U.S. natives. Of these, 259,000 were born in Puerto Rico, and over 145,000 were born abroad to American parents. The foreign-born population of 2.0 million forms 13.6% of New England's total population. 38.9% of foreigners were born in Latin America, 28.5% were born in Asia, 20.4% were born in Europe, and 8.2% were born in Africa. People born in other parts of North America made up 3.6% of the foreign-born populace. Oceania-born residents formed 0.4% of the foreign population, over 7,000. Of the 2.0 million foreigners, the majority (54.4%) were naturalized citizens of the U.S.[29]
The six states of New England have the lowest birth rate in the U.S.[30]
In 2018, the New England population of 14.85 million was roughly an 80% increase from its 1930 population of 8.2 million.[28] The region's average population density is 236.9 inhabitants/sq mi (91.5/km²), although a great disparity exists between its northern and southern portions. The population density is much greater than that of the U.S. as a whole (86.2/sq mi) or even just the contiguous 48 states (108.6/sq mi).
Three-quarters of the population of New England, and most of the major cities, are in the states of Connecticut, Massachusetts, and Rhode Island. Their combined population density is 839.7/sq mi, compared to northern New England's 67.1/sq mi (2018 estimates). The most populous state is Massachusetts, and the most populous city is Massachusetts' political and cultural capital, Boston.
The coastline is more urban than the western parts of the region, which are typically rural, even in urban states like Massachusetts. This is due mainly to historical factors; the original colonists settled mostly near the coastline of Massachusetts Bay. The only New England state without access to the Atlantic Ocean, Vermont, is also the least urbanized.[31] After nearly 400 years, the region still maintains, for the most part, its historical population layout.
New England's coast is dotted with urban centers, such as Portland, Portsmouth, Boston, New Bedford, Fall River, Providence, New Haven, Bridgeport, and Stamford, as well as smaller cities such as Newburyport, Gloucester, Biddeford, Bath, Rockland, Newport, Westerly, and the small twin cities of Groton and New London in Connecticut.
Southern New England forms an integral part of the BosWash megalopolis, a conglomeration of urban centers that spans from Boston to Washington, D.C. The region includes three of the four most densely populated states in the U.S.; only New Jersey has a higher population density than the states of Rhode Island, Massachusetts, and Connecticut.
Greater Boston, which includes parts of southern New Hampshire, has a total population of approximately 4.4 million,[32] while over half the population of New England falls inside Boston's Combined Statistical Area of over 7.4 million.[33]
In 2009, two New England states were among the five highest in the U.S. in divorce rates. Maine was second highest with 13.6% of people over the age of 15 divorced; Vermont was fifth with 12.6% divorced.[34] Connecticut, Massachusetts, and Rhode Island, on the other hand, have below-average divorce rates. Massachusetts is tied with Georgia with the lowest divorce rate in the U.S., at 2.4%.[35]
Largest cities

The most populous cities are as of the 2010 Census (metropolitan areas in parentheses):[36]


During the 20th century, urban expansion in regions surrounding New York City has become an important economic influence on neighboring Connecticut, parts of which belong to the New York Metropolitan Area. The U.S. Census Bureau groups Fairfield, New Haven and Litchfield counties in western Connecticut together with New York City, and other parts of New York and New Jersey as a combined statistical area.[37]
Health
The six states of New England ranked within the top thirteen "healthiest states" of the U.S. in 2007.[38] In 2008, they all placed within the top eleven states. New England also had the largest proportion of its population covered by health insurance.[39]
For 2006, four states in the region, Massachusetts, New Hampshire, Rhode Island, and Connecticut, joined 12 others nationwide, where the number of deaths caused by drugs had overtaken traffic fatalities. This was due in part to declining traffic fatalities, and in part to increased deaths caused by prescription drugs.[40]
Data from 2008 comparing national obesity rates by state, four of the six lowest obesity states were Connecticut, Massachusetts, Vermont and Rhode Island. New Hampshire and Maine had the 15th and 18th lowest obesity rates, making New England the least overweight part of the U.S.[41]
In 2008, three of New England's states had the least number of uninsured motorists (out of the top five states); Massachusetts – 1%, Maine – 4%, and Vermont – 6%.[42]
In 2006, Massachusetts adopted health care reform that requires nearly all state residents obtain health insurance,[43] which served as an important model for the federal 2010 Patient Protection and Affordable Care Act.[44]
Nursing home care can be expensive in the region. A private room in Connecticut averaged $125,925 annually. A one-bedroom in an assisted living facility averaged $55,137 in Massachusetts. Both are national highs.[45]
References
- https://fred.stlouisfed.org/series/CNEWPOP
- https://www.census.gov/quickfacts/fact/table/ct,US/PST045217
- https://www.census.gov/quickfacts/fact/table/me,US/PST045217
- https://www.census.gov/quickfacts/fact/table/ma,US/PST045217
- https://www.census.gov/quickfacts/fact/table/nh,US/PST045217
- https://www.census.gov/quickfacts/fact/table/ri,US/PST045217
- https://www.census.gov/quickfacts/fact/table/vt,US/PST045217
- Labov (2006), p. 148.
- Boberg (2001), pp. 24-5.
- Ammon, Ulrich; International Sociological Association (1989). Status and Function of Languages and Language Varieties. Walter de Gruyter. pp. 306–308. ISBN 0899253563. Retrieved April 3, 2012.
- https://newengland.com/yankee-magazine/living/new-england-history/acadian-heritage/
- Gwyn, Julian (2010). Planter Nova Scotia 1760-1815: Falmouth Township. Wolfville: Kings-Hants Heritage Connection. p. 17.
- "People & Events: Boston Brahmins". PBS. PBS Online. Retrieved 29 November 2015.
- Gates, David (June 29, 2006). "Destination: New England". Salon. Retrieved April 4, 2016.
- http://www.telegram.com/article/20081030/NEWS/810300459
- Hull, Sarah (2012-12-20). The Rough Guide to New England. ISBN 9781409359715.
- Cressy, David (1987). Coming Over: Migration and Communication Between England and New England in the Seventeenth Century. p. 4. Cambridge University Press.
- Ruth Schell (1963). "Swamp Yankee". American Speech. 38 (2): 121–123. doi:10.2307/453288. JSTOR 453288.
- Steinbicker, Earl (2000). 50 one day adventures—Massachusetts, Rhode Island, Connecticut, Vermont, Maine, and New Hampshire. Hastings House/Daytrips Publishers. p. 7. ISBN 978-0-8038-2008-1.
- Philip Emerson, The geography of New England (1922) pp. 51–56; Laura Purdom and Robert Holmes, Traveler's Companion New England (3rd ed. 2002) p. 77
- "ACS Demographic and Housing Estimates. 2018 ACS 1-Year Estimates Data Profiles (DP05): New England Division". data.census.gov. Retrieved November 18, 2019.
- Monica Chiu, ed. Asian Americans in New England: Culture and Community (University of New Hampshire Press, 2009) 252 pp.
- "Hispanic or Latino Origin by Specific Origin. 2018 ACS 1-Year Estimates Data Profiles (DP05): New England Division". data.census.gov. Retrieved November 18, 2019.
- "People Reporting Ancestry. 2018 ACS 1-Year Estimates Data Profiles (B04006): New England Division". data.census.gov. Retrieved November 18, 2019.
- "Language Spoken at Home. 2018 ACS 1-Year Estimates Data Profiles (S1601): New England Division". data.census.gov. Retrieved November 18, 2019.
- "Language Spoken at Home by Ability to Speak English for the Populatio 5 Years and Over. 2018 ACS 1-Year Estimates Data Profiles (B16001): New England Division". data.census.gov. Retrieved November 18, 2019.
- American FactFinder, United States Census Bureau. "United States (In New England County Metropolitan Area) – QT-P16. Language Spoken at Home: 2000". Archived from the original on 2020-02-12. Retrieved 2011-08-20.
- U.S. Census Bureau & Rhode Island Statewide Planning. "New England Population by State 1800–2000" (PDF). Archived from the original (PDF) on 2013-01-20. Retrieved 2012-12-22.
- "Place of Birth by Nativity and Citizenship Status: 2018 ACS 1-Year Estimates Data Profiles (B05002): New England Division". data.census.gov. Retrieved November 18, 2019.
- https://www.cdc.gov/nchs/data/nvsr/nvsr59/nvsr59_01.pdf
- "US Census figures". Allcountries.org. Retrieved 2010-10-16.
- U.S. Census Bureau – Metropolitan and micropolitan statistical area population and estimated components of change: April 1, 2000, to July 1, 2006
- "Annual Estimates of the Population of Combined Statistical Areas: April 1, 2000, to July 1, 2007" (CSV). 2007 Population Estimates. United States Census Bureau, Population Division. 2008-03-27. Retrieved 2008-04-02.
- Tamara Lush; Deanna Martin (September 25, 2009). "Indiana, Florida counties tops in divorce". Burlington, Vermont: Burlington Free Press. pp. 3A.
- "Lifestyle Statistics > Divorce Rate (most recent) by state". Statemaster.com. Retrieved 2010-02-06.
- "U.S. Census website". US Census Bureau. Retrieved 2010-06-21.
- Population Division, U.S. Census Bureau. "Combined Statistical Areas and Component Core Based Statistical Areas, December 2005". Archived from the original on 2006-06-14. Retrieved 2006-06-15.
- "Healthiest States, 2007". Pearson Education. Retrieved 2008-07-25.
- Mike Stobbe. "Health insurance lags most in Southwest, CDC says". AOL LLC. Archived from the original on 2008-07-19. Retrieved 2008-07-25.
- Stobbs (Associated Press), Mike (October 1, 2009). "Drug deaths overtake traffic fatals in 16 states". Burlington, Vermont: Burlington Free Press. pp. 7A.
- "Mississippi is the fattest state for 3rd straight year, Colorado still leanest, D.C. loses weight". CalorieLab, Inc. Retrieved 2008-07-18.
- staff, wire reports (January 23, 2009). Vt. has few uninsured motorists. Burlington Free Press.
- Fahrenthold, David A. (April 5, 2006), "Mass. Bill Requires Health Coverage", The Washington Post, p. A01. Retrieved December 6, 2006.
- Ambinder, Marc. (March 22, 2010). "Has Romney Lost The RomneyCare = ObamaCare Argument?". The Atlantic. Retrieved 2011-04-07.
- "Health care services". Melbourne, Florida: Florida Today. May 1, 2009. pp. 10C.
Further reading
- Chiu, Monica, ed. Asian Americans in New England: Culture and Community (University of New Hampshire Press, 2009) 252 pp.
- Marcuss, Mamie with Ricardo Borgos. "Who Are New England's Immigrants?" (Archive). Federal Reserve Bank of Boston.
| Topics | |||||||
|---|---|---|---|---|---|---|---|
| States | |||||||
| Major cities | |||||||
| State capitals | |||||||
| Transportation |
| ||||||
| |||||||