Climate of New England
The climate of New England varies greatly across its 500-mile (800 km) span from northern Maine to southern Connecticut. Extreme southern New England is considerably warmer, sunnier, and sees far less snow than the northernmost points of New England.
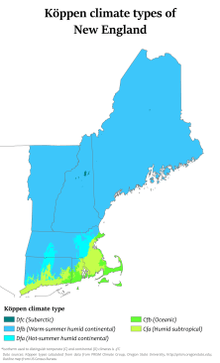


Maine, Vermont, New Hampshire, and Interior northern Massachusetts have a humid continental climate (Dfb in Köppen climate classification). In this region, the winters are long, cold, and heavy snow is common (most locations receive 60 to 120 inches (1,500 to 3,000 mm) of snow annually in this region). The summer months are moderately warm, though summer is rather short. Annual rainfall is spread evenly throughout the year. Cities like Bangor, Maine, Portland, Maine, Manchester, New Hampshire, Burlington, Vermont, and Pittsfield, Massachusetts average around 45 inches (1,100 mm) of rainfall and 60 to 90 inches (1,500 to 2,300 mm) of snow annually. The frost-free growing season ranges from just 90 days in far northern Maine and in the valleys of the White and Green Mountains, to as much as 140 days along the Southern Maine coast and in most of western Massachusetts.
In central and eastern Massachusetts, northern Rhode Island, and northern Connecticut, the same humid continental prevails (Dfa), though summers are hotter, winters are shorter with less snowfall. Cities like Boston, Worcester, Massachusetts, Hartford, and Providence generally receive 35 to 50 inches (890 to 1,270 mm) of snow annually. Summers can occasionally be hot and humid, with high temperatures in the lower Connecticut River valley of southern Massachusetts and Connecticut between 80 and 90 °F (27 and 32 °C) on a regular basis during June, July, and August. Convective Thunderstorms are common in these months as well, some of which can become severe. The frost-free growing season ranges from 140 days in parts of central Massachusetts to near 160 days across interior Connecticut and most of Rhode Island.[1]
Coastal Rhode Island and southern Connecticut are the broad transition zone from continental climates to the north, to temperate climates (called subtropical in some climate classifications) to the south. In this region, summers can be quite long and hot, with humid, tropical air masses being common between May and September. Convective thundershowers are common in summer. The coast of Connecticut from Stamford, through the New Haven area to the New London, and Westerly and Newport, Rhode Island area is usually the mildest area of New England in winter. Winter precipitation in this area falls mostly in the form of rain or a wintry mix of sleet, rain , and wet snow. Seasonal snowfall is far less across far southern Connecticut and coastal Rhode Island here than it is across interior and Northern coastal areas (only 24 to 30 inches (610 to 760 mm) of snow annually. Cold snaps in this far southern zone also tend to be shorter and less intense than points north. Winters also tend to be sunnier and warmer in southern Connecticut and southern Rhode Island compared to northern and central New England. The frost-free growing season approaches 200 days along the Connecticut coast.[2]
Tropical cyclones have struck southern New England several times, especially across southern Connecticut, coastal Rhode Island, and Cape Cod. The Great New England Hurricane Of 1938 and (Hurricane Carol) in 1954 struck the region and as a result several hundred people were killed. Other tropical cyclones that impacted the region include Hurricane Donna, Hurricane Gloria, Hurricane Bob, Hurricane Irene and Hurricane Sandy.[3]
Statistics for major cities
Northern
| Climate data for Burlington International Airport, Vermont (1981–2010 normals,[lower-alpha 1] extremes 1883–present[lower-alpha 2]) | |||||||||||||
|---|---|---|---|---|---|---|---|---|---|---|---|---|---|
| Month | Jan | Feb | Mar | Apr | May | Jun | Jul | Aug | Sep | Oct | Nov | Dec | Year |
| Record high °F (°C) | 66 (19) |
72 (22) |
84 (29) |
91 (33) |
93 (34) |
100 (38) |
100 (38) |
101 (38) |
98 (37) |
85 (29) |
75 (24) |
68 (20) |
101 (38) |
| Mean maximum °F (°C) | 49.8 (9.9) |
49.3 (9.6) |
63.9 (17.7) |
78.3 (25.7) |
85.2 (29.6) |
90.5 (32.5) |
91.8 (33.2) |
90.1 (32.3) |
85.3 (29.6) |
74.3 (23.5) |
66.0 (18.9) |
52.6 (11.4) |
93.7 (34.3) |
| Average high °F (°C) | 27.2 (−2.7) |
30.6 (−0.8) |
40.0 (4.4) |
54.7 (12.6) |
67.2 (19.6) |
76.3 (24.6) |
80.9 (27.2) |
79.0 (26.1) |
70.4 (21.3) |
57.2 (14.0) |
45.5 (7.5) |
33.2 (0.7) |
55.3 (12.9) |
| Average low °F (°C) | 10.2 (−12.1) |
12.5 (−10.8) |
22.0 (−5.6) |
34.8 (1.6) |
45.4 (7.4) |
55.3 (12.9) |
60.3 (15.7) |
58.5 (14.7) |
50.7 (10.4) |
39.1 (3.9) |
30.9 (−0.6) |
18.5 (−7.5) |
36.6 (2.6) |
| Mean minimum °F (°C) | −13.8 (−25.4) |
−9.4 (−23.0) |
−0.5 (−18.1) |
21.2 (−6.0) |
31.1 (−0.5) |
40.8 (4.9) |
48.8 (9.3) |
45.1 (7.3) |
35.5 (1.9) |
25.0 (−3.9) |
14.0 (−10.0) |
−4.3 (−20.2) |
−16.2 (−26.8) |
| Record low °F (°C) | −30 (−34) |
−30 (−34) |
−24 (−31) |
2 (−17) |
24 (−4) |
33 (1) |
39 (4) |
35 (2) |
25 (−4) |
15 (−9) |
−3 (−19) |
−29 (−34) |
−30 (−34) |
| Average precipitation inches (mm) | 2.06 (52) |
1.76 (45) |
2.22 (56) |
2.82 (72) |
3.45 (88) |
3.69 (94) |
4.16 (106) |
3.91 (99) |
3.64 (92) |
3.60 (91) |
3.13 (80) |
2.38 (60) |
36.82 (935) |
| Average snowfall inches (cm) | 21.1 (54) |
16.4 (42) |
15.8 (40) |
4.6 (12) |
trace | 0 (0) |
0 (0) |
0 (0) |
trace | 0.3 (0.76) |
5.1 (13) |
17.9 (45) |
81.2 (206) |
| Average precipitation days (≥ 0.01 in) | 14.5 | 11.2 | 12.9 | 12.8 | 14.2 | 13.3 | 12.0 | 12.3 | 11.3 | 12.9 | 14.0 | 14.4 | 155.8 |
| Average snowy days (≥ 0.1 in) | 14.5 | 10.7 | 9.0 | 3.1 | 0.1 | 0 | 0 | 0 | 0 | 0.4 | 4.7 | 11.9 | 54.4 |
| Mean monthly sunshine hours | 126.9 | 146.8 | 190.7 | 206.2 | 251.4 | 270.1 | 301.9 | 258.2 | 201.0 | 159.2 | 91.1 | 91.6 | 2,295.1 |
| Percent possible sunshine | 44 | 50 | 52 | 51 | 55 | 58 | 64 | 59 | 53 | 47 | 32 | 33 | 51 |
| Average ultraviolet index | 1 | 2 | 3 | 5 | 7 | 8 | 8 | 7 | 5 | 3 | 2 | 1 | 4 |
| Source 1: NOAA (sun 1961–1990)[4][5][6] | |||||||||||||
| Source 2: Weather Atlas [7] (sunshine data) | |||||||||||||
| Climate data for Concord Municipal Airport, New Hampshire (1981−2010 normals,[lower-alpha 3] extremes 1903–present)[lower-alpha 4] | |||||||||||||
|---|---|---|---|---|---|---|---|---|---|---|---|---|---|
| Month | Jan | Feb | Mar | Apr | May | Jun | Jul | Aug | Sep | Oct | Nov | Dec | Year |
| Record high °F (°C) | 72 (22) |
74 (23) |
89 (32) |
95 (35) |
98 (37) |
101 (38) |
102 (39) |
101 (38) |
98 (37) |
92 (33) |
80 (27) |
73 (23) |
102 (39) |
| Mean maximum °F (°C) | 50.8 (10.4) |
53.7 (12.1) |
66.6 (19.2) |
81.5 (27.5) |
88.7 (31.5) |
92.0 (33.3) |
93.1 (33.9) |
91.8 (33.2) |
87.7 (30.9) |
78.5 (25.8) |
68.7 (20.4) |
56.0 (13.3) |
95.5 (35.3) |
| Average high °F (°C) | 30.8 (−0.7) |
34.9 (1.6) |
43.8 (6.6) |
57.4 (14.1) |
68.9 (20.5) |
77.4 (25.2) |
82.3 (27.9) |
80.9 (27.2) |
72.6 (22.6) |
60.5 (15.8) |
48.4 (9.1) |
36.3 (2.4) |
58.0 (14.4) |
| Average low °F (°C) | 10.4 (−12.0) |
13.8 (−10.1) |
22.5 (−5.3) |
32.7 (0.4) |
42.6 (5.9) |
52.5 (11.4) |
57.7 (14.3) |
56.1 (13.4) |
47.4 (8.6) |
35.8 (2.1) |
28.2 (−2.1) |
17.2 (−8.2) |
34.8 (1.6) |
| Mean minimum °F (°C) | −11.2 (−24.0) |
−8.2 (−22.3) |
0.8 (−17.3) |
19.4 (−7.0) |
28.1 (−2.2) |
37.9 (3.3) |
45.4 (7.4) |
42.0 (5.6) |
31.8 (−0.1) |
21.2 (−6.0) |
11.1 (−11.6) |
−2.8 (−19.3) |
−14.6 (−25.9) |
| Record low °F (°C) | −35 (−37) |
−37 (−38) |
−20 (−29) |
4 (−16) |
21 (−6) |
30 (−1) |
35 (2) |
29 (−2) |
20 (−7) |
10 (−12) |
−17 (−27) |
−24 (−31) |
−37 (−38) |
| Average precipitation inches (mm) | 2.70 (69) |
2.62 (67) |
3.27 (83) |
3.41 (87) |
3.66 (93) |
3.69 (94) |
3.74 (95) |
3.18 (81) |
3.38 (86) |
4.04 (103) |
3.72 (94) |
3.20 (81) |
40.61 (1,033) |
| Average snowfall inches (cm) | 18.1 (46) |
12.3 (31) |
11.1 (28) |
2.8 (7.1) |
0 (0) |
0 (0) |
0 (0) |
0 (0) |
0 (0) |
trace | 2.6 (6.6) |
14.5 (37) |
61.4 (156) |
| Average precipitation days (≥ 0.01 in) | 10.8 | 9.5 | 11.5 | 11.8 | 12.4 | 12.7 | 10.9 | 9.8 | 9.3 | 10.1 | 11.2 | 10.9 | 130.9 |
| Average snowy days (≥ 0.1 in) | 8.2 | 6.5 | 5.3 | 1.2 | 0 | 0 | 0 | 0 | 0 | 0 | 1.9 | 6.6 | 29.7 |
| Average relative humidity (%) | 67.9 | 66.0 | 64.8 | 62.0 | 65.0 | 70.9 | 71.8 | 74.5 | 76.3 | 72.8 | 73.3 | 72.3 | 69.8 |
| Mean monthly sunshine hours | 162.8 | 171.8 | 210.5 | 223.2 | 258.4 | 274.3 | 295.8 | 261.9 | 214.7 | 183.4 | 127.8 | 134.8 | 2,519.4 |
| Percent possible sunshine | 56 | 58 | 57 | 56 | 57 | 60 | 64 | 61 | 57 | 54 | 44 | 48 | 56 |
| Average ultraviolet index | 1 | 2 | 4 | 5 | 7 | 8 | 8 | 7 | 6 | 3 | 2 | 1 | 5 |
| Source 1: NOAA (relative humidity and sun 1961–1990)[8][9][10] | |||||||||||||
| Source 2: Weather Atlas [11] (sunshine data) | |||||||||||||
| Climate data for Portland International Jetport, Maine (1981–2010 normals,[lower-alpha 5] extremes 1871–present[lower-alpha 6] precipitation and snowfall records date to 1871 and 1882, respectively.</ref>) | |||||||||||||
|---|---|---|---|---|---|---|---|---|---|---|---|---|---|
| Month | Jan | Feb | Mar | Apr | May | Jun | Jul | Aug | Sep | Oct | Nov | Dec | Year |
| Record high °F (°C) | 67 (19) |
68 (20) |
88 (31) |
92 (33) |
94 (34) |
98 (37) |
100 (38) |
103 (39) |
95 (35) |
88 (31) |
74 (23) |
71 (22) |
103 (39) |
| Mean maximum °F (°C) | 50.2 (10.1) |
51.4 (10.8) |
61.5 (16.4) |
74.7 (23.7) |
83.8 (28.8) |
88.8 (31.6) |
91.3 (32.9) |
90.1 (32.3) |
85.6 (29.8) |
74.7 (23.7) |
65.3 (18.5) |
55.6 (13.1) |
93.4 (34.1) |
| Average high °F (°C) | 31.2 (−0.4) |
34.6 (1.4) |
42.1 (5.6) |
53.3 (11.8) |
63.5 (17.5) |
73.2 (22.9) |
78.8 (26.0) |
77.7 (25.4) |
70.0 (21.1) |
58.7 (14.8) |
48.0 (8.9) |
37.3 (2.9) |
55.8 (13.2) |
| Average low °F (°C) | 13.4 (−10.3) |
16.4 (−8.7) |
24.9 (−3.9) |
34.7 (1.5) |
44.2 (6.8) |
53.6 (12.0) |
59.4 (15.2) |
58.2 (14.6) |
50.3 (10.2) |
38.9 (3.8) |
30.9 (−0.6) |
20.4 (−6.4) |
37.2 (2.9) |
| Mean minimum °F (°C) | −7 (−22) |
−3.1 (−19.5) |
5.9 (−14.5) |
23.9 (−4.5) |
32.2 (0.1) |
42.6 (5.9) |
49.9 (9.9) |
46.7 (8.2) |
36.5 (2.5) |
25.6 (−3.6) |
16.1 (−8.8) |
2.1 (−16.6) |
−9.9 (−23.3) |
| Record low °F (°C) | −26 (−32) |
−39 (−39) |
−21 (−29) |
8 (−13) |
23 (−5) |
33 (1) |
40 (4) |
33 (1) |
23 (−5) |
15 (−9) |
3 (−16) |
−21 (−29) |
−39 (−39) |
| Average precipitation inches (mm) | 3.38 (86) |
3.25 (83) |
4.24 (108) |
4.32 (110) |
4.01 (102) |
3.79 (96) |
3.61 (92) |
3.14 (80) |
3.69 (94) |
4.87 (124) |
4.93 (125) |
4.02 (102) |
47.25 (1,200) |
| Average snowfall inches (cm) | 19.2 (49) |
12.1 (31) |
12.7 (32) |
2.8 (7.1) |
0 (0) |
0 (0) |
0 (0) |
0 (0) |
0 (0) |
trace | 1.9 (4.8) |
13.2 (34) |
61.9 (157) |
| Average precipitation days (≥ 0.01 in) | 11.1 | 9.8 | 11.7 | 11.2 | 12.6 | 11.8 | 11.0 | 9.3 | 9.2 | 10.5 | 11.2 | 11.5 | 130.9 |
| Average snowy days (≥ 0.1 in) | 7.9 | 6.1 | 5.1 | 1.0 | 0 | 0 | 0 | 0 | 0 | 0 | 1.5 | 6.1 | 27.7 |
| Average relative humidity (%) | 66.8 | 65.2 | 66.3 | 66.8 | 71.1 | 74.7 | 75.3 | 76.3 | 76.7 | 73.9 | 72.6 | 70.2 | 71.3 |
| Mean monthly sunshine hours | 164.8 | 172.8 | 205.2 | 213.5 | 243.2 | 259.1 | 282.2 | 267.6 | 229.1 | 195.7 | 138.7 | 140.9 | 2,512.8 |
| Percent possible sunshine | 57 | 59 | 55 | 53 | 53 | 56 | 60 | 62 | 61 | 57 | 48 | 51 | 56 |
| Average ultraviolet index | 1 | 2 | 3 | 5 | 7 | 8 | 8 | 7 | 5 | 3 | 2 | 1 | 4 |
| Source 1: NOAA (relative humidity and sun 1961–1990)[12][13][14] | |||||||||||||
| Source 2: Weather Atlas [15] | |||||||||||||
| Water temperatures | |||||||||||||
|---|---|---|---|---|---|---|---|---|---|---|---|---|---|
| Month | Jan | Feb | Mar | Apr | May | Jun | Jul | Aug | Sep | Oct | Nov | Dec | Year |
| Average sea temperature °F (°C) | 41.3 (5.2) |
38.8 (3.8) |
38.0 (3.3) |
41.6 (5.3) |
46.7 (8.1) |
54.6 (12.6) |
61.3 (16.3) |
63.7 (17.7) |
60.5 (15.8) |
54.9 (12.8) |
49.6 (9.8) |
45.3 (7.4) |
49.7 (9.8) |
| Source: Weather Atlas [15] | |||||||||||||
Central
Climate data for Boston (Logan Airport), 1981−2010 normals[lower-alpha 7], extremes 1872−present[lower-alpha 8] | |||||||||||||
|---|---|---|---|---|---|---|---|---|---|---|---|---|---|
| Month | Jan | Feb | Mar | Apr | May | Jun | Jul | Aug | Sep | Oct | Nov | Dec | Year |
| Record high °F (°C) | 74 (23) |
73 (23) |
89 (32) |
94 (34) |
97 (36) |
100 (38) |
104 (40) |
102 (39) |
102 (39) |
90 (32) |
83 (28) |
76 (24) |
104 (40) |
| Mean maximum °F (°C) | 56.4 (13.6) |
57.7 (14.3) |
67.6 (19.8) |
80.7 (27.1) |
87.3 (30.7) |
92.1 (33.4) |
94.9 (34.9) |
93.3 (34.1) |
87.9 (31.1) |
79.1 (26.2) |
70.5 (21.4) |
61.3 (16.3) |
96.2 (35.7) |
| Average high °F (°C) | 35.8 (2.1) |
38.7 (3.7) |
45.4 (7.4) |
55.6 (13.1) |
66.0 (18.9) |
75.9 (24.4) |
81.4 (27.4) |
79.6 (26.4) |
72.4 (22.4) |
61.4 (16.3) |
51.5 (10.8) |
41.2 (5.1) |
58.8 (14.9) |
| Daily mean °F (°C) | 29.0 (−1.7) |
31.7 (−0.2) |
38.3 (3.5) |
48.1 (8.9) |
58.0 (14.4) |
67.7 (19.8) |
73.4 (23.0) |
72.1 (22.3) |
64.9 (18.3) |
54.0 (12.2) |
44.8 (7.1) |
34.7 (1.5) |
51.4 (10.8) |
| Average low °F (°C) | 22.2 (−5.4) |
24.7 (−4.1) |
31.1 (−0.5) |
40.6 (4.8) |
49.9 (9.9) |
59.5 (15.3) |
65.4 (18.6) |
64.6 (18.1) |
57.4 (14.1) |
46.5 (8.1) |
38.0 (3.3) |
28.2 (−2.1) |
44.1 (6.7) |
| Mean minimum °F (°C) | 4.1 (−15.5) |
8.5 (−13.1) |
14.7 (−9.6) |
30.7 (−0.7) |
40.8 (4.9) |
49.6 (9.8) |
57.3 (14.1) |
55.4 (13.0) |
45.8 (7.7) |
34.9 (1.6) |
24.2 (−4.3) |
11.1 (−11.6) |
2.3 (−16.5) |
| Record low °F (°C) | −13 (−25) |
−18 (−28) |
−8 (−22) |
11 (−12) |
31 (−1) |
41 (5) |
50 (10) |
46 (8) |
34 (1) |
25 (−4) |
−2 (−19) |
−17 (−27) |
−18 (−28) |
| Average precipitation inches (mm) | 3.36 (85) |
3.25 (83) |
4.32 (110) |
3.74 (95) |
3.49 (89) |
3.68 (93) |
3.43 (87) |
3.35 (85) |
3.44 (87) |
3.94 (100) |
3.99 (101) |
3.78 (96) |
43.77 (1,112) |
| Average snowfall inches (cm) | 12.9 (33) |
10.9 (28) |
7.8 (20) |
1.9 (4.8) |
0 (0) |
0 (0) |
0 (0) |
0 (0) |
0 (0) |
trace | 1.3 (3.3) |
9.0 (23) |
43.8 (111) |
| Average precipitation days (≥ 0.01 in) | 11.3 | 9.8 | 11.6 | 11.2 | 12.0 | 10.9 | 9.6 | 9.4 | 8.6 | 9.4 | 10.6 | 11.6 | 126.0 |
| Average snowy days (≥ 0.1 in) | 6.7 | 5.3 | 4.2 | 0.7 | 0 | 0 | 0 | 0 | 0 | 0.1 | 0.8 | 4.6 | 22.4 |
| Average relative humidity (%) | 62.3 | 62.0 | 63.1 | 63.0 | 66.7 | 68.5 | 68.4 | 70.8 | 71.8 | 68.5 | 67.5 | 65.4 | 66.5 |
| Mean monthly sunshine hours | 163.4 | 168.4 | 213.7 | 227.2 | 267.3 | 286.5 | 300.9 | 277.3 | 237.1 | 206.3 | 143.2 | 142.3 | 2,633.6 |
| Percent possible sunshine | 56 | 57 | 58 | 57 | 59 | 63 | 65 | 64 | 63 | 60 | 49 | 50 | 59 |
| Average ultraviolet index | 1 | 2 | 4 | 5 | 7 | 8 | 8 | 8 | 6 | 4 | 2 | 1 | 5 |
| Source 1: NOAA (relative humidity and sun 1961−1990)[17][18][19] | |||||||||||||
| Source 2: Weather Atlas [20] (sunshine data) | |||||||||||||
| Climate data for Boston | |||||||||||||
|---|---|---|---|---|---|---|---|---|---|---|---|---|---|
| Month | Jan | Feb | Mar | Apr | May | Jun | Jul | Aug | Sep | Oct | Nov | Dec | Year |
| Average sea temperature °F (°C) | 41.3 (5.2) |
38.1 (3.4) |
38.4 (3.5) |
43.1 (6.2) |
49.2 (9.5) |
58.4 (14.7) |
65.7 (18.7) |
67.9 (20.0) |
64.8 (18.2) |
59.4 (15.3) |
52.3 (11.3) |
46.6 (8.2) |
52.1 (11.2) |
| Source: Weather Atlas [20] | |||||||||||||
| Climate data for Providence, Rhode Island (T. F. Green Airport), 1981–2010 normals,[lower-alpha 9] extremes 1904–present[lower-alpha 10] | |||||||||||||
|---|---|---|---|---|---|---|---|---|---|---|---|---|---|
| Month | Jan | Feb | Mar | Apr | May | Jun | Jul | Aug | Sep | Oct | Nov | Dec | Year |
| Record high °F (°C) | 69 (21) |
72 (22) |
90 (32) |
98 (37) |
96 (36) |
98 (37) |
102 (39) |
104 (40) |
100 (38) |
88 (31) |
81 (27) |
77 (25) |
104 (40) |
| Mean maximum °F (°C) | 57.2 (14.0) |
58.3 (14.6) |
68.4 (20.2) |
80.3 (26.8) |
86.2 (30.1) |
91.3 (32.9) |
94.5 (34.7) |
92.3 (33.5) |
87.0 (30.6) |
78.1 (25.6) |
70.0 (21.1) |
60.8 (16.0) |
96.2 (35.7) |
| Average high °F (°C) | 37.4 (3.0) |
40.3 (4.6) |
47.8 (8.8) |
58.6 (14.8) |
68.4 (20.2) |
77.5 (25.3) |
82.8 (28.2) |
81.4 (27.4) |
74.2 (23.4) |
63.3 (17.4) |
53.2 (11.8) |
42.3 (5.7) |
60.6 (15.9) |
| Average low °F (°C) | 21.0 (−6.1) |
23.6 (−4.7) |
30.0 (−1.1) |
39.6 (4.2) |
48.6 (9.2) |
58.4 (14.7) |
64.2 (17.9) |
63.2 (17.3) |
55.3 (12.9) |
43.9 (6.6) |
35.7 (2.1) |
26.3 (−3.2) |
42.5 (5.8) |
| Mean minimum °F (°C) | 2.9 (−16.2) |
7.7 (−13.5) |
14.7 (−9.6) |
28.8 (−1.8) |
36.9 (2.7) |
47.1 (8.4) |
55.0 (12.8) |
52.4 (11.3) |
42.2 (5.7) |
31.2 (−0.4) |
21.7 (−5.7) |
10.4 (−12.0) |
0.9 (−17.3) |
| Record low °F (°C) | −13 (−25) |
−17 (−27) |
1 (−17) |
11 (−12) |
29 (−2) |
39 (4) |
48 (9) |
40 (4) |
32 (0) |
20 (−7) |
6 (−14) |
−12 (−24) |
−17 (−27) |
| Average precipitation inches (mm) | 3.86 (98) |
3.29 (84) |
5.01 (127) |
4.36 (111) |
3.55 (90) |
3.64 (92) |
3.29 (84) |
3.60 (91) |
3.92 (100) |
3.93 (100) |
4.51 (115) |
4.22 (107) |
47.18 (1,198) |
| Average snowfall inches (cm) | 9.0 (23) |
8.5 (22) |
5.5 (14) |
0.6 (1.5) |
0 (0) |
0 (0) |
0 (0) |
0 (0) |
0 (0) |
0 (0) |
1.5 (3.8) |
8.7 (22) |
33.8 (86) |
| Average precipitation days (≥ 0.01 in) | 10.9 | 9.7 | 11.9 | 11.3 | 12.0 | 10.9 | 9.4 | 9.0 | 8.7 | 9.4 | 10.1 | 11.6 | 124.9 |
| Average snowy days (≥ 0.1 in) | 5.7 | 4.6 | 3.5 | 0.4 | 0 | 0 | 0 | 0 | 0 | 0 | 0.6 | 3.9 | 18.7 |
| Average relative humidity (%) | 63.9 | 63.0 | 62.9 | 61.4 | 66.6 | 70.1 | 71.0 | 72.5 | 73.0 | 70.2 | 68.9 | 67.0 | 67.5 |
| Mean monthly sunshine hours | 171.7 | 172.6 | 215.6 | 225.1 | 254.9 | 274.1 | 290.6 | 262.8 | 233.0 | 208.7 | 148.0 | 148.6 | 2,605.7 |
| Percent possible sunshine | 58 | 58 | 58 | 56 | 57 | 60 | 63 | 61 | 62 | 61 | 50 | 52 | 58 |
| Average ultraviolet index | 1 | 2 | 4 | 6 | 7 | 8 | 8 | 8 | 6 | 4 | 2 | 1 | 5 |
| Source: Weather Atlas [22] | |||||||||||||
| Climate data for Providence | |||||||||||||
|---|---|---|---|---|---|---|---|---|---|---|---|---|---|
| Month | Jan | Feb | Mar | Apr | May | Jun | Jul | Aug | Sep | Oct | Nov | Dec | Year |
| Average sea temperature °F (°C) | 41.4 (5.2) |
38.1 (3.4) |
38.7 (3.8) |
44.1 (6.7) |
50.9 (10.5) |
59.6 (15.3) |
67.0 (19.4) |
69.3 (20.7) |
66.7 (19.3) |
61.6 (16.4) |
54.2 (12.3) |
47.7 (8.8) |
53.3 (11.8) |
| Source: Weather Atlas [22] | |||||||||||||
Southern coastal
| Climate data for Bridgeport, Connecticut (Sikorsky Airport), 1981–2010 normals, extremes 1948–present | |||||||||||||
|---|---|---|---|---|---|---|---|---|---|---|---|---|---|
| Month | Jan | Feb | Mar | Apr | May | Jun | Jul | Aug | Sep | Oct | Nov | Dec | Year |
| Record high °F (°C) | 68 (20) |
67 (19) |
84 (29) |
91 (33) |
97 (36) |
97 (36) |
103 (39) |
100 (38) |
99 (37) |
89 (32) |
78 (26) |
76 (24) |
103 (39) |
| Mean maximum °F (°C) | 55.2 (12.9) |
55.4 (13.0) |
65.8 (18.8) |
76.4 (24.7) |
83.7 (28.7) |
89.9 (32.2) |
92.9 (33.8) |
91.4 (33.0) |
85.1 (29.5) |
76.6 (24.8) |
67.4 (19.7) |
58.6 (14.8) |
94.6 (34.8) |
| Average high °F (°C) | 37.1 (2.8) |
39.7 (4.3) |
47.2 (8.4) |
57.7 (14.3) |
67.6 (19.8) |
77.0 (25.0) |
82.2 (27.9) |
80.9 (27.2) |
74.0 (23.3) |
63.3 (17.4) |
53.1 (11.7) |
42.3 (5.7) |
60.2 (15.7) |
| Daily mean °F (°C) | 30.1 (−1.1) |
32.4 (0.2) |
39.3 (4.1) |
49.3 (9.6) |
59.1 (15.1) |
68.7 (20.4) |
74.3 (23.5) |
73.3 (22.9) |
66.2 (19.0) |
54.9 (12.7) |
45.5 (7.5) |
35.4 (1.9) |
52.4 (11.3) |
| Average low °F (°C) | 23.0 (−5.0) |
25.2 (−3.8) |
31.4 (−0.3) |
41.0 (5.0) |
50.6 (10.3) |
60.4 (15.8) |
66.4 (19.1) |
65.8 (18.8) |
58.3 (14.6) |
46.5 (8.1) |
38.0 (3.3) |
28.4 (−2.0) |
44.6 (7.0) |
| Mean minimum °F (°C) | 5.3 (−14.8) |
9.8 (−12.3) |
16.3 (−8.7) |
30.0 (−1.1) |
39.7 (4.3) |
49.5 (9.7) |
57.0 (13.9) |
54.9 (12.7) |
44.6 (7.0) |
33.4 (0.8) |
23.8 (−4.6) |
12.9 (−10.6) |
3.5 (−15.8) |
| Record low °F (°C) | −7 (−22) |
−6 (−21) |
4 (−16) |
18 (−8) |
31 (−1) |
41 (5) |
49 (9) |
44 (7) |
36 (2) |
26 (−3) |
13 (−11) |
−4 (−20) |
−7 (−22) |
| Average precipitation inches (mm) | 3.10 (79) |
2.79 (71) |
4.05 (103) |
4.13 (105) |
3.80 (97) |
3.61 (92) |
3.46 (88) |
3.96 (101) |
3.48 (88) |
3.64 (92) |
3.39 (86) |
3.33 (85) |
42.74 (1,087) |
| Average snowfall inches (cm) | 7.7 (20) |
8.1 (21) |
5.1 (13) |
0.9 (2.3) |
0 (0) |
0 (0) |
0 (0) |
0 (0) |
0 (0) |
0 (0) |
0.7 (1.8) |
5.1 (13) |
27.6 (71.1) |
| Average precipitation days (≥ 0.01 inch) | 10.9 | 9.7 | 11.3 | 11.0 | 11.8 | 11.1 | 8.9 | 8.9 | 8.2 | 8.8 | 10.0 | 11.1 | 121.7 |
| Average snowy days (≥ 0.1 inch) | 4.8 | 3.5 | 2.4 | 0.3 | 0 | 0 | 0 | 0 | 0 | 0 | 0.5 | 3.1 | 14.6 |
| Source: NOAA[23][24] | |||||||||||||
See also
Notes
- Mean monthly maxima and minima (i.e. the expected highest and lowest temperature readings at any point during the year or given month) calculated based on data at said location from 1981 to 2010.
- Official records for Burlington were kept at downtown from December 1883 to 3 June 1943, and at Burlington Int'l since 4 June 1943. For more information, see ThreadEx
- Mean monthly maxima and minima (i.e. the expected highest and lowest temperature readings at any point during the year or given month) calculated based on data at said location from 1981 to 2010.
- Official records for Concord were kept at downtown from September 1868 to April 1941 and at Concord Municipal Airport since May 1941; snow records date from December 1942. For more information, see ThreadEx
- Mean monthly maxima and minima (i.e. the expected highest and lowest temperature readings at any point during the year or given month) calculated based on data at said location from 1981 to 2010.
- Official records for Portland were kept at downtown from March 1871 to 24 November 1940, and at Portland Int'l Jetport (PWM) since 25 November 1940. Temperature records are limited to the period that PWM was the official site (i.e. since 1940) and are based on the Monthly Weather Summary product issued by the NWS office in Gray, Maine.<ref name='NWS Gray/Portland, ME Monthly Weather summaries'> "Observed Weather Reports". National Oceanic and Atmospheric Administration. Retrieved 2016-09-12.
- Mean monthly maxima and minima (i.e. the expected highest and lowest temperature readings at any point during the year or given month) calculated based on data at said location from 1981 to 2010.
- Official records for Boston were kept at downtown from January 1872 to December 1935, and at Logan Airport (KBOS) since January 1936.[16]
- Mean monthly maxima and minima (i.e. the expected highest and lowest temperature readings at any point during the year or given month) calculated based on data at said location from 1981 to 2010.
- Official records for Providence kept at downtown from November 1904 to May 1932 and at T. F. Green Airport since June 1932.[21]
Notes
- https://www.gardenia.net/guide/gardening-in-new-england
- "Intellicast - New London Historic Weather Averages in Connecticut (06320)". www.intellicast.com. Retrieved 2018-06-14.
- "New England's Fall Foliage". Discover New England. Archived from the original on August 16, 2007. Retrieved May 28, 2011.
- "NowData - NOAA Online Weather Data". National Oceanic and Atmospheric Administration. Retrieved 2019-08-27.
- "Station Name: VT BURLINGTON INTL AP". National Oceanic and Atmospheric Administration. Retrieved 2016-09-11.
- "WMO Climate Normals for BURLINGTON/ETHAN ALLEN AIRPOR,VT 1961–1990". National Oceanic and Atmospheric Administration. Retrieved 2014-03-11.
- "Burlington, Vermont, USA - Monthly weather forecast and Climate data". Weather Atlas. Retrieved 4 July 2019.
- "NowData - NOAA Online Weather Data". National Oceanic and Atmospheric Administration. Retrieved 2018-02-22.
- "Station Name: NH CONCORD MUNI AP". National Oceanic and Atmospheric Administration. Retrieved 2016-09-11.
- "WMO Climate Normals for CONCORD MUNICIPAL AP, NH 1961–1990". National Oceanic and Atmospheric Administration. Retrieved 2014-03-11.
- "Concord, New Hampshire, USA - Monthly weather forecast and Climate data". Weather Atlas. Retrieved 4 July 2019.
- "NowData – NOAA Online Weather Data". National Oceanic and Atmospheric Administration. Retrieved 2019-10-30.
- "Station Name: ME PORTLAND INTL JETPORT". National Oceanic and Atmospheric Administration. Retrieved 2016-09-12.
- "NOAA". NOAA.
- "Portland, Maine, USA - Monthly weather forecast and Climate data". Weather Atlas. Retrieved 4 July 2019.
- ThreadEx
- "Station Name: MA BOSTON LOGAN INTL AP". National Oceanic and Atmospheric Administration. Retrieved 2013-03-24.
- "NowData - NOAA Online Weather Data". National Oceanic and Atmospheric Administration. Retrieved 2020-01-13.
- "WMO Climate Normals for BOSTON/LOGAN INT'L AIRPORT, MA 1961–1990". National Oceanic and Atmospheric Administration. Retrieved 2014-03-11.
- "Boston, Massachusetts, USA - Monthly weather forecast and Climate data". Weather Atlas. Retrieved 4 July 2019.
- ThreadEx
- "Providence, Rhode Island, USA - Monthly weather forecast and Climate data". Weather Atlas. Retrieved 4 July 2019.
- "NowData – NOAA Online Weather Data". National Oceanic and Atmospheric Administration. Retrieved 2018-01-08.
- "Station Name: CT BRIDGEPORT SIKORSKY MEM AP". National Oceanic and Atmospheric Administration. Retrieved 2015-02-26.
| Topics | |||||||
|---|---|---|---|---|---|---|---|
| States | |||||||
| Major cities | |||||||
| State capitals | |||||||
| Transportation |
| ||||||
| |||||||