Chongzhou
Chongzhou (Chinese: 崇州; pinyin: Chóngzhōu), known as Chongqing County (Chinese: 崇庆县) until 1994, is a county-level city of Sichuan Province, Southwest China, it is under the administration of the prefecture-level city of Chengdu, located about 37 kilometres (23 mi) west-southwest of downtown Chengdu. It is accessible by road from central Chengdu via the 65.1 km (40.5 mi)-long S8 Chengdu–Wenjiang–Qionglai Expressway, just outside the Chengdu greater ring road.
Chongzhou 崇州市 | |||||||||||||||||||||||||||||||||||||||||||||||||||||||||||||||
|---|---|---|---|---|---|---|---|---|---|---|---|---|---|---|---|---|---|---|---|---|---|---|---|---|---|---|---|---|---|---|---|---|---|---|---|---|---|---|---|---|---|---|---|---|---|---|---|---|---|---|---|---|---|---|---|---|---|---|---|---|---|---|---|
 | |||||||||||||||||||||||||||||||||||||||||||||||||||||||||||||||
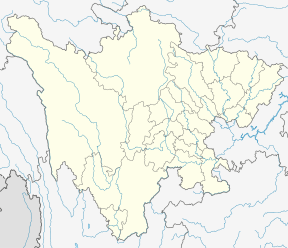 Chongzhou Location in Sichuan | |||||||||||||||||||||||||||||||||||||||||||||||||||||||||||||||
| Coordinates: 30°38′06″N 103°40′08″E[1] | |||||||||||||||||||||||||||||||||||||||||||||||||||||||||||||||
| Country | People's Republic of China | ||||||||||||||||||||||||||||||||||||||||||||||||||||||||||||||
| Province | Sichuan | ||||||||||||||||||||||||||||||||||||||||||||||||||||||||||||||
| Sub-provincial city | Chengdu | ||||||||||||||||||||||||||||||||||||||||||||||||||||||||||||||
| Area | |||||||||||||||||||||||||||||||||||||||||||||||||||||||||||||||
| • Total | 1,090 km2 (420 sq mi) | ||||||||||||||||||||||||||||||||||||||||||||||||||||||||||||||
| Population (2010)[2] | |||||||||||||||||||||||||||||||||||||||||||||||||||||||||||||||
| • Total | 661,120 | ||||||||||||||||||||||||||||||||||||||||||||||||||||||||||||||
| • Density | 607/km2 (1,570/sq mi) | ||||||||||||||||||||||||||||||||||||||||||||||||||||||||||||||
| Time zone | UTC+8 (China Standard) | ||||||||||||||||||||||||||||||||||||||||||||||||||||||||||||||
| Postal code | 6112XX | ||||||||||||||||||||||||||||||||||||||||||||||||||||||||||||||
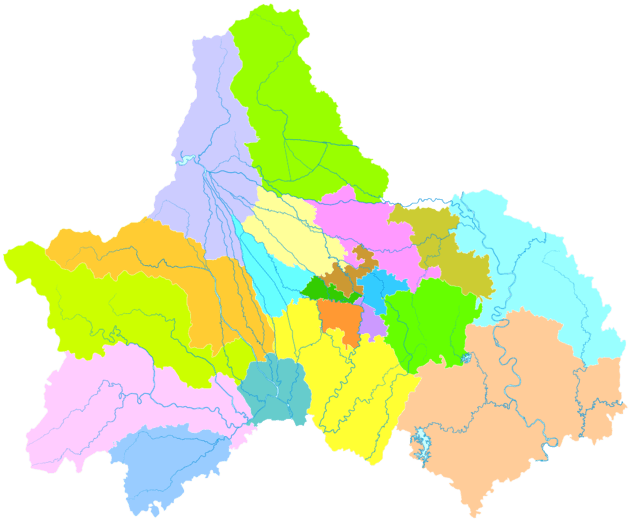
| Chengdu district map |
| ||||||||||||||||||||||||||||||||||||||||||||||||||||||||||||||
| Website | chongzhou | ||||||||||||||||||||||||||||||||||||||||||||||||||||||||||||||
Climate
| Climate data for Chongzhou (1981−2010) | |||||||||||||
|---|---|---|---|---|---|---|---|---|---|---|---|---|---|
| Month | Jan | Feb | Mar | Apr | May | Jun | Jul | Aug | Sep | Oct | Nov | Dec | Year |
| Record high °C (°F) | 17.3 (63.1) |
23.1 (73.6) |
30.1 (86.2) |
31.8 (89.2) |
34.8 (94.6) |
35.3 (95.5) |
35.6 (96.1) |
36.0 (96.8) |
35.5 (95.9) |
29.0 (84.2) |
25.2 (77.4) |
18.3 (64.9) |
36.0 (96.8) |
| Average high °C (°F) | 9.1 (48.4) |
11.4 (52.5) |
15.8 (60.4) |
21.4 (70.5) |
26.0 (78.8) |
27.6 (81.7) |
29.4 (84.9) |
29.1 (84.4) |
25.5 (77.9) |
20.4 (68.7) |
15.8 (60.4) |
10.4 (50.7) |
20.2 (68.3) |
| Daily mean °C (°F) | 5.8 (42.4) |
7.9 (46.2) |
11.5 (52.7) |
16.6 (61.9) |
21.1 (70.0) |
23.6 (74.5) |
25.3 (77.5) |
24.7 (76.5) |
21.6 (70.9) |
17.1 (62.8) |
12.4 (54.3) |
7.1 (44.8) |
16.2 (61.2) |
| Average low °C (°F) | 3.1 (37.6) |
5.1 (41.2) |
8.1 (46.6) |
12.8 (55.0) |
17.2 (63.0) |
20.5 (68.9) |
22.1 (71.8) |
21.5 (70.7) |
19.0 (66.2) |
14.8 (58.6) |
10.0 (50.0) |
4.6 (40.3) |
13.2 (55.8) |
| Record low °C (°F) | −4.7 (23.5) |
−3.9 (25.0) |
−1.4 (29.5) |
3.9 (39.0) |
6.9 (44.4) |
14.3 (57.7) |
16.1 (61.0) |
15.7 (60.3) |
12.6 (54.7) |
2.9 (37.2) |
1.0 (33.8) |
−4.4 (24.1) |
−4.7 (23.5) |
| Average precipitation mm (inches) | 10.7 (0.42) |
15.4 (0.61) |
27.9 (1.10) |
49.6 (1.95) |
80.1 (3.15) |
119.5 (4.70) |
218.4 (8.60) |
249.3 (9.81) |
136.3 (5.37) |
43.2 (1.70) |
19.3 (0.76) |
8.1 (0.32) |
977.8 (38.49) |
| Average relative humidity (%) | 83 | 82 | 81 | 79 | 75 | 81 | 85 | 85 | 84 | 84 | 83 | 83 | 82 |
| Source: China Meteorological Data Service Center[3] | |||||||||||||
References
- Google (2014-07-02). "Chongzhou" (Map). Google Maps. Google. Retrieved 2014-07-02.
- 我市2010年第六次全国人口普查数据公报 (in Chinese). Government of Chengdu. 2011-05-13. Archived from the original on 2011-09-30. Retrieved 2011-08-04.
- 中国地面气候标准值月值(1981-2010) (in Chinese). China Meteorological Data Service Center. Retrieved 20 October 2018.
External links
This article is issued from Wikipedia. The text is licensed under Creative Commons - Attribution - Sharealike. Additional terms may apply for the media files.