Affordability of housing in the United Kingdom
Affordability of housing in the UK reflects the ability to rent or buy property. Housing tenure in the UK has the following main types: Owner-occupied; Private Rented Sector (PRS); and Social Rented Sector (SRS).[1] The affordability of housing in the UK varies widely on a regional basis – house prices and rents will differ as a result of market factors such as the state of the local economy, transport links and the supply of housing.
Key determinants of affordability
For owner-occupied property key determinants of affordability are: house prices; income; interest rates; and purchase costs. For rented property, PRS rents will largely be a reflection of house prices, while SRS rents are set by Local Authorities, Housing Associations or similar.[2][3][4]
House prices
Land Registry figures for England and Wales show that house prices rose from £70,000 to £224,000 in the 20 years between 1998 and 2018.[5] Growth was almost continuous during the period, save for a two-year period of decline around 2008 as a result of the banking crisis.[6]
House price averages compared to average salary
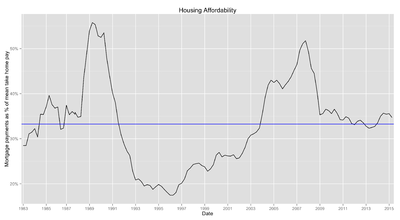

The gap between average income and average house prices has changed between 1985 and 2015 from twice an average salary to up to six times average income. Median house prices in London the median house now cost up to 12 times the median London salary. In 1995, 19,000 and the median house price was £83,000, 4.4 times median income. By 2012-13, the median income in London had increased to £24,600 and the median London house price had increased to £300,000, 12.2 times median income [7]
In 1995 the Bank Base Rate was 6%, in March 2009 it stood at 0.5% until August 2016 when it was further reduced to 0.25%.[8]
Impact of planning restrictions on house prices

An analysis by the LSE and the Dutch Bureau for Economic Policy Analysis found that house prices in England would have been 35% cheaper without regulatory constraints.[9] A report by the Adam Smith Institute found that by using 4% of London's green belt, one million homes could be built within 10 minutes walk of a railway station.[10]
The Economist has criticised green belt policy, saying that unless more houses are built through reforming planning laws and releasing green belt land, then housing space will need to be rationed out. It noted that if general inflation had risen as fast as housing prices had since 1971, a chicken would cost £51; and that Britain is "building less homes today than at any point since the 1920s".[11] According to the independent Institute of Economic Affairs, there is "overwhelming empirical evidence that planning restrictions have a substantial impact on housing costs" and are the main reason why housing was two and a half times more expensive in 2011 than it was in 1975.[12]
The Campaign to Protect Rural England argued that "Green Belt land is important for our wider environment, providing us with the trees and the undeveloped land which reduce the effect of the heat generated by big cities. Instead of reducing this green space, we should be using it to its best effect. We know from our research that three quarters (79%) of the population would like to see more trees planted and more food grown in the areas around towns and cities."[13]
Valuation of land and impact on house prices

Property companies state that land values follow house prices and that a developer assesses what new build house price is achievable in any particular location with reference to prices and sales rates in the second hand market and on nearby comparable new build sites. At a basic level (assuming no affordable housing, S106 or CIL), they then multiply that new build house price by the number of homes to be built on the land and to arrive at the gross development value (GDV) of the site. The underlying value of the land is then the GDV less the cost of development and less an allowance for profit.[15]
According to a study by Knoll, Schularick and Steger, up to 80% of the rise in houses prices between 1950 and 2012 can be attributed to the increasing price of land.[16][17] This is for two reasons. Firstly, before 1950 improving transport meant that more and more land was economically usable, but this effect subsided after 1950. Secondly, zoning restrictions did not allow the "utilisation of additional land".[16]
Department for communities and local government has shared the land value estimates for residential land, agricultural land and industrial land here.
Property costs
The principal taxes imposed by central government are Stamp Duty and Value Added Tax (VAT). Other costs which are associated with the buying and selling of property are estate agent fees, conveyancing and survey fees, mortgage arrangement fees (where applicable), and removal costs.
Stamp Duty Land Tax
Stamp Duty Land Tax is payable by the buyer of a property as a percentage of the purchase price.
From December 2014, Stamp Duty was changed to a graduated system which eliminates the jumps in stamp duty at the threshold values. For instance a property of £600,000 under the old system would pay 4% tax of the whole asking price i.e. £24,000. Under the new system no tax is paid on the first £125,000, the next £125-250,000 is charged at 2% i.e. £2500 plus the portion (£350,000) in the £250,000-£925,000 tax band at 5% i.e. £17,500. This gives a total tax of £20,000. This change was said to be beneficial to 98% of property purchases[18] but caused a collapse in sales at the upper end of the market.[19][20]
| Purchase price of property | Rate of SDLT on portion of purchase price |
|---|---|
| £0 - £125,000 | 0% |
| £125,001 to £250,000 | 2% |
| £250,001 to £925,000 | 5% |
| £925,001 to £1,500,000 | 10% |
| over £1,500,000 | 12% |
Estate Agent fees
In 2011, Which? magazine found the national average estate agents fees to be 1.8%.[21]
Survey
There are four main types of survey: a valuation survey, a condition report, a homebuyer report and a full structural survey.[22]
Legal fees
Conveyancing fees vary according to the value of the property and the service provided.[23]
Mortgage arrangement fees
In April 2013, The Daily Telegraph reported that research by Moneyfacts showed the average mortgage arrangement fee to be £1522.[24]
Other factors impacting on affordability
Council Tax
The Joseph Rowntree Foundation has suggested replacing the current Council tax system based on bands of house prices with a system which would mean the tax was more closely related to property prices. This would increase taxes on the highest priced properties and decrease them for the lowest. They claim it would also have the effect of reducing house price volatility.[25]
Land value tax is suggested by some as a replacement for council tax; it would be based entirely on land (i.e. location) value and not on the value of buildings built on a piece of land or improvements made.[26][27] [28]
International investment demand
In 2015, the Bow Group, a conservative think-tank, produced a report suggesting a reduction in international investment demand of property. The report proposed limiting foreign residents to the purchase of single new-build properties, with penalties if sold within five years.[29] In 2016, London mayor Sadiq Khan launched an inquiry into housing costs in the city, also highlighting the impact of foreign investment.[30]
Second home ownership
The government set up a £60 million fund to help councils deal with high levels of second home ownership.[31] In 2016, a referendum in St Ives, Cornwall found 83.2% of voters in favour of new housing projects being reserved for full-time residents, as many tourists frequent the area and Cornwall is popular for second home and vacation property ownership.[32]
Buy-to-let tax changes
From April 2016, a Stamp Duty surcharge of three per cent of the purchase price was required for those buying to let. From April 2017, buy-to-let mortgage interest payments will have higher rates of income tax relief phased out by the government.[33] Although, companies would not be affected by the new rules.[34]
Rented homes
The English Housing Survey Bulletin 13[35] states that in 2013/14 there were 4.4 million households in the private rented sector and 3.9 million households in the social rented sector, of whom 2.3 million households (10%) were renting from a housing association and 1.6 million (7%) were renting from a local authority. Private renters had the highest weekly housing costs, paying on average £176 per week in rent. Mortgagors paid an average of £153 per week in mortgage payments while mean weekly rents in the social housing sector were £98 for housing association tenants and £89 for local authority tenants. When considering the gross weekly income, including benefits, of all household members, the proportion of income spent on housing costs was 18% for mortgagors, 29% for social renters, and 34% for private renters.
London
The demand for more affordable housing has often been even higher in London than in the rest of the UK. [36] Research from Trust for London found that 24% of new housing completions in the three years to 2015/16 were affordable, which represented 21,500 homes. 6,700 affordable homes were completed in 2015/16, which is just 39% of the target set in the 2015 London Plan.[37] They also found that the amount of affordable homes being built varies significantly between London Boroughs. Tower Hamlets delivered 1830 affordable homes in the three years to 2015/16, the most in London, while Bexley only delivered 7, the fewest in London.[38] Affordable housing is defined as housing that costs no more than 80% of the average local market rent.[39]
See also
References
- "EHS 2013–14 Annual Reports published" (PDF). English Housing Survey Bulletin. No. 13. Retrieved 10 October 2017.
- http://data.parliament.uk/DepositedPapers/Files/DEP2018-0383/Analysis_of_the_determinants_of_house_price_changes.pdf
- https://researchbriefings.parliament.uk/ResearchBriefing/Summary/SN01090
- https://www.ons.gov.uk/peoplepopulationandcommunity/housing/bulletins/housingaffordabilityinenglandandwales/1997to2016
- "House Price Statistics (from May 1998 to May 2018)".
- "Land Registry - search the house price index". Landregistry.data.gov.uk. Retrieved 2016-01-06.
- "The widening gulf between salaries and house prices". Theguardian.com. Retrieved 2016-01-06.
- "Bank of England Statistical Interactive Database | Interest & Exchange Rates | Official Bank Rate History". Bankofengland.co.uk. Retrieved 2016-03-07.
- "Why UK house prices have grown faster than anywhere else". Telegraph.co.uk. Retrieved 2016-01-06.
- "Green belt a "green noose", claims Adam Smith Institute". Environmentsite.com. Retrieved 2016-01-06.
- "Build on the green belt or introduce space rationing: your choice", Economist.com, retrieved 2016-01-06
- Kristian Niemietz (April 2012). "Abundance of land, shortage of housing : IEA Discussion Paper No. 38" (PDF). Iea.org.uk. Retrieved 2016-01-06.
- "Green Belts: breathing spaces for people and nature - Campaign to Protect Rural England". Cpre.org.uk. Retrieved 2016-01-06.
- "The UK national balance sheet: 2017 estimates". Ons.gov.uk. Retrieved 8 January 2018.
- "Savills UK | The value of land". Savills.co.uk. Retrieved 2016-01-06.
- https://voxeu.org/article/home-prices-1870
- http://evonomics.com/josh-ryan-collins-land-economic-theory/
- "Stamp Duty Land Tax". GOV.UK. 2015-12-11. Retrieved 2015-12-29.
- "Stamp duty: has London finally lost its status as the luxury property hotspot of the world?". Telegraph. 2015-11-30. Retrieved 2016-01-06.
- Jonathan Prynn; Joanna Bourke (2015-07-24). "Stamp duty rise hits London home prices with fastest fall since the crash". Standard.co.uk. Retrieved 2016-01-06.
- "Estate agents' fees exposed - March - 2011 - Which? News". Which.co.uk. 2011-03-31. Retrieved 2012-09-23.
- "What sort of property survey should you go for?". MoneySupermarket.com. 2011-07-18. Retrieved 2015-12-29.
- Choosing a conveyancer in 2013 by Graham Norwood in The Guardian, 15 February 2013. Retrieved 18 September 2013.
- Mortgage fees climb to new high Jessica Winch, The Telegraph, 9 April 2013. Retrieved 12 October 2013. Archived here.
- "After the Council Tax: impacts of property tax reform on people, places and house prices".
- Webb, Merryn (27 September 2013). "How a levy based on location values could be the perfect tax". Financial Times. Retrieved 14 May 2015.
- "Why Henry George had a point". The Economist. Retrieved 29 June 2017.
- Smith, Adam (1776). The Wealth of Nations, Book V, Chapter 2, Article I: Taxes upon the Rent of Houses.
Ground-rents are a still more proper subject of taxation than the rent of houses. A tax upon ground-rents would not raise the rents of houses. It would fall altogether upon the owner of the ground-rent, who acts always as a monopolist, and exacts the greatest rent which can be got for the use of his ground.
- Collinson, Patrick (21 November 2015). "Is it time to close the door to foreign buyers of British property?". The Guardian. Retrieved 22 February 2017.
- Taylor, Matthew; Phillips, Tom (30 September 2016). "London mayor launches unprecedented inquiry into foreign property ownership". The Guardian. Retrieved 22 February 2017.
- https://www.theplanner.co.uk/news/fund-launched-to-tackle-second-home-ownership-problem
- "St Ives referendum: Second homes ban backed by voters". BBC News. 6 May 2016. Retrieved 22 February 2017.
- Giles, Chris (6 April 2016). "New rules will do little to quell buy-to-let boom". FT. Retrieved 22 February 2017.
- Whiscombe, David (2 September 2015). "Squeeze on buy to let". Taxation. Retrieved 22 February 2017.
- "English housing survey bulletin: issue 13". Gov.uk. Retrieved 8 January 2018.
- "Changes to affordable housing in London and implications for delivery". Joseph Rowntree Foundation. Retrieved 7 June 2018.
- "London's Poverty Profile". Trust for London. Retrieved 7 June 2018.
- "London's Poverty Profile 2017". Trust for London. Retrieved 8 February 2018.
- "Reality Check: What is affordable housing?". BBC News. Retrieved 23 May 2019.
| Architectures | |
|---|---|
| General | |
| Parliamentary acts | |
| Varieties | |
| |

| Companiese |
| ||||||||
|---|---|---|---|---|---|---|---|---|---|
| Currency, governance, regulation |
| ||||||||
| History |
| ||||||||
| Nations, regions, cities |
| ||||||||
| People and labour |
| ||||||||
| Sectors |
| ||||||||
| Trade and business organisations |
| ||||||||
| |||||||||
| Major topics | |
|---|---|
| Biological and related topics | |
| Human impact on the environment | |
| Literature |
|
| Publications | |
| Lists |
|
Events and organizations |
|
| Related topics | |
| |