1928 United States Senate elections
The United States Senate elections of 1928 were elections that coincided with the presidential election of Republican Herbert Hoover. The strong economy helped the Republicans to gain seven seats from the Democrats.
| ||||||||||||||||||||||||||||||||||||||||||||||||||||||||
32 of the 96 seats in the U.S. Senate 49 seats needed for a majority | ||||||||||||||||||||||||||||||||||||||||||||||||||||||||
|---|---|---|---|---|---|---|---|---|---|---|---|---|---|---|---|---|---|---|---|---|---|---|---|---|---|---|---|---|---|---|---|---|---|---|---|---|---|---|---|---|---|---|---|---|---|---|---|---|---|---|---|---|---|---|---|---|
| ||||||||||||||||||||||||||||||||||||||||||||||||||||||||
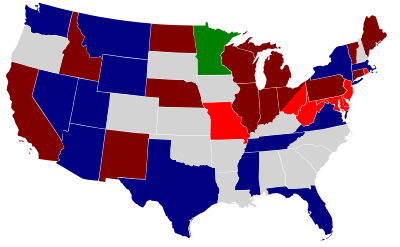 Results including special elections Democratic gains Democratic holds Republican gains Republican holds Farmer–Labor gains Farmer–Labor holds | ||||||||||||||||||||||||||||||||||||||||||||||||||||||||
| ||||||||||||||||||||||||||||||||||||||||||||||||||||||||
Senate Majority leader, Republican Charles Curtis of Kansas, was not up for election this cycle, but he was elected U.S. Vice President. He resigned March 3, 1929, so his seat was vacant at the beginning of the next Congress (March 4, 1929) until April 1, 1929, when a Republican was appointed to continue the term.
Gains and losses
Republicans gained five seats by defeating five Democratic incumbents:
- Delaware: Democratic incumbent Thomas F. Bayard, Jr. lost re-election to Republican challenger John G. Townsend, Jr..
- Maryland: Democratic incumbent William Cabell Bruce lost re-election to Republican challenger Phillips Lee Goldsborough.
- New Jersey: Democratic incumbent Edward I. Edwards lost re-election to Republican challenger Hamilton F. Kean.
- Rhode Island: Democratic incumbent Peter G. Gerry lost re-election to Republican challenger Felix Hebert.
- West Virginia: Democratic incumbent Matthew M. Neely lost re-election to Republican challenger Henry D. Hatfield.
Republicans gained one seat from a Democratic incumbent appointee who had lost nomination:
- Ohio (Special): Democratic incumbent appointee Cyrus Locher lost nomination to Graham P. Hunt to finish the term. Hunt then lost the general election to Republican Theodore E. Burton.
Republicans gained one seat from a retiring Democratic incumbent:
- Missouri: Democratic incumbent James A. Reed retired and was replaced by Republican Roscoe C. Patterson.
Republicans gained one seat from a vacancy:
- Illinois (Special): The Senate refused to seat Republican incumbent Frank L. Smith after his 1926 election. He resigned February 9, 1928, leaving the seat vacant. Republican Otis F. Glenn won a special election to finish the term ending March 3, 1933.
Republicans held two seats from retiring Republican incumbents:
- Connecticut: Republican incumbent George P. McLean retired and was replaced by Republican Frederic C. Walcott.
Democrats gained no seats.
Democrats held 1 seat from a retiring Democratic incumbent:
- Texas: Democratic incumbent Earle Bradford Mayfield retired and was replaced by Democrat Tom Connally.
Change in Senate composition
Before the elections
At the beginning of 1928.
| D1 | D2 | D3 | D4 | D5 | D6 | D7 | D8 | ||
| D18 | D17 | D16 | D15 | D14 | D13 | D12 | D11 | D10 | D9 |
| D19 | D20 | D21 | D22 | D23 | D24 | D25 | D26 | D27 | D28 Ran |
|---|---|---|---|---|---|---|---|---|---|
| D38 Ran |
D37 Ran |
D36 Ran |
D35 Ran |
D34 Ran |
D33 Ran |
D32 Ran |
D31 Ran |
D30 Ran |
D29 Ran |
| D39 Ran |
D40 Ran |
D41 Ran |
D42 Ran |
D43 Ran |
D44 Ran |
D45 Ran |
D46 Retired |
FL1 Ran |
V1 |
| Plurality ↓ | V2 | ||||||||
| R39 Ran |
R40 Ran |
R41 Ran |
R42 Ran |
R43 Ran |
R44 Ran |
R45 Ran |
R46 Ran |
R47 Retired | |
| R38 Ran |
R37 Ran |
R36 Ran |
R35 | R34 | R33 | R32 | R31 | R30 | R29 |
| R19 | R20 | R21 | R22 | R23 | R24 | R25 | R26 | R27 | R28 |
| R18 | R17 | R16 | R15 | R14 | R13 | R12 | R11 | R10 | R9 |
| R1 | R2 | R3 | R4 | R5 | R6 | R7 | R8 | ||
After the general elections
| D1 | D2 | D3 | D4 | D5 | D6 | D7 | D8 | ||
| D18 | D17 | D16 | D15 | D14 | D13 | D12 | D11 | D10 | D9 |
| D19 | D20 | D21 | D22 | D23 | D24 | D25 | D26 | D27 | D28 Re-elected |
|---|---|---|---|---|---|---|---|---|---|
| D38 Re-elected |
D37 Re-elected |
D36 Re-elected |
D35 Re-elected |
D34 Re-elected |
D33 Re-elected |
D32 Re-elected |
D31 Re-elected |
D30 Re-elected |
D29 Re-elected |
| D39 Re-elected |
D40 Hold |
FL1 Re-elected |
V1 | V2 | R53 Gain |
R52 Gain |
R51 Gain |
R50 Gain |
R49 Gain |
| Majority → | R48 Gain | ||||||||
| R39 Re-elected |
R40 Re-elected |
R41 Re-elected |
R42 Re-elected |
R43 Re-elected |
R44 Re-elected |
R45 Elected |
R46 Elected |
R47 Hold | |
| R38 Re-elected |
R37 Re-elected |
R36 Re-elected |
R35 | R34 | R33 | R32 | R31 | R30 | R29 |
| R19 | R20 | R21 | R22 | R23 | R24 | R25 | R26 | R27 | R28 |
| R18 | R17 | R16 | R15 | R14 | R13 | R12 | R11 | R10 | R9 |
| R1 | R2 | R3 | R4 | R5 | R6 | R7 | R8 | ||
After the special elections
| D1 | D2 | D3 | D4 | D5 | D6 | D7 | D8 | ||
| D18 | D17 | D16 | D15 | D14 | D13 | D12 | D11 | D10 | D9 |
| D19 | D20 | D21 | D22 | D23 | D24 | D25 | D26 | D27 | D28 |
| D38 | D37 | D36 | D35 | D34 | D33 | D32 | D31 | D30 | D29 |
| D39 | FL1 | V1 | R55 Gain |
R54 Gain |
R53 Hold |
R52 Elected |
R51 Elected |
R50 | R49 |
|---|---|---|---|---|---|---|---|---|---|
| Majority → | R48 | ||||||||
| R39 | R40 | R41 | R42 | R43 | R44 | R45 | R46 | R47 | |
| R38 | R37 | R36 | R35 | R34 | R33 | R32 | R31 | R30 | R29 |
| R19 | R20 | R21 | R22 | R23 | R24 | R25 | R26 | R27 | R28 |
| R18 | R17 | R16 | R15 | R14 | R13 | R12 | R11 | R10 | R9 |
| R1 | R2 | R3 | R4 | R5 | R6 | R7 | R8 | ||
| Key: |
|
Race summary
Special elections during the 70th Congress
In these special elections, the winner were seated during 1928; ordered by election date.
| State | Incumbent | Results | Candidates | ||
|---|---|---|---|---|---|
| Senator | Party | Electoral history | |||
| Idaho (Class 3) |
John W. Thomas | Republican | 1928 (Appointed) | Frank Gooding (R) died June 24, 1928, and Thomas was appointed June 30, 1928 to continue the term. Interim appointee elected November 6, 1928. |
|
| Illinois (Class 3) |
Vacant | 1926 Senator-elect Frank L. Smith (R) had been disqualified and resigned February 9, 1928.[2] New senator elected November 6, 1928. Republican gain. |
| ||
| Michigan (Class 1) |
Arthur H. Vandenberg | Republican | 1928 (Appointed) | Woodbridge N. Ferris (D) died March 23, 1928 and Vandenberg was appointed to continue the term. Interim appointee elected November 6, 1928. Winner was also elected to the next term, see below. |
|
| New Mexico (Class 1) |
Bronson M. Cutting | Republican | 1927 (Appointed) | Interim appointee did not run to finish the term, but was elected to the next term, see below. New senator elected November 6, 1928. Republican hold. |
|
| Ohio (Class 3) |
Cyrus Locher | Democratic | 1928 (Appointed) | Frank B. Willis (R) died March 30, 1928 and Locher was appointed to continue the term. Interim appointee lost nomination. New senator elected November 6, 1928. Republican gain. |
|
Elections leading to the 71st Congress
In these general elections, the winners were elected for the term beginning March 4, 1929; ordered by state.
All of the elections involved the Class 1 seats, unless otherwise indicated.
| State | Incumbent | Results | Candidates | ||
|---|---|---|---|---|---|
| Senator | Party | Electoral history | |||
| Arizona | Henry F. Ashurst | Democratic | 1912 1916 1922 |
Incumbent re-elected. |
|
| California | Hiram W. Johnson | Republican | 1916 1922 |
Incumbent re-elected. |
|
| Connecticut | George P. McLean | Republican | 1911 1922 |
Incumbent retired. New senator elected. Republican hold. |
|
| Delaware | Thomas F. Bayard, Jr. | Democratic | 1922 (Special) 1922 |
Incumbent lost re-election. New senator elected. Republican gain. |
|
| Florida | Park Trammell | Democratic | 1916 1922 |
Incumbent re-elected. |
|
| Indiana | Arthur Raymond Robinson | Republican | 1926 (Special) | Incumbent re-elected. |
|
| Maine | Frederick Hale | Republican | 1916 1922 |
Incumbent re-elected. |
|
| Maryland | William Cabell Bruce | Democratic | 1922 | Incumbent lost re-election. New senator elected. Republican gain. |
|
| Massachusetts | David I. Walsh | Democratic | 1926 (Special) | Incumbent re-elected. |
|
| Michigan | Arthur H. Vandenberg | Republican | 1928 (Appointed) | Interim appointee elected. Winner was also elected to finish the current term, see above. |
|
| Minnesota | Henrik Shipstead | Farmer–Labor | 1922 | Incumbent re-elected. |
|
| Mississippi | Hubert D. Stephens | Democratic | 1922 | Incumbent re-elected. |
|
| Missouri | James A. Reed | Democratic | 1910 1916 1922 |
Incumbent retired. New senator elected. Republican gain. |
|
| Montana | Burton K. Wheeler | Democratic | 1922 | Incumbent re-elected. |
|
| Nebraska | Robert B. Howell | Republican | 1922 | Incumbent re-elected. |
|
| Nevada | Key Pittman | Democratic | 1913 (Special) 1916 1922 |
Incumbent re-elected. |
|
| New Jersey | Edward I. Edwards | Democratic | 1922 | Incumbent lost re-election. New senator elected. Republican gain. |
|
| New Mexico | Bronson M. Cutting | Republican | 1927 (Appointed) | Interim appointee elected. Winner was not elected to finish the current term, see above. |
|
| New York | Royal S. Copeland | Democratic | 1922 | Incumbent re-elected. |
|
| North Dakota | Lynn J. Frazier | Republican | 1922 | Incumbent re-elected. |
|
| Ohio | Simeon D. Fess | Republican | 1922 | Incumbent re-elected. |
|
| Pennsylvania | David A. Reed | Republican | 1922 (Appointed) 1922 (Special) 1922 |
Incumbent re-elected. |
|
| Rhode Island | Peter G. Gerry | Democratic | 1916 1922 |
Incumbent lost re-election. New senator elected. Republican gain. |
|
| Tennessee | Kenneth D. McKellar | Democratic | 1916 1922 |
Incumbent re-elected. |
|
| Texas | Earle Bradford Mayfield | Democratic | 1922 | Incumbent lost renomination. New senator elected. Democratic hold. |
|
| Utah | William H. King | Democratic | 1916 1922 |
Incumbent re-elected. |
|
| Vermont | Frank L. Greene | Republican | 1916 1922 |
Incumbent re-elected. |
|
| Virginia | Claude A. Swanson | Democratic | 1910 (Appointed) 1911 (Appointed) 1912 (Special) 1916 1922 |
Incumbent re-elected. |
|
| Washington | Clarence C. Dill | Democratic | 1916 1922 |
Incumbent re-elected. |
|
| West Virginia | Matthew M. Neely | Democratic | 1922 | Incumbent lost re-election. New senator elected. Republican gain. |
|
| Wisconsin | Robert M. La Follette, Jr. | Republican | 1925 (Special) | Incumbent re-elected. |
|
| Wyoming | John B. Kendrick | Democratic | 1916 1922 |
Incumbent re-elected. |
|
Arizona
| Party | Candidate | Votes | % | ± | |
|---|---|---|---|---|---|
| Democratic | Henry F. Ashurst | 47,013 | 54.25% | ||
| Republican | Ralph H. Cameron | 39,651 | 45.75% | ||
| Majority | 7,362 | 8.50% | |||
| Turnout | 86,664 | ||||
| Democratic gain from Republican | Swing | ||||
California
| Party | Candidate | Votes | % | |
|---|---|---|---|---|
| Republican | Hiram Johnson (Incumbent) | 1,148,397 | 74.10% | |
| Democratic | Minor Moore | 282,411 | 18.22% | |
| Prohibition | Charles Hiram Randall | 92,106 | 5.94% | |
| Socialist | Lena Morrow Lewis | 26,624 | 1.72% | |
| Independent | Anita Whitney | 154 | 0.01% | |
| None | Scattering | 104 | 0.01% | |
| Majority | 865,986 | 55.88% | ||
| Turnout | 1,549,796 | |||
| Republican hold | ||||
Connecticut
| Party | Candidate | Votes | % | |
|---|---|---|---|---|
| Republican | Frederic C. Walcott | 296,958 | 53.86% | |
| Democratic | Augustine Lonergan | 251,429 | 45.60% | |
| Socialist | Plunkett | 3,014 | 0.55% | |
| Majority | 45,529 | 8.26% | ||
| Turnout | 551,401 | |||
| Republican hold | ||||
Delaware
| Party | Candidate | Votes | % | |
|---|---|---|---|---|
| Republican | John G. Townsend Jr. | 63,725 | 60.95% | |
| Democratic | Thomas F. Bayard, Jr. (Incumbent) | 40,828 | 39.05% | |
| Majority | 22,897 | 21.90% | ||
| Turnout | 104,553 | |||
| Republican gain from Democratic | ||||
Florida
| Party | Candidate | Votes | % | |
|---|---|---|---|---|
| Democratic | Park Trammell (Incumbent) | 153,816 | 68.53% | |
| Republican | Barclay H. Warburton | 70,633 | 31.47% | |
| Majority | 83,183 | 37.06% | ||
| Turnout | 224,449 | |||
| Democratic hold | ||||
Idaho (Special)
| Party | Candidate | Votes | % | |
|---|---|---|---|---|
| Republican | John W. Thomas | 90,922 | 62.56% | |
| Democratic | Chase A. Clark | 53,399 | 36.74% | |
| Socialist | Lundt | 1,016 | 0.70% | |
| Majority | 37,523 | 25.82% | ||
| Turnout | 145,337 | |||
| Republican hold | ||||
Illinois (Special)
| Party | Candidate | Votes | % | |
|---|---|---|---|---|
| Republican | Otis F. Glenn | 1,594,031 | 54.46% | |
| Democratic | Anton J. Cermak | 1,315,338 | 44.94% | |
| Socialist | George R. Kirkpatrick | 13,002 | 0.44% | |
| Workers | Max Bedacht | 3,177 | 0.11% | |
| Socialist Labor | G. A. Jenning | 1,463 | 0.05% | |
| Majority | 278,693 | 9.52% | ||
| Turnout | 2,927,011 | |||
| Republican gain from Democratic | ||||
Indiana
| Party | Candidate | Votes | % | |
|---|---|---|---|---|
| Republican | Arthur Raymond Robinson (Incumbent) | 782,144 | 55.30% | |
| Democratic | Albert Stump | 623,996 | 44.12% | |
| Prohibition | William H. Harris | 4,033 | 0.29% | |
| Socialist | Philip K. Reinbold | 3,346 | 0.24% | |
| Socialist Labor | Charles Ginsberg | 443 | 0.03% | |
| Workers | William F. Jackson | 327 | 0.02% | |
| National | John Zalind | 151 | 0.01% | |
| Majority | 158,148 | 11.18% | ||
| Turnout | 1,414,440 | |||
| Republican hold | ||||
Maine
| Party | Candidate | Votes | % | |
|---|---|---|---|---|
| Republican | Frederick Hale (Incumbent) | 245,501 | 79.47% | |
| Democratic | Herbert E. Holmes | 63,429 | 20.53% | |
| Majority | 182,072 | 58.94% | ||
| Turnout | 308,930 | |||
| Republican hold | ||||
Maryland
| Party | Candidate | Votes | % | |
|---|---|---|---|---|
| Republican | Phillips Lee Goldsborough | 256,224 | 54.05% | |
| Democratic | William Cabell Bruce (incumbent) | 214,447 | 45.24% | |
| Socialist | ? | 2,026 | 0.43% | |
| Labor | ? | 1,370 | 0.29% | |
| Majority | 41,777 | 8.81% | ||
| Turnout | 474,067 | |||
| Republican gain from Democratic | ||||
Massachusetts
| Party | Candidate | Votes | % | ± | |
|---|---|---|---|---|---|
| Democratic | David I. Walsh | 818,055 | 53.65 | ||
| Republican | Benjamin Loring Young | 693,563 | 45.48 | ||
| Socialist | Alfred B. Lewis | 7,675 | 0.50 | ||
| Workers Party | John J. Ballam | 5,621 | 0.37 | ||
Michigan
| Party | Candidate | Votes | % | |
|---|---|---|---|---|
| Republican | Arthur Vandenberg (Incumbent) | 977,893 | 71.79% | |
| Democratic | John W. Bailey | 376,592 | 27.65% | |
| Socialist | William L. Krieghoff | 2,796 | 0.21% | |
| Workers | Ben A. Faulkner | 2,249 | 0.17% | |
| Prohibition | Duly McCone | 1,927 | 0.14% | |
| Socialist Labor | David Boyd | 689 | 0.05% | |
| Majority | 601,301 | 44.14% | ||
| Turnout | 1,362,146 | |||
| Republican hold | ||||
Michigan (Special)
| Party | Candidate | Votes | % | |
|---|---|---|---|---|
| Republican | Arthur Vandenberg (Incumbent) | 974,203 | 72.03% | |
| Democratic | John W. Bailey | 375,673 | 27.77% | |
| Socialist | Francis W. Elliott | 2,682 | 0.20% | |
| None | Scattering | 3 | 0.00% | |
| Majority | 598,530 | 44.26% | ||
| Turnout | 1,352,561 | |||
| Republican hold | ||||
Minnesota
| Party | Candidate | Votes | % | |
|---|---|---|---|---|
| Farmer–Labor | Henrik Shipstead (Incumbent) | 665,169 | 65.37% | |
| Republican | Arthur E. Nelson | 342,992 | 33.71% | |
| Democratic | Vincent R. Dunne | 9,380 | 0.92% | |
| Majority | 322,177 | 31.66% | ||
| Turnout | 1,017,541 | |||
| Farmer–Labor hold | ||||
Mississippi
| Party | Candidate | Votes | % | |
|---|---|---|---|---|
| Democratic | Hubert D. Stephens (Incumbent) | 111,180 | 100.00% | |
| Democratic hold | ||||
Missouri
| Party | Candidate | Votes | % | |
|---|---|---|---|---|
| Republican | Roscoe C. Patterson | 787,499 | 51.91% | |
| Democratic | Charles M. Hay | 726,322 | 47.88% | |
| Socialist | Charles H. Harrison | 2,845 | 0.19% | |
| Socialist Labor | William W. Cox | 257 | 0.02% | |
| Majority | 61,177 | 4.03% | ||
| Turnout | 1,516,923 | |||
| Republican gain from Democratic | ||||
Montana
| Party | Candidate | Votes | % | |
|---|---|---|---|---|
| Democratic | Burton K. Wheeler (Incumbent) | 103,655 | 53.20% | |
| Republican | Joseph M. Dixon | 91,185 | 46.80% | |
| Majority | 12,470 | 6.40% | ||
| Turnout | 194,840 | |||
| Democratic hold | ||||
Nebraska
| Party | Candidate | Votes | % | |
|---|---|---|---|---|
| Republican | Robert B. Howell (Incumbent) | 324,014 | 61.28% | |
| Democratic | Richard L. Metcalfe | 204,737 | 38.72% | |
| None | Scattering | 1 | 0.00% | |
| Majority | 119,277 | 22.56% | ||
| Turnout | 528,752 | |||
| Republican hold | ||||
Nevada
| Party | Candidate | Votes | % | |
|---|---|---|---|---|
| Democratic | Key Pittman (Incumbent) | 19,515 | 59.26% | |
| Republican | Samuel Platt | 13,414 | 40.74% | |
| Majority | 6,101 | 18.52% | ||
| Turnout | 32,929 | |||
| Democratic hold | ||||
New Jersey
| Party | Candidate | Votes | % | |
|---|---|---|---|---|
| Republican | Hamilton Fish Kean | 841,752 | 57.87% | |
| Democratic | Edward I. Edwards (incumbent) | 608,623 | 41.84% | |
| Socialist | Charlotte L. Bohlin | 2,267 | 0.16% | |
| Workers | Albert Weisbrod | 1,333 | 0.09% | |
| Prohibition | Will D. Martin | 372 | 0.03% | |
| Socialist Labor | Frank Sanders | 280 | 0.02% | |
| Majority | 232,129 | 16.03% | ||
| Turnout | 1,454,627 | |||
| Republican gain from Democratic | ||||
New Mexico
| Party | Candidate | Votes | % | |
|---|---|---|---|---|
| Republican | Bronson M. Cutting (Incumbent) | 68,070 | 57.69% | |
| Democratic | Jethro S. Vaught | 49,913 | 42.31% | |
| Majority | 18,157 | 15.38% | ||
| Turnout | 117,983 | |||
| Republican hold | ||||
New Mexico (Special)
| Party | Candidate | Votes | % | |
|---|---|---|---|---|
| Republican | Octavio A. Larrazolo (incumbent) | 64,623 | 55.65% | |
| Democratic | Juan N. Vigil | 51,495 | 44.35% | |
| Majority | 13,128 | 11.30% | ||
| Turnout | 116,118 | |||
| Republican hold | ||||
New York
| Party | Candidate | Votes | % | |
|---|---|---|---|---|
| Democratic | Royal S. Copeland (incumbent) | 2,084,273 | 49.08% | |
| Republican | Alanson B. Houghton | 2,034,014 | 47.89% | |
| Socialist | McAlister Coleman | 111,208 | 2.62% | |
| Workers | Robert Minor | 11,956 | 0.28% | |
| Socialist Labor | Henry Kuhn | 5,543 | 0.13% | |
| Majority | 50,259 | 1.19% | ||
| Turnout | 4,246,994 | |||
| Democratic hold | ||||
North Dakota
| Party | Candidate | Votes | % | |
|---|---|---|---|---|
| Republican | Lynn Frazier (Incumbent) | 159,940 | 79.63% | |
| Democratic | F. F. Burchard | 38,856 | 19.35% | |
| Farmer–Labor | Alfred Knutson | 2,047 | 1.02% | |
| Majority | 121,084 | 60.28% | ||
| Turnout | 200,843 | |||
| Republican hold | ||||
Ohio
| Party | Candidate | Votes | % | |
|---|---|---|---|---|
| Republican | Simeon D. Fess (Incumbent) | 1,412,805 | 60.73% | |
| Democratic | Charles V. Truax | 908,952 | 39.07% | |
| Independent | Joseph Willnecker | 2,061 | 0.09% | |
| Independent | James Goward | 1,384 | 0.06% | |
| Independent | J. Wetherell Hutton | 1,003 | 0.04% | |
| Majority | 503,853 | 21.66% | ||
| Turnout | 232,620 | |||
| Republican hold | ||||
Ohio (Special)
| Party | Candidate | Votes | % | |
|---|---|---|---|---|
| Republican | Theodore E. Burton | 1,429,554 | 62.43% | |
| Democratic | Graham P. Hunt (Incumbent) | 856,807 | 37.42% | |
| Independent | Israel Amter | 2,062 | 0.09% | |
| Independent | Anna K. Storck | 1,389 | 0.06% | |
| Majority | 572,747 | 25.01% | ||
| Turnout | 2,289,812 | |||
| Republican gain from Democratic | ||||
Pennsylvania
| Party | Candidate | Votes | % | ± | |
|---|---|---|---|---|---|
| Republican | David A. Reed (inc.) | 1,948,646 | 64.38% | +8.77% | |
| Democratic | William N. McNair | 1,029,055 | 34.00% | +3.87% | |
| Socialist | William J. Van Essen | 23,100 | 0.76% | -1.53% | |
| Prohibition | Elisha K. Kane | 14,866 | 0.49% | -2.42% | |
| Socialist Labor | Charles Kutz | 7,524 | 0.25% | +0.25% | |
| Workers Party | W. J. White | 2,420 | 0.08% | +0.08% | |
| Socialist Labor | William H. Thomas | 1,234 | 0.04% | +0.04% | |
| N/A | Other | 19 | 0.00% | N/A | |
| Totals | 3,026,864 | 100.00% | |||
Rhode Island
| Party | Candidate | Votes | % | |
|---|---|---|---|---|
| Republican | Felix Hebert | 119,228 | 50.57% | |
| Democratic | Peter G. Gerry (Incumbent) | 116,234 | 49.30% | |
| Workers | James P. Reid | 313 | 0.13% | |
| Majority | 2,994 | 1.27% | ||
| Turnout | 235,775 | |||
| Republican gain from Democratic | ||||
Tennessee
| Party | Candidate | Votes | % | |
|---|---|---|---|---|
| Democratic | Kenneth D. McKellar (Incumbent) | 175,329 | 59.32% | |
| Republican | J. A. Fowler | 120,259 | 40.68% | |
| Majority | 55,070 | 18.64% | ||
| Turnout | 295,588 | |||
| Democratic hold | ||||
Texas
| Party | Candidate | Votes | % | |
|---|---|---|---|---|
| Democratic | Tom Connally | 566,139 | 81.24% | |
| Republican | T. M. Kennerly | 129,910 | 18.64% | |
| Socialist | David Curran | 690 | 0.10% | |
| Communist | John Rust | 114 | 0.02% | |
| Majority | 436,229 | 62.60% | ||
| Turnout | 696,853 | |||
| Democratic hold | ||||
Utah
| Party | Candidate | Votes | % | |
|---|---|---|---|---|
| Democratic | William H. King (Incumbent) | 97,436 | 55.52% | |
| Republican | Ernest Bamberger | 77,073 | 43.91% | |
| Socialist | Charles T. Stoney | 998 | 0.57% | |
| Majority | 20,363 | 11.61% | ||
| Turnout | 175,507 | |||
| Democratic hold | ||||
Vermont
| Party | Candidate | Votes | % | |
|---|---|---|---|---|
| Republican | Frank L. Greene (Incumbent) | 93,136 | 71.55% | |
| Democratic | Fred C. Martin | 37,030 | 28.45% | |
| Majority | 56,106 | 43.10% | ||
| Turnout | 130,166 | |||
| Republican hold | ||||
Virginia
| Party | Candidate | Votes | % | ± | |
|---|---|---|---|---|---|
| Democratic | Claude A. Swanson (inc.) | 275,425 | 99.84% | +27.96% | |
| Write-ins | 436 | 0.16% | +0.16% | ||
| Majority | 274,989 | 99.68% | +54.29% | ||
| Turnout | 275,861 | ||||
| Democratic hold | |||||
Washington
| Party | Candidate | Votes | % | |
|---|---|---|---|---|
| Democratic | Clarence Dill (Incumbent) | 261,524 | 53.42% | |
| Republican | Kenneth Mackintosh | 227,415 | 46.45% | |
| Workers Communist | Alex Noral | 666 | 0.14% | |
| Majority | 34,109 | 6.97% | ||
| Turnout | 489,605 | |||
| Democratic hold | ||||
West Virginia
| Party | Candidate | Votes | % | |
|---|---|---|---|---|
| Republican | Henry D. Hatfield | 327,266 | 50.68% | |
| Democratic | Matthew M. Neely (Incumbent) | 317,620 | 49.18% | |
| Socialist | M. S. Holt | 919 | 0.14% | |
| Majority | 9,646 | 1.50% | ||
| Turnout | 645,805 | |||
| Republican gain from Democratic | ||||
Wisconsin
| Party | Candidate | Votes | % | |
|---|---|---|---|---|
| Republican | Robert M. La Follette Jr. | 635,379 | 85.56% | |
| Independent Republican | William H. Markham | 81,302 | 10.95% | |
| Prohibition | David W. Emerson | 21,359 | 2.88% | |
| Independent Labor | Richard Koeppel | 3,053 | 0.41% | |
| Workers | John Kasun | 1,463 | 0.20% | |
| None | Scattering | 92 | 0.01% | |
| Majority | 54,077 | 74.61% | ||
| Turnout | 742,648 | |||
| Republican hold | ||||
Wyoming
| Party | Candidate | Votes | % | |
|---|---|---|---|---|
| Democratic | John B. Kendrick (Incumbent) | 43,032 | 53.50% | |
| Republican | Charles E. Winter | 37,076 | 46.09% | |
| Socialist | W. W. Wolfe | 333 | 0.41% | |
| Majority | 5,956 | 7.41% | ||
| Turnout | 80,441 | |||
| Democratic hold | ||||
See also
References
- September 10, 1928 in Maine
- "SMITH, Frank Leslie – Biographical Information". Bioguide.congress.gov. Retrieved December 27, 2013.
- http://www.ourcampaigns.com/ContainerHistory.html?ContainerID=240
- http://www.ourcampaigns.com/RaceDetail.html?RaceID=3287
- "Statistics of the Congressional Election of November 6, 1928" (PDF). Clerk of the United States House of Representatives. Retrieved July 4, 2014.
- Office of the Secretary of Commonwealth of Massachusetts (1928). Number of assessed polls, registered voters and persons who voted in each voting precinct in the Commonwealth of Massachusetts at the state, city and town elections. p. 375.
- "Statistics of the Congressional and Presidential Election of November 6, 1928" (PDF). Office of the Clerk of the U.S. House. Retrieved July 9, 2014.
- "General Election Results - U.S. Senator - 1914-2014" (PDF). Office of the Vermont Secretary of State. Retrieved June 16, 2015.
- http://clerk.house.gov/member_info/electionInfo/1928election.pdf