United States House of Representatives elections, 1986
|
| ||||||||||||||||||||||||||||||||||
| ||||||||||||||||||||||||||||||||||
All 435 seats to the United States House of Representatives 218 seats were needed for a majority | ||||||||||||||||||||||||||||||||||
|---|---|---|---|---|---|---|---|---|---|---|---|---|---|---|---|---|---|---|---|---|---|---|---|---|---|---|---|---|---|---|---|---|---|---|
| ||||||||||||||||||||||||||||||||||
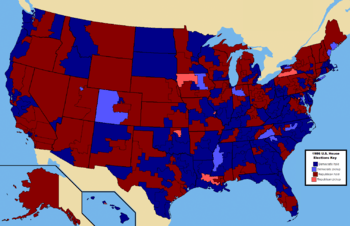 Results:
Democratic hold
Democratic pickup
Republican hold
Republican pickup | ||||||||||||||||||||||||||||||||||
| ||||||||||||||||||||||||||||||||||

The 1986 United States House of Representatives elections was held on November 4, 1986, in the middle of President Ronald Reagan's second term in office while he was still relatively popular with the American public. As in most midterm elections, the President's party—in this case, the Republican Party — lost seats, with the Democratic Party gaining a net of five seats and cementing its majority. These results were not as dramatic as those in the Senate, where the Republicans lost control of the chamber to the Democrats. Notable freshmen include future House Speaker Dennis Hastert (R-IL), future Senators Jon Kyl, Ben Nighthorse Campbell, Jim Bunning, Ben Cardin, Jim Inhofe, and Tim Johnson , former Governor of Maine Joseph E. Brennan, future Secretary of Agriculture Mike Espy, future Administrator of the Small Business Administration Pat Saiki, and former Chairman of the Student Nonviolent Coordinating Committee John Lewis.
Overall results
| 258 | 177 |
| Democratic | Republican |
| Party | Seats | Seat percentage |
Vote percentage |
Popular vote | |||
|---|---|---|---|---|---|---|---|
| Last election (1984) |
This election |
Net change | |||||
| Democratic | 253 | 258 | 59.3% | 54.3% | 32,447,021 | ||
| Republican | 182 | 177 | 40.7% | 44.4% | 26,533,178 | ||
| Independent | 0 | 0 | 0.0% | 0.2% | 157,332 | ||
| Libertarian | 0 | 0 | 0.0% | 0.2% | 121,076 | ||
| Conservative | 0 | 0 | 0.0% | 0.1% | 58,712 | ||
| Peace and Freedom | 0 | 0 | 0.0% | 0.1% | 57,003 | ||
| Right to Life | 0 | 0 | 0.0% | 0.1% | 39,407 | ||
| American | 0 | 0 | 0.0% | <0.1% | 20,360 | ||
| Socialist Workers | 0 | 0 | 0.0% | <0.1% | 12,812 | ||
| Pro-Life | 0 | 0 | 0.0% | <0.1% | 11,209 | ||
| Citizens | 0 | 0 | 0.0% | <0.1% | 8,386 | ||
| Labor for Maine | 0 | 0 | 0.0% | <0.1% | 7,109 | ||
| Small is Beautiful | 0 | 0 | 0.0% | <0.1% | 5,847 | ||
| Workers League | 0 | 0 | 0.0% | <0.1% | 3,985 | ||
| Labor and Farm | 0 | 0 | 0.0% | <0.1% | 3,953 | ||
| New Alliance | 0 | 0 | 0.0% | <0.1% | 3,672 | ||
| People Before Profits | 0 | 0 | 0.0% | <0.1% | 3,646 | ||
| Populist | 0 | 0 | 0.0% | <0.1% | 2,783 | ||
| Concerns of People | 0 | 0 | 0.0% | <0.1% | 2,338 | ||
| Liberal | 0 | 0 | 0.0% | <0.1% | 2,288 | ||
| Inflation Fighting Housewife | 0 | 0 | 0.0% | <0.1% | 2,023 | ||
| AWG | 0 | 0 | 0.0% | <0.1% | 2,004 | ||
| Port Authority = Crooks | 0 | 0 | 0.0% | <0.1% | 1,825 | ||
| Quality Congressional Representation | 0 | 0 | 0.0% | <0.1% | 1,348 | ||
| Stop Financing Communism | 0 | 0 | 0.0% | <0.1% | 789 | ||
| Let Freedom Ring | 0 | 0 | 0.0% | <0.1% | 525 | ||
| Others | 0 | 0 | 0.0% | 0.4% | 251,578 | ||
| Totals | 435 | 435 | 100.0% | 100.0% | 59,758,397 | ||
Source: Election Statistics - Office of the Clerk
[[Image:100 us house membership.png|thumb|400px|
|
[[Image:100 us house changes.png|thumb|400px|
| ||||||||||||||||||
Retiring incumbents
Forty incumbents retired.
Democrats
Nineteen incumbent Democrats retired.
- Alabama's 7th congressional district: Richard Shelby: To run for U.S. Senate
- Colorado's 2nd congressional district: Tim Wirth: To run for U.S. Senate
- Florida's 2nd congressional district: Don Fuqua
- Georgia's 5th congressional district: Wyche Fowler: To run for U.S. Senate
- Iowa's 6th congressional district: Berkley Bedell
- Louisiana's 7th congressional district: John Breaux: To run for U.S. Senate
- Louisiana's 8th congressional district: Catherine Small Long
- Maryland's 3rd congressional district: Barbara Mikulski: To run for U.S. Senate
- Maryland's 7th congressional district: Parren Mitchell
- Maryland's 8th congressional district: Michael D. Barnes: To run for U.S. Senate
- Massachusetts's 8th congressional district: Tip O'Neill
- Nevada's 1st congressional district: Harry Reid: To run for U.S. Senate
- New York 34: Stan Lundine: To Lieutenant Governor
- North Carolina 3: Charles Orville Whitley
- Ohio's 14th congressional district: John F. Seiberling
- Oklahoma's 1st congressional district: James R. Jones: To run for U.S. Senate
- Oregon's 4th congressional district: Jim Weaver: To run for U.S. Senate
- Pennsylvania's 7th congressional district: Robert W. Edgar: To run for U.S. Senate
- South Dakota at-large: Tom Daschle: To run for U.S. Senate
Republicans
Twenty-one incumbent Republicans retired.
- Arizona's 1st congressional district: John McCain: To run for U.S. Senate
- Arizona's 4th congressional district: Eldon Rudd
- California's 2nd congressional district: Eugene A. Chappie
- California's 12th congressional district: Ed Zschau: To run for U.S. Senate
- California's 21st congressional district: Bobbi Fiedler: To run for U.S. Senate
- Colorado's 5th congressional district: Ken Kramer: To run for U.S. Senate
- Illinois's 4th congressional district: George M. O'Brien
- Illinois's 14th congressional district: John E. Grotberg
- Indiana's 5th congressional district: Elwood Hillis
- Iowa's 3rd congressional district: T. Cooper Evans
- Kentucky's 4th congressional district: Gene Snyder
- Louisiana's 6th congressional district: Henson Moore: To run for U.S. Senate
- Maine's 1st congressional district: John R. McKernan Jr.: To run for Governor
- Maryland's 4th congressional district: Marjorie Holt
- New York 1: William Carney
- Ohio's 8th congressional district: Tom Kindness: To run for U.S. Senate
- South Carolina 1: Thomas F. Hartnett: To run for Lieutenant Governor
- South Carolina 4: Carroll A. Campbell Jr.: To run for Governor
- Texas's 21st congressional district: Tom Loeffler: To run for Governor
- Utah's 2nd congressional district: David Smith Monson
- Virginia's 2nd congressional district: G. William Whitehurst
Complete list of states
Key to party abbreviations: AI=American Independent, C=Constitution, D=Democrat, G=Green, I=Independent, IP=Independence Party, L=Libertarian, PF=Peace and Freedom, R=Republican.
Special elections
Sorted by election date, then by state and district if necessary.
| District | Reason for vacancy | Predecessor | Party | Results | Candidates |
|---|---|---|---|---|---|
| New York 6 | Joseph P. Addabbo | Democratic | Incumbent died April 10, 1986. New member elected June 10, 1986. Winner was not renominated in primary for re-election in November, see below. |
Democratic hold | √ Alton R. Waldon Jr. (Democratic) 31% Floyd H. Flake (Unity) 30.3% Richard "Bo" Dietl (R) 21.3% Kevin McCabe (Good Government) 9.1% Andrew Jenkins (Liberal) 8.2 |
| Hawaii 1 | Cec Heftel | Democratic | Incumbent resigned July 11, 1986 to campaign for Governor of Hawaii. New member elected September 20, 1986. Winner was not renominated in primary for re-election in November, see below. |
Democratic hold | √ Neil Abercrombie (Democratic) 29.9% Pat Saiki (Republican) 29.2% Mufi Hannemann (Democratic) 28.3% Steve Cobb (Democratic) 11.9% Louis Agard (Democratic) 0.4% Blase Harris (Nonpartisan) 0.3% |
General elections
Alabama
| District | Incumbent | Party | First elected |
Result | Candidates |
|---|---|---|---|---|---|
| Alabama 1 | Sonny Callahan | Republican | 1984 | Incumbent re-elected. | √ Sonny Callahan (Republican) Unopposed |
| Alabama 2 | William Louis Dickinson | Republican | 1964 | Incumbent re-elected. | √ William Louis Dickinson (Republican) 66.7% Mercer Stone (Democratic) 33.3% |
| Alabama 3 | William Flynt Nichols | Democratic | 1966 | Incumbent re-elected. | √ William Flynt Nichols (Democratic) 80.6% Whit Guerin (Libertarian) 19.4% |
| Alabama 4 | Tom Bevill | Democratic | 1966 | Incumbent re-elected. | √ Tom Bevill (Democratic) 77.5% Al DeShazo (Republican) 22.5% |
| Alabama 5 | Ronnie Flippo | Democratic | 1976 | Incumbent re-elected. | √ Ronnie Flippo (Democratic) 78.9% Herb McCarley (Libertarian) 21.1% |
| Alabama 6 | Ben Erdreich | Democratic | 1982 | Incumbent re-elected. | √ Ben Erdreich (Democratic) 72.7% L. Morgan Williams (Republican) 27.0% Martin J. Boyers (Socialist Workers) 0.2% |
| Alabama 7 | Richard Shelby | Democratic | 1978 | Incumnent retired to run for U.S. Senator. New member elected. Democratic hold. |
√ Claude Harris Jr. (Democratic) 59.8% Bill McFarland (Republican) 40.2% |
Alaska
| District | Incumbent | Party | First elected |
Result | Candidates |
|---|---|---|---|---|---|
| Alaska at-large | Don Young | Republican | 1973 | Incumbent re-elected. | √ Don Young (Republican) 56.5% Pegge Begich (Democratic) 41.1% Betty Breck (Libertarian) 2.3% |
Arizona
| District | Incumbent | Party | First elected |
Result | Candidates |
|---|---|---|---|---|---|
| Arizona 1 | John McCain | Republican | 1982 | Retired to run for U. S. senate New member elected. Republican hold. |
√ John Jacob Rhodes III (Republican) 71.3% Harry W. Braun III (Democratic) 28.7% |
| Arizona 2 | Mo Udall | Democratic | 1961 | Incumbent re-elected. | √ Mo Udall (Democratic) 73.3% Sheldon Clark (Republican) 23.3% Lorenzo Torrez (Independent) 3.5% |
| Arizona 3 | Bob Stump | Republican | 1976 | Incumbent re-elected. | √ Bob Stump (Republican) Unopposed |
| Arizona 4 | Eldon Rudd | Republican | 1976 | Incumbent retired. New member elected. Republican hold. |
√ Jon Kyl (Republican) 64.6% Philip R. Davis (Democratic) 35.4% |
| Arizona 5 | Jim Kolbe | Republican | 1984 | Incumbent re-elected. | √ Jim Kolbe (Republican) 64.9% Joel Ireland (Democratic) 35.1% |
Arkansas
| District | Incumbent | Party | First elected |
Result | Candidates |
|---|---|---|---|---|---|
| Arkansas 1 | William Vollie Alexander Jr. | Democratic | 1968 | Incumbent re-elected. | √ William Vollie Alexander Jr. (Democratic) 64.2% Rick H. Albin (Republican) 35.8% |
| Arkansas 2 | Tommy F. Robinson | Democratic | 1984 | Incumbent re-elected. | √ Tommy F. Robinson (Democratic) 75.7% Keith Hamaker (Republican) 24.2% Elton White (W/I) 0.05% |
| Arkansas 3 | John P. Hammerschmidt | Republican | 1966 | Incumbent re-elected. | √ John P. Hammerschmidt (Republican) 79.8% Su Sargent (Democratic) 20.2% |
| Arkansas 4 | Beryl Anthony Jr. | Democratic | 1978 | Incumbent re-elected. | √ Beryl Anthony Jr. (Democratic) 77.4% Lamar Keels (Republican) 15.4% Stephen A. Bitely (Independent) 7.1% |
California
| District | Incumbent | Party | First elected |
Result | Candidates |
|---|---|---|---|---|---|
| California 1 | Douglas H. Bosco | Democratic | 1982 | Incumbent re-elected. | √ Douglas H. Bosco (Democratic) 67.5% Floyd G. Sampson (Republican) 26.6% Elden McFarland (Peace and Freedom) 5.9% |
| California 2 | Eugene A. Chappie | Republican | 1980 | Incumbent retired. New member elected. Republican hold. |
√ Wally Herger (Republican) 58.3% Stephen C. "Steve" Swendiman (Democratic) 39.6% Harry Hugh "Doc" Pendery (Libertarian) 2.2% |
| California 3 | Bob Matsui | Democratic | 1978 | Incumbent re-elected. | √ Bob Matsui (Democratic) 75.9% Lowell Patrick Landowski (Republican) 24.1% |
| California 4 | Victor H. Fazio | Democratic | 1978 | Incumbent re-elected. | √ Victor H. Fazio (Democratic) 70.2% Jack D. Hite (Republican) 29.8% |
| California 5 | Sala Burton | Democratic | 1983 | Incumbent re-elected. | √ Sala Burton (Democratic) 75.2% Mike Garza (Republican) 22.1% Samuel K. "Sam" Grove (Libertarian) 1.5% Theodore Adrian "Ted" Zuur (Peace and Freedom) 1.3% |
| California 6 | Barbara Boxer | Democratic | 1982 | Incumbent re-elected. | √ Barbara Boxer (Democratic) 73.9% Franklin "Harry" Ernst III (Republican) 26.1% |
| California 7 | George Miller | Democratic | 1974 | Incumbent re-elected. | √ George Miller (Democratic) 66.6% Rosemary Thakar (Republican) 33.4% |
| California 8 | Ron Dellums | Democratic | 1970 | Incumbent re-elected. | √ Ron Dellums (Democratic) 60.0% Steven Eigenberg (Republican) 37.9% Lawrence R. Manuel (Peace and Freedom) 2.1% |
| California 9 | Pete Stark | Democratic | 1972 | Incumbent re-elected. | √ Pete Stark (Democratic) 69.7% David M. "Dave" Williams (Republican) 30.3% |
| California 10 | Don Edwards | Democratic | 1962 | Incumbent re-elected. | √ Don Edwards (Democratic) 70.5% Michael R. La Crone (Republican) 26.6% Perr Cardestam (Libertarian) 1.5% Bradley L. Mayer (Peace and Freedom) 1.4% |
| California 11 | Tom Lantos | Democratic | 1980 | Incumbent re-elected. | √ Tom Lantos (Democratic) 74.1% G. M. "Bill" Quraishi (Republican) 25.9% |
| California 12 | Ed Zschau | Republican | 1982 | Incumnent retired to run for U.S. Senator. New member elected. Republican hold. |
√ Ernie Konnyu (Republican) 59.5% Lance T. Weil (Democratic) 37.2% William C. "Bill" White (Libertarian) 3.4% |
| California 13 | Norman Mineta | Democratic | 1974 | Incumbent re-elected. | √ Norman Mineta (Democratic) 69.7% Bob Nash (Republican) 30.3% |
| California 14 | Norman D. Shumway | Republican | 1978 | Incumbent re-elected. | √ Norman D. Shumway (Republican) 71.6% Bill Steele (Democratic) 26.1% Bruce A. Daniel (Libertarian) 2.3% |
| California 15 | Tony Coelho | Democratic | 1978 | Incumbent re-elected. | √ Tony Coelho (Democratic) 71.0% Carol Harner (Republican) 27.2% Richard M. Harris (Libertarian) 1.8% |
| California 16 | Leon Panetta | Democratic | 1976 | Incumbent re-elected. | √ Leon Panetta (Democratic) 78.4% Louis Darrigo (Republican) 19.2% Ron Wright (Peace and Freedom) 1.2% Bill Anderson (Libertarian) 1.2% |
| California 17 | Chip Pashayan | Republican | 1978 | Incumbent re-elected. | √ Chip Pashayan (Republican) 60.2% John Hartnett (Democratic) 39.8% |
| California 18 | Richard H. Lehman | Democratic | 1982 | Incumbent re-elected. | √ Richard H. Lehman (Democratic) 71.3% David C. Crevelt (Republican) 28.7% |
| California 19 | Robert J. Lagomarsino | Republican | 1974 | Incumbent re-elected. | √ Robert J. Lagomarsino (Republican) 71.9% Wayne B. Norris (Democratic) 26.8% George Hasara (Libertarian) 1.4% |
| California 20 | Bill Thomas | Republican | 1978 | Incumbent re-elected. | √ Bill Thomas (Republican) 72.6% Jules H. Moquin (Democratic) 27.4% |
| California 21 | Bobbi Fiedler | Republican | 1980 | Incumnent retired to run for U.S. Senator. New member elected. Republican hold. |
√ Elton Gallegly (Republican) 68.4% Gilbert R. Saldana (Democratic) 28.2% Daniel Wiener (Libertarian) 3.4% |
| California 22 | Carlos Moorhead | Republican | 1972 | Incumbent re-elected. | √ Carlos Moorhead (Republican) 73.8% John G. Simmons (Democratic) 23.0% Jona Joy Bergland (Libertarian) 1.6% Joel Lorimer (Peace and Freedom) 1.5% |
| California 23 | Anthony C. Beilenson | Democratic | 1976 | Incumbent re-elected. | √ Anthony C. Beilenson (Democratic) 65.7% George Woolverton (Republican) 31.8% Tom Hopke (Peace and Freedom) 1.4% Taylor Rhodes (Libertarian) 1.1% |
| California 24 | Henry Waxman | Democratic | 1974 | Incumbent re-elected. | √ Henry Waxman (Democratic) 87.9% George Abrahams (Libertarian) 7.5% James Green (Peace and Freedom) 4.6% |
| California 25 | Edward R. Roybal | Democratic | 1962 | Incumbent re-elected. | √ Edward R. Roybal (Democratic) 76.1% Gregory L. Hardy (Republican) 21.3% Ted Brown (Libertarian) 2.6% |
| California 26 | Howard Berman | Democratic | 1982 | Incumbent re-elected. | √ Howard Berman (Democratic) 65.1% Robert M. Kerns (Republican) 34.9% |
| California 27 | Mel Levine | Democratic | 1982 | Incumbent re-elected. | √ Mel Levine (Democratic) 63.7% Robert B. Scribner (Republican) 34.3% Thomas L. O'Connor Jr. (Peace and Freedom) 1.2% Jeff Avrech (Libertarian) 0.8% |
| California 28 | Julian C. Dixon | Democratic | 1978 | Incumbent re-elected. | √ Julian C. Dixon (Democratic) 76.3% George Zaldivar Adams (Republican) 21.3% Howard Johnson (Libertarian) 2.3% |
| California 29 | Augustus F. Hawkins | Democratic | 1962 | Incumbent re-elected. | √ Augustus F. Hawkins (Democratic) 84.5% John Van de Brooke (Republican) 14.5% Waheed R. Boctor (Libertarian) 0.9% |
| California 30 | Matthew G. Martinez | Democratic | 1982 | Incumbent re-elected. | √ Matthew G. Martinez (Democratic) 62.5% John W. Almquist (Republican) 35.5% Kim J. Goldsworthy (Libertarian) 2.0% |
| California 31 | Mervyn M. Dymally | Democratic | 1980 | Incumbent re-elected. | √ Mervyn M. Dymally (Democratic) 70.3% Jack McMurray (Republican) 27.6% B. Kwaku Duren (Peace and Freedom) 2.1% |
| California 32 | Glenn M. Anderson | Democratic | 1968 | Incumbent re-elected. | √ Glenn M. Anderson (Democratic) 68.5% Joyce M. Robertson (Republican) 29.4% John S. Donohue (Peace and Freedom) 2.1% |
| California 33 | David Dreier | Republican | 1980 | Incumbent re-elected. | √ David Dreier (Republican) 71.7% Monty Hempel (Democratic) 26.8% James Michael "Mike" Noonan (Peace and Freedom) 1.5% |
| California 34 | Esteban Edward Torres | Democratic | 1982 | Incumbent re-elected. | √ Esteban Edward Torres (Democratic) 60.3% Charles M. House (Republican) 39.7% |
| California 35 | Jerry Lewis | Republican | 1978 | Incumbent re-elected. | √ Jerry Lewis (Republican) 76.9% Robert J. "Sarge" Hall (Democratic) 23.1% |
| California 36 | George Brown Jr. | Democratic | 1972 | Incumbent re-elected. | √ George Brown Jr. (Democratic) 57.1% Robert L. "Bob" Henley (Republican) 42.9% |
| California 37 | Al McCandless | Republican | 1982 | Incumbent re-elected. | √ Al McCandless (Republican) 63.7% David E. "Dave" Skinner (Democratic) 36.3% |
| California 38 | Bob Dornan | Republican | 1984 | Incumbent re-elected. | √ Bob Dornan (Republican) 55.3% Richard H. Robinson (Democratic) 42.4% Lee Connelly (Libertarian) 2.3% |
| California 39 | William E. Dannemeyer | Republican | 1978 | Incumbent re-elected. | √ William E. Dannemeyer (Republican) 74.5% David D. Vest (Democratic) 24.0% Frank Boeheim (Peace and Freedom) 1.6% |
| California 40 | Robert Badham | Republican | 1976 | Incumbent re-elected. | √ Robert Badham (Republican) 59.8% Bruce W. Sumner (Democratic) 37.7% Steve Sears (Peace and Freedom) 2.5% |
| California 41 | Bill Lowery | Republican | 1980 | Incumbent re-elected. | √ Bill Lowery (Republican) 67.8% Daniel F. "Dan" Kripke (Democratic) 30.4% Richard "Dick" Rider (Libertarian) 1.8% |
| California 42 | Dan Lungren | Republican | 1978 | Incumbent re-elected. | √ Dan Lungren (Republican) 72.8% Michael P. Blackburn (Democratic) 24.7% Kate McClatchy (Peace and Freedom) 2.5% |
| California 43 | Ron Packard | Republican | 1982 | Incumbent re-elected. | √ Ron Packard (Republican) 73.1% Joseph Chirra (Democratic) 24.0% Phyllis Avery (Libertarian) 2.9% |
| California 44 | Jim Bates | Democratic | 1982 | Incumbent re-elected. | √ Jim Bates (Democratic) 64.2% Bill Mitchell (Republican) 33.1% Shirley Rachel Isaacson (Peace and Freedom) 1.5% Dennis Thompson (Libertarian) 1.1% |
| California 45 | Duncan Hunter | Republican | 1980 | Incumbent re-elected. | √ Duncan Hunter (Republican) 76.9% Hewitt Fitts Ryan (Democratic) 21.2% Lee Schwartz (Libertarian) 1.9% |
Colorado
| District | Incumbent | Party | First elected |
Result | Candidates |
|---|---|---|---|---|---|
| Colorado 1 | Patricia Schroeder | Democratic | 1972 | Incumbent re-elected. | √ Patricia Schroeder (Democratic) 68.4% Joy Wood (Republican) 31.6% |
| Colorado 2 | Tim Wirth | Democratic | 1974 | Incumnent retired to run for U.S. Senator. New member elected. Democratic hold. |
√ David Skaggs (Democratic) 51.5% Mike Norton (Republican) 48.5% |
| Colorado 3 | Michael L. Strang | Republican | 1984 | Incumbent lost re-election. New member elected. Democratic gain. |
√ Ben Nighthorse Campbell (Democratic) 51.9% Michael L. Strang (Republican) 48.1% |
| Colorado 4 | Hank Brown | Republican | 1980 | Incumbent re-elected. | √ Hank Brown (Republican) 69.8% David Sprague (Democratic) 30.2% |
| Colorado 5 | Ken Kramer | Republican | 1978 | Incumnent retired to run for U.S. Senator. New member elected. Republican hold. |
√ Joel Hefley (Republican) 69.8% Bill Story (Democratic) 30.2% |
| Colorado 6 | Daniel Schaefer | Republican | 1983 | Incumbent re-elected. | √ Daniel Schaefer (Republican) 65.0% Chuck Norris (Democratic) 33.5% John Heckman (Independent) 1.5% |
Connecticut
| District | Incumbent | Party | First elected |
Result | Candidates |
|---|---|---|---|---|---|
| Connecticut 1 | Barbara B. Kennelly | Democratic | 1982 | Incumbent re-elected. | √ Barbara B. Kennelly (Democratic) 74.2% Herschel A. Klein (Republican) 25.4% Sally F. Cadmus (Independent) 0.4% |
| Connecticut 2 | Sam Gejdenson | Democratic | 1980 | Incumbent re-elected. | √ Sam Gejdenson (Democratic) 67.4% Bud Mullen (Republican) 32.6% |
| Connecticut 3 | Bruce A. Morrison | Democratic | 1982 | Incumbent re-elected. | √ Bruce A. Morrison (Democratic) 69.6% Ernest J. Diette Jr. (Republican) 30.4% |
| Connecticut 4 | Stewart McKinney | Republican | 1970 | Incumbent re-elected. | √ Stewart McKinney (Republican) 53.5% Christine M. Niedermeier (Democratic) 46.5% |
| Connecticut 5 | John G. Rowland | Republican | 1984 | Incumbent re-elected. | √ John G. Rowland (Republican) 60.9% Jim Cohen (Democratic) 39.1% |
| Connecticut 6 | Nancy Johnson | Republican | 1982 | Incumbent re-elected. | √ Nancy Johnson (Republican) 64.2% Paul S. Amenta (Democratic) 35.8% |
Delaware
| District | Incumbent | Party | First elected |
Result | Candidates |
|---|---|---|---|---|---|
| Delaware at-large | Thomas R. Carper | Democratic | 1982 | Incumbent re-elected. | √ Thomas R. Carper (Democratic) 66.2% Thomas S. Neuberger (Republican) 33.4% Patrick F. Harrison (American) 0.4% |
Florida
| District | Incumbent | Party | First elected |
Result | Candidates |
|---|---|---|---|---|---|
| Florida 1 | Earl Hutto | Democratic | 1978 | Incumbent re-elected. | √ Earl Hutto (Democratic) 63.8% Greg Neubeck (Republican) 36.2% |
| Florida 2 | Don Fuqua | Democratic | 1962 | Incumbent retired. New member elected. Democratic hold. |
√ James W. Grant (Democratic) Unopposed |
| Florida 3 | Charles Edward Bennett | Democratic | 1948 | Incumbent re-elected. | √ Charles Edward Bennett (Democratic) Unopposed |
| Florida 4 | Bill Chappell | Democratic | 1968 | Incumbent re-elected. | √ Bill Chappell (Democratic) Unopposed |
| Florida 5 | Bill McCollum | Republican | 1980 | Incumbent re-elected. | √ Bill McCollum (Republican) Unopposed |
| Florida 6 | Buddy MacKay | Democratic | 1982 | Incumbent re-elected. | √ Buddy MacKay (Democratic) 70.2% Larry Gallagher (Republican) 29.8% |
| Florida 7 | Sam M. Gibbons | Democratic | 1962 | Incumbent re-elected. | √ Sam M. Gibbons (Democratic) Unopposed |
| Florida 8 | Bill Young | Republican | 1970 | Incumbent re-elected. | √ Bill Young (Republican) Unopposed |
| Florida 9 | Michael Bilirakis | Republican | 1982 | Incumbent re-elected. | √ Michael Bilirakis (Republican) 70.8% Gabe Cazares (Democratic) 29.2% |
| Florida 10 | Andy Ireland | Republican | 1976 | Incumbent re-elected. | √ Andy Ireland (Republican) 71.2% David B. Higginbottom (Democratic) 28.8% |
| Florida 11 | Bill Nelson | Democratic | 1978 | Incumbent re-elected. | √ Bill Nelson (Democratic) 72.7% Scott Ellis (Republican) 27.3% |
| Florida 12 | Tom Lewis | Republican | 1982 | Incumbent re-elected. | √ Tom Lewis (Republican) Unopposed |
| Florida 13 | Connie Mack III | Republican | 1982 | Incumbent re-elected. | √ Connie Mack III (Republican) 75.0% Addison S. Gilbert III (Democratic) 25.0% |
| Florida 14 | Dan Mica | Democratic | 1978 | Incumbent re-elected. | √ Dan Mica (Democratic) 73.8% Rick Martin (Republican) 26.2% |
| Florida 15 | Clay Shaw | Republican | 1980 | Incumbent re-elected. | √ Clay Shaw (Republican) Unopposed |
| Florida 16 | Lawrence J. Smith | Democratic | 1982 | Incumbent re-elected. | √ Lawrence J. Smith (Democratic) 69.7% Mary Collins (Republican) 30.3% |
| Florida 17 | William Lehman | Democratic | 1972 | Incumbent re-elected. | √ William Lehman (Democratic) Unopposed |
| Florida 18 | Claude Pepper | Democratic | 1962 | Incumbent re-elected. | √ Claude Pepper (Democratic) 73.5% Tom Brodie (Republican) 26.5% |
| Florida 19 | Dante Fascell | Democratic | 1954 | Incumbent re-elected. | √ Dante Fascell (Democratic) 69.1% Bill Flanagan (Republican) 30.9% |
Georgia
| District | Incumbent | Party | First elected |
Result | Candidates |
|---|---|---|---|---|---|
| Georgia 1 | Lindsay Thomas | Democratic | 1982 | Incumbent re-elected. | √ Lindsay Thomas (Democratic) Unopposed |
| Georgia 2 | Charles Floyd Hatcher | Democratic | 1980 | Incumbent re-elected. | √ Charles Floyd Hatcher (Democratic) Unopposed |
| Georgia 3 | Richard Ray | Democratic | 1982 | Incumbent re-elected. | √ Richard Ray (Democratic) Unopposed |
| Georgia 4 | Pat Swindall | Republican | 1984 | Incumbent re-elected. | √ Pat Swindall (Republican) 53.2% Ben Jones (Democratic) 46.8% |
| Georgia 5 | Wyche Fowler | Democratic | 1977 | Incumnent retired to run for U.S. Senator. New member elected. Democratic hold. |
√ John Lewis (Democratic) 75.3% Portia A. Scott (Republican) 24.7% |
| Georgia 6 | Newt Gingrich | Republican | 1978 | Incumbent re-elected. | √ Newt Gingrich (Republican) 59.5% Crandle Bray (Democratic) 40.5% |
| Georgia 7 | George Darden | Democratic | 1983 | Incumbent re-elected. | √ George Darden (Democratic) 66.4% Joe Morecraft (Republican) 33.6% |
| Georgia 8 | J. Roy Rowland | Democratic | 1982 | Incumbent re-elected. | √ J. Roy Rowland (Democratic) 86.4% Eddie McDowell (Republican) 13.6% |
| Georgia 9 | Ed Jenkins | Democratic | 1976 | Incumbent re-elected. | √ Ed Jenkins (Democratic) Unopposed |
| Georgia 10 | Doug Barnard Jr. | Democratic | 1976 | Incumbent re-elected. | √ Doug Barnard Jr. (Democratic) 67.3% Jim Hill (Republican) 32.7% |
Hawaii
| District | Incumbent | Party | First elected |
Result | Candidates |
|---|---|---|---|---|---|
| Hawaii 1 | Neil Abercrombie | Democratic | 1986 | Lost renomination New member elected. Republican gain. |
√ Pat Saiki (Republican) 59.2% Mufi Hannemann (Democratic) 37.5% Blase Harris (Libertarian) 3.3% |
| Hawaii 2 | Daniel Akaka | Democratic | 1976 | Incumbent re-elected. | √ Daniel Akaka (Democratic) 76.1% Maria M. Hustace (Republican) 21.7% Ken Schoolland (Libertarian) 2.2% |
Idaho
| District | Incumbent | Party | First elected |
Result | Candidates |
|---|---|---|---|---|---|
| Idaho 1 | Larry Craig | Republican | 1980 | Incumbent re-elected. | √ Larry Craig (Republican) 65.1% Bill Currie (Democratic) 32.3% David W. Shepherd (Independent) 2.6% |
| Idaho 2 | Richard H. Stallings | Democratic | 1984 | Incumbent re-elected. | √ Richard H. Stallings (Democratic) 54.4% Mel Richardson (Republican) 45.6% |
Illinois
| District | Incumbent | Party | First elected |
Result | Candidates |
|---|---|---|---|---|---|
| Illinois 1 | Charles Hayes | Democratic | 1983 | Incumbent re-elected. | √ Charles Hayes (Democratic) 96.4% Joseph C. Faulkner (Republican) 3.6% |
| Illinois 2 | Gus Savage | Democratic | 1980 | Incumbent re-elected. | √ Gus Savage (Democratic) 83.8% Ron Taylor (Republican) 16.2% |
| Illinois 3 | Marty Russo | Democratic | 1974 | Incumbent re-elected. | √ Marty Russo (Democratic) 66.2% James J. Tierney (Republican) 33.8% |
| Illinois 4 | George M. O'Brien | Republican | 1972 | Incumbent retired. New member elected. Republican hold. |
√ Jack Davis (Republican) 51.6% Shawn Collins (Democratic) 48.4% |
| Illinois 5 | Bill Lipinski | Democratic | 1982 | Incumbent re-elected. | √ Bill Lipinski (Democratic) 70.4% Daniel John Sobieski (Republican) 29.6% |
| Illinois 6 | Henry Hyde | Republican | 1974 | Incumbent re-elected. | √ Henry Hyde (Republican) 75.4% Robert H. Renshaw (Democratic) 24.6% |
| Illinois 7 | Cardiss Collins | Democratic | 1973 | Incumbent re-elected. | √ Cardiss Collins (Democratic) 80.2% Caroline K. Kallas (Republican) 18.6% Jerald Wilson (Independent) 1.2% |
| Illinois 8 | Dan Rostenkowski | Democratic | 1958 | Incumbent re-elected. | √ Dan Rostenkowski (Democratic) 78.7% Thomas J. DeFazio (Republican) 21.3% |
| Illinois 9 | Sidney R. Yates | Democratic | 1964 | Incumbent re-elected. | √ Sidney R. Yates (Democratic) 71.6% Herbert Sohn (Republican) 28.4% |
| Illinois 10 | John E. Porter | Republican | 1980 | Incumbent re-elected. | √ John E. Porter (Republican) 75.1% Robert A. Cleland (Democratic) 24.9% |
| Illinois 11 | Frank Annunzio | Democratic | 1964 | Incumbent re-elected. | √ Frank Annunzio (Democratic) 70.7% George S. Gottlieb (Republican) 29.3% |
| Illinois 12 | Phil Crane | Republican | 1969 | Incumbent re-elected. | √ Phil Crane (Republican) 77.7% John A. Leonardi (Democratic) 22.3% |
| Illinois 13 | Harris W. Fawell | Republican | 1984 | Incumbent re-elected. | √ Harris W. Fawell (Republican) 73.4% Dominick J. Jeffrey (Democratic) 26.6% |
| Illinois 14 | John E. Grotberg | Republican | 1984 | Incumbent retired. New member elected. Republican hold. |
√ Dennis Hastert (Republican) 52.4% Mary Lou Kearns (Democratic) 47.6% |
| Illinois 15 | Edward Rell Madigan | Republican | 1972 | Incumbent re-elected. | √ Edward Rell Madigan (Republican) Unopposed |
| Illinois 16 | Lynn Morley Martin | Republican | 1980 | Incumbent re-elected. | √ Lynn Morley Martin (Republican) 66.9% Kenneth F. Bohnsack (Democratic) 33.1% |
| Illinois 17 | Lane Evans | Democratic | 1982 | Incumbent re-elected. | √ Lane Evans (Democratic) 55.6% Sam McHard (Republican) 44.4% |
| Illinois 18 | Robert H. Michel | Republican | 1956 | Incumbent re-elected. | √ Robert H. Michel (Republican) 62.6% Jim Dawson (Democratic) 37.4% |
| Illinois 19 | Terry L. Bruce | Democratic | 1984 | Incumbent re-elected. | √ Terry L. Bruce (Democratic) 66.4% Al Salvi (Republican) 33.6% |
| Illinois 20 | Dick Durbin | Democratic | 1982 | Incumbent re-elected. | √ Dick Durbin (Democratic) 68.1% Kevin B. McCarthy (Republican) 31.9% |
| Illinois 21 | Melvin Price | Democratic | 1944 | Incumbent re-elected. | √ Melvin Price (Democratic) 50.4% Robert H. Gaffner (Republican) 49.6% |
| Illinois 22 | Kenneth J. Gray | Democratic | 1984 | Incumbent re-elected. | √ Kenneth J. Gray (Democratic) 53.2% Randy Patchett (Republican) 46.8% |
Indiana
| District | Incumbent | Party | First elected |
Result | Candidates |
|---|---|---|---|---|---|
| Indiana 1 | Pete Visclosky | Democratic | 1984 | Incumbent re-elected. | √ Pete Visclosky (Democratic) 73.3% William Costas (Republican) 25.6% James E. Willis (Libertarian) 0.7% Tracy E. Kyle (Workers) 0.3% |
| Indiana 2 | Philip R. Sharp | Democratic | 1974 | Incumbent re-elected. | √ Philip R. Sharp (Democratic) 61.9% Donald J. Lynch (Republican) 37.4% Richard W. Smith (Libertarian) 0.7% |
| Indiana 3 | John P. Hiler | Republican | 1980 | Incumbent re-elected. | √ John P. Hiler (Republican) 49.8% Thomas W. Ward (Democratic) 49.8% Kenneth Keene Donnelly (Libertarian) 0.4% |
| Indiana 4 | Dan Coats | Republican | 1980 | Incumbent re-elected. | √ Dan Coats (Republican) 69.6% Gregory Alan Scher (Democratic) 30.0% Stephen L. Dasbach (Libertarian) 0.4% |
| Indiana 5 | Elwood Hillis | Republican | 1970 | Incumbent retired. New member elected. Democratic gain. |
√ Jim Jontz (Democratic) 51.4% James R. Butcher (Republican) 48.1% Brent Waibel (Libertarian) 0.5% |
| Indiana 6 | Dan Burton | Republican | 1982 | Incumbent re-elected. | √ Dan Burton (Republican) 68.4% Thomas F. McKenna (Democratic) 30.9% Pamela J. Webe (Libertarian) 0.8% |
| Indiana 7 | John T. Myers | Republican | 1966 | Incumbent re-elected. | √ John T. Myers (Republican) 66.8% L. Eugene Smith (Democratic) 31.6% Barbara J. Bourland (Libertarian) 1.6% |
| Indiana 8 | Frank McCloskey | Democratic | 1982 | Incumbent re-elected. | √ Frank McCloskey (Democratic) 53.0% Richard D. McIntyre (Republican) 46.5% Marilyn K. Stone (Libertarian) 0.5% |
| Indiana 9 | Lee H. Hamilton | Democratic | 1964 | Incumbent re-elected. | √ Lee H. Hamilton (Democratic) 71.9% Robert Walter Kilroy (Republican) 27.7% Douglas S. Boggs (Libertarian) 0.4% |
| Indiana 10 | Andrew Jacobs Jr. | Democratic | 1974 | Incumbent re-elected. | √ Andrew Jacobs Jr. (Democratic) 57.7% Jim Eynon (Republican) 41.2% Frederick C. Peterson (Libertarian) 1.1% |
Iowa
| District | Incumbent | Party | First elected |
Result | Candidates |
|---|---|---|---|---|---|
| Iowa 1 | Jim Leach | Republican | 1976 | Incumbent re-elected. | √ Jim Leach (Republican) 66.4% John R. Whitaker (Democratic) 33.6% |
| Iowa 2 | Tom Tauke | Republican | 1978 | Incumbent re-elected. | √ Tom Tauke (Republican) 61.3% Eric Tabor (Democratic) 38.7% |
| Iowa 3 | T. Cooper Evans | Republican | 1980 | Incumbent retired. New member elected. Democratic gain. |
√ David R. Nagle (Democratic) 54.6% John McIntee (Republican) 45.4% |
| Iowa 4 | Neal Edward Smith | Democratic | 1958 | Incumbent re-elected. | √ Neal Edward Smith (Democratic) 68.4% Robert R. Lockard (Republican) 31.6% |
| Iowa 5 | Jim Ross Lightfoot | Republican | 1984 | Incumbent re-elected. | √ Jim Ross Lightfoot (Republican) 59.2% Scott Hughes (Democratic) 40.8% |
| Iowa 6 | Berkley Bedell | Democratic | 1974 | Incumbent retired. New member elected. Republican gain. |
√ Fred Grandy (Republican) 51.0% Clayton Hodgson (Democratic) 49.0% |
Kansas
| District | Incumbent | Party | First elected |
Result | Candidates |
|---|---|---|---|---|---|
| Kansas 1 | Pat Roberts | Republican | 1980 | Incumbent re-elected. | √ Pat Roberts (Republican) 76.5% Dale Lyon (Democratic) 23.5% |
| Kansas 2 | Jim Slattery | Democratic | 1982 | Incumbent re-elected. | √ Jim Slattery (Democratic) 70.6% Phill Kline (Republican) 29.4% |
| Kansas 3 | Jan Meyers | Republican | 1984 | Incumbent re-elected. | √ Jan Meyers (Republican) Unopposed |
| Kansas 4 | Dan Glickman | Democratic | 1976 | Incumbent re-elected. | √ Dan Glickman (Democratic) 64.5% Bob Knight (Republican) 35.5% |
| Kansas 5 | Bob Whittaker | Republican | 1978 | Incumbent re-elected. | √ Bob Whittaker (Republican) 71.1% Kim E. Myers (Democratic) 28.9% |
Kentucky
| District | Incumbent | Party | First elected |
Result | Candidates |
|---|---|---|---|---|---|
| Kentucky 1 | Carroll Hubbard | Democratic | 1974 | Incumbent re-elected. | √ Carroll Hubbard (Democratic) Unopposed |
| Kentucky 2 | William Huston Natcher | Democratic | 1953 | Incumbent re-elected. | √ William Huston Natcher (Democratic) Unopposed |
| Kentucky 3 | Romano L. Mazzoli | Democratic | 1970 | Incumbent re-elected. | √ Romano L. Mazzoli (Democratic) 73.0% Lee Holmes (Republican) 26.2% Estelle DeBates (Socialist Workers) 0.8% |
| Kentucky 4 | Gene Snyder | Republican | 1966 | Incumbent retired. New member elected. Republican hold. |
√ Jim Bunning (Republican) 55.1% Terry L. Mann (Democratic) 43.9% Walter T. Marksberry (Independent) 0.6% W. Ed Parker (American) 0.4% |
| Kentucky 5 | Hal Rogers | Republican | 1980 | Incumbent re-elected. | √ Hal Rogers (Republican) Unopposed |
| Kentucky 6 | Larry J. Hopkins | Republican | 1978 | Incumbent re-elected. | √ Larry J. Hopkins (Republican) 74.3% Jerry Hammond (Democratic) 25.7% |
| Kentucky 7 | Carl C. Perkins | Democratic | 1984 | Incumbent re-elected. | √ Carl C. Perkins (Democratic) 79.6% James T. Polley (Republican) 20.4% |
Louisiana
| District | Incumbent | Party | First elected |
Result | Candidates |
|---|---|---|---|---|---|
| Louisiana 1 | Bob Livingston | Republican | 1977 | Incumbent re-elected. | √ Bob Livingston (Republican) Unopposed |
| Louisiana 2 | Lindy Boggs | Democratic | 1973 | Incumbent re-elected. | √ Lindy Boggs (Democratic) Unopposed |
| Louisiana 3 | Billy Tauzin | Democratic | 1980 | Incumbent re-elected. | √ Billy Tauzin (Democratic) Unopposed |
| Louisiana 4 | Buddy Roemer | Democratic | 1980 | Incumbent re-elected. | √ Buddy Roemer (Democratic) Unopposed |
| Louisiana 5 | Jerry Huckaby | Democratic | 1976 | Incumbent re-elected. | √ Jerry Huckaby (Democratic) Unopposed |
| Louisiana 6 | Henson Moore | Republican | 1974 | Incumnent retired to run for U.S. Senator. New member elected. Republican hold. |
√ Richard Baker (Republican) Unopposed |
| Louisiana 7 | John Breaux | Democratic | 1972 | Incumnent retired to run for U.S. Senator. New member elected. Democratic hold. |
√ Jimmy Hayes (Democratic) 57.0% Margaret Lowenthal (Democratic) 43.0% |
| Louisiana 8 | Catherine Small Long | Democratic | 1985 | Incumbent retired. New member elected. Republican gain. |
√ Clyde C. Holloway (Republican) 51.4% Faye Williams (Democratic) 48.6% |
Maine
| District | Incumbent | Party | First elected |
Result | Candidates |
|---|---|---|---|---|---|
| Maine 1 | John R. McKernan Jr. | Republican | 1982 | Retired to run for run for Governor of Maine. New member elected. Democratic gain. |
√ Joseph E. Brennan (Democratic) 53.2% H. Rollin Ives (Republican) 43.7% Plato Truman (Lab) 3.1% |
| Maine 2 | Olympia Snowe | Republican | 1978 | Incumbent re-elected. | √ Olympia Snowe (Republican) 77.3% Richard R. Charette (Democratic) 22.7% |
Maryland
| District | Incumbent | Party | First elected |
Result | Candidates |
|---|---|---|---|---|---|
| Maryland 1 | Roy Dyson | Democratic | 1980 | Incumbent re-elected. | √ Roy Dyson (Democratic) 66.8% Harlan C. Williams (Republican) 33.2% |
| Maryland 2 | Helen Delich Bentley | Republican | 1984 | Incumbent re-elected. | √ Helen Delich Bentley (Republican) 58.7% Clarence Long (Democratic) 41.3% |
| Maryland 3 | Barbara Mikulski | Democratic | 1976 | Incumnent retired to run for U.S. Senator. New member elected. Democratic hold. |
√ Ben Cardin (Democratic) 79.1% Ross Z. Pierpont (Republican) 20.9% |
| Maryland 4 | Marjorie Holt | Republican | 1972 | Incumbent retired. New member elected. Democratic gain. |
√ Charles Thomas McMillen (Democratic) 50.2% Robert R. Neall (Republican) 49.8% |
| Maryland 5 | Steny Hoyer | Democratic | 1981 | Incumbent re-elected. | √ Steny Hoyer (Democratic) 81.9% John Eugene Sellner (Republican) 18.1% |
| Maryland 6 | Beverly Byron | Democratic | 1978 | Incumbent re-elected. | √ Beverly Byron (Democratic) 72.2% John Vandenberge (Republican) 27.8% |
| Maryland 7 | Parren Mitchell | Democratic | 1970 | Incumbent retired. New member elected. Democratic hold. |
√ Kweisi Mfume (Democratic) 86.7% Saint George I. B. Crosse III (Republican) 13.3% |
| Maryland 8 | Michael D. Barnes | Democratic | 1978 | Incumnent retired to run for U.S. Senator. New member elected. Republican gain. |
√ Connie Morella (Republican) 52.9% Stewart Bainum Jr. (Democratic) 47.1% |
Massachusetts
| District | Incumbent | Party | First elected |
Result | Candidates |
|---|---|---|---|---|---|
| Massachusetts 1 | Silvio Conte | Republican | 1958 | Incumbent re-elected. | √ Silvio Conte (Republican) 74.8% Robert S. Weiner (Democratic) 21.3% Others 3.9% |
| Massachusetts 2 | Edward Boland | Democratic | 1952 | Incumbent re-elected. | √ Edward Boland (Democratic) 61.9% Brian Lees (Republican) 32.0% Others 6.1% |
| Massachusetts 3 | Joseph D. Early | Democratic | 1974 | Incumbent re-elected. | √ Joseph D. Early (Democratic) 75.0% Others 25.0% |
| Massachusetts 4 | Barney Frank | Democratic | 1980 | Incumbent re-elected. | √ Barney Frank (Democratic) 80.6% Thomas D. DeVisscher (Republican) 10.1% Others 9.3% |
| Massachusetts 5 | Chester G. Atkins | Democratic | 1984 | Incumbent re-elected. | √ Chester G. Atkins (Democratic) 72.5% Others 27.5% |
| Massachusetts 6 | Nicholas Mavroules | Democratic | 1978 | Incumbent re-elected. | √ Nicholas Mavroules (Democratic) 75.4% Others 24.6% |
| Massachusetts 7 | Ed Markey | Democratic | 1976 | Incumbent re-elected. | √ Ed Markey (Democratic) 71.7% Others 28.3% |
| Massachusetts 8 | Tip O'Neill | Democratic | 1952 | Incumbent retired. New member elected. Democratic hold. |
√ Joseph Patrick Kennedy II (Democratic) 67.5% Clark C. Abt (Republican) 26.0% Others 6.5% |
| Massachusetts 9 | Joe Moakley | Democratic | 1972 | Incumbent re-elected. | √ Joe Moakley (Democratic) 73.7% Robert W. Horan (Independent) 14.3% Others 12.0% |
| Massachusetts 10 | Gerry E. Studds | Democratic | 1972 | Incumbent re-elected. | √ Gerry E. Studds (Democratic) 62.6% Ricardo M. Barros (Republican) 25.5% Alexander Byron (Independent) 8.1% Others 3.8% |
| Massachusetts 11 | Brian J. Donnelly | Democratic | 1978 | Incumbent re-elected. | √ Brian J. Donnelly (Democratic) 77.0% Others 23.0% |
Michigan
| District | Incumbent | Party | First elected |
Result | Candidates |
|---|---|---|---|---|---|
| Michigan 1 | John Conyers | Democratic | 1964 | Incumbent re-elected. | √ John Conyers (Democratic) 89.2% Bill Ashe (Republican) 9.8% Peter Banta Bowen (Independent) 0.5% Andrew Pulley (Independent) 0.5% |
| Michigan 2 | Carl Pursell | Republican | 1976 | Incumbent re-elected. | √ Carl Pursell (Republican) 59.0% Dean Baker (Democratic) 41.0% |
| Michigan 3 | Howard Wolpe | Democratic | 1978 | Incumbent re-elected. | √ Howard Wolpe (Democratic) 60.4% Jackie McGregor (Republican) 39.6% |
| Michigan 4 | Mark D. Siljander | Republican | 1981 | Lost renomination New member elected. Republican hold. |
√ Fred Upton (Republican) 61.9% Dan Roche (Democratic) 36.6% Richard H. Gillmor (Independent) 1.5% |
| Michigan 5 | Paul B. Henry | Republican | 1984 | Incumbent re-elected. | √ Paul B. Henry (Republican) 71.2% Teresa S. Decker (Democratic) 28.8% |
| Michigan 6 | Milton Robert Carr | Democratic | 1982 | Incumbent re-elected. | √ Milton Robert Carr (Democratic) 56.7% Jim Dunn (Republican) 43.3% |
| Michigan 7 | Dale E. Kildee | Democratic | 1976 | Incumbent re-elected. | √ Dale E. Kildee (Democratic) 79.6% Trudie Callahan (Republican) 19.5% Gene Schenk (Independent) 0.9% |
| Michigan 8 | J. Bob Traxler | Democratic | 1974 | Incumbent re-elected. | √ J. Bob Traxler (Democratic) 72.6% John A. Levi (Republican) 27.4% |
| Michigan 9 | Guy Vander Jagt | Republican | 1966 | Incumbent re-elected. | √ Guy Vander Jagt (Republican) 64.4% Richard J. Anderson (Democratic) 35.6% |
| Michigan 10 | Bill Schuette | Republican | 1984 | Incumbent re-elected. | √ Bill Schuette (Republican) 51.2% Donald J. Albosta (Democratic) 48.8% |
| Michigan 11 | Robert William Davis | Republican | 1978 | Incumbent re-elected. | √ Robert William Davis (Republican) 63.0% Robert C. Anderson (Democratic) 36.6% Phil Bellfy (Independent) 0.4% |
| Michigan 12 | David E. Bonior | Democratic | 1976 | Incumbent re-elected. | √ David E. Bonior (Democratic) 66.4% Candice S. Miller (Republican) 33.6% |
| Michigan 13 | George Crockett Jr. | Democratic | 1980 | Incumbent re-elected. | √ George Crockett Jr. (Democratic) 85.2% Mary Griffin (Republican) 13.8% Barbara L. Putnam (Independent) 0.7% Lucy Bell Randolph (Independent) 0.4% |
| Michigan 14 | Dennis M. Hertel | Democratic | 1980 | Incumbent re-elected. | √ Dennis M. Hertel (Democratic) 72.9% Stanley T. Grot (Republican) 26.7% William Osipoff (Independent) 0.4% |
| Michigan 15 | William D. Ford | Democratic | 1964 | Incumbent re-elected. | √ William D. Ford (Democratic) 75.2% Glen Kassel (Republican) 24.2% James H. Stamps (Independent) 0.6% |
| Michigan 16 | John Dingell | Democratic | 1955 | Incumbent re-elected. | √ John Dingell (Democratic) 77.8% Frank Grzywacki (Republican) 22.2% |
| Michigan 17 | Sander M. Levin | Democratic | 1982 | Incumbent re-elected. | √ Sander M. Levin (Democratic) 76.4% Calvin Williams (Republican) 22.5% Charles E. Martell (Independent) 1.1% |
| Michigan 18 | William Broomfield | Republican | 1956 | Incumbent re-elected. | √ William Broomfield (Republican) 73.8% Gary L. Kohut (Democratic) 26.2% |
Minnesota
| District | Incumbent | Party | First elected |
Result | Candidates |
|---|---|---|---|---|---|
| Minnesota 1 | Tim Penny | Democratic | 1982 | Incumbent re-elected. | √ Tim Penny (Democratic–Farmer–Labor) 72.4% Paul H. Grawe (Republican) 27.6% |
| Minnesota 2 | Vin Weber | Republican | 1980 | Incumbent re-elected. | √ Vin Weber (Republican) 51.6% Dave Johnson (Democratic–Farmer–Labor) 48.4% |
| Minnesota 3 | Bill Frenzel | Republican | 1970 | Incumbent re-elected. | √ Bill Frenzel (Republican) 70.1% Ray Stock (Democratic–Farmer–Labor) 29.9% |
| Minnesota 4 | Bruce Vento | Democratic | 1976 | Incumbent re-elected. | √ Bruce Vento (Democratic–Farmer–Labor) 72.9% Harold Stassen (Republican) 27.1% |
| Minnesota 5 | Martin Olav Sabo | Democratic | 1978 | Incumbent re-elected. | √ Martin Olav Sabo (Democratic–Farmer–Labor) 72.7% Rick Serra (Republican) 25.9% Clifford Mark Greene (Independent) 1.4% |
| Minnesota 6 | Gerry Sikorski | Democratic | 1982 | Incumbent re-elected. | √ Gerry Sikorski (Democratic–Farmer–Labor) 65.8% Barbara Zwach Sykora (Republican) 34.2% |
| Minnesota 7 | Arlan Stangeland | Republican | 1977 | Incumbent re-elected. | √ Arlan Stangeland (Republican) 49.7% Collin C. Peterson (Democratic–Farmer–Labor) 49.6% Jon Hall (Citizens) 0.7% |
| Minnesota 8 | Jim Oberstar | Democratic | 1974 | Incumbent re-elected. | √ Jim Oberstar (Democratic–Farmer–Labor) 72.6% Dave Rued (Republican) 27.4% |
Mississippi
| District | Incumbent | Party | First elected |
Result | Candidates |
|---|---|---|---|---|---|
| Mississippi 1 | Jamie L. Whitten | Democratic | 1941 | Incumbent re-elected. | √ Jamie L. Whitten (Democratic) 66.4% Larry Cobb (Republican) 33.6% |
| Mississippi 2 | Webb Franklin | Republican | 1982 | Incumbent lost re-election. New member elected. Democratic gain. |
√ Mike Espy (Democratic) 51.7% Webb Franklin (Republican) 48.3% |
| Mississippi 3 | Gillespie V. Montgomery | Democratic | 1966 | Incumbent re-elected. | √ Gillespie V. Montgomery (Democratic) Unopposed |
| Mississippi 4 | Wayne Dowdy | Democratic | 1981 | Incumbent re-elected. | √ Wayne Dowdy (Democratic) 71.5% Gail Healy (Republican) 28.5% |
| Mississippi 5 | Trent Lott | Republican | 1972 | Incumbent re-elected. | √ Trent Lott (Republican) 82.3% Larry L. Albritton (Democratic) 17.7% |
Missouri
| District | Incumbent | Party | First elected |
Result | Candidates |
|---|---|---|---|---|---|
| Missouri 1 | Bill Clay | Democratic | 1968 | Incumbent re-elected. | √ Bill Clay (Democratic) 66.1% Robert J. Wittman (Republican) 33.9% |
| Missouri 2 | Robert A. Young | Democratic | 1976 | Incumbent lost re-election. New member elected. Republican gain. |
√ Jack Buechner (Republican) 51.9% Robert A. Young (Democratic) 48.1% |
| Missouri 3 | Dick Gephardt | Democratic | 1976 | Incumbent re-elected. | √ Dick Gephardt (Democratic) 69.0% Roy Amelung (Republican) 31.0% |
| Missouri 4 | Ike Skelton | Democratic | 1976 | Incumbent re-elected. | √ Ike Skelton (Democratic) Unopposed |
| Missouri 5 | Alan Wheat | Democratic | 1982 | Incumbent re-elected. | √ Alan Wheat (Democratic) 70.9% Greg Fisher (Republican) 27.6% Jay Manifold (Libertarian) 1.5% |
| Missouri 6 | Earl Thomas Coleman | Republican | 1976 | Incumbent re-elected. | √ Earl Thomas Coleman (Republican) 56.7% Doug R. Hughes (Democratic) 43.3% |
| Missouri 7 | Gene Taylor | Republican | 1972 | Incumbent re-elected. | √ Gene Taylor (Republican) 67.0% Ken Young (Democratic) 33.0% |
| Missouri 8 | Bill Emerson | Republican | 1980 | Incumbent re-elected. | √ Bill Emerson (Republican) 52.5% Wayne Cryts (Democratic) 47.5% |
| Missouri 9 | Harold Volkmer | Democratic | 1976 | Incumbent re-elected. | √ Harold Volkmer (Democratic) 57.5% Ralph Uthlaut Jr. (Republican) 42.5% |
Montana
| District | Incumbent | Party | First elected |
Result | Candidates |
|---|---|---|---|---|---|
| Montana 1 | John Patrick Williams | Democratic | 1978 | Incumbent re-elected. | √ John Patrick Williams (Democratic) 61.7% Don Allen (Republican) 38.3% |
| Montana 2 | Ron Marlenee | Republican | 1976 | Incumbent re-elected. | √ Ron Marlenee (Republican) 53.5% Buck O'Brien (Democratic) 46.5% |
Nebraska
| District | Incumbent | Party | First elected |
Result | Candidates |
|---|---|---|---|---|---|
| Nebraska 1 | Doug Bereuter | Republican | 1978 | Incumbent re-elected. | √ Doug Bereuter (Republican) 64.5% Steve Burns (Democratic) 35.5% |
| Nebraska 2 | Hal Daub | Republican | 1980 | Incumbent re-elected. | √ Hal Daub (Republican) 58.6% Walter M. Calinger (Democratic) 41.4% |
| Nebraska 3 | Virginia D. Smith | Republican | 1974 | Incumbent re-elected. | √ Virginia D. Smith (Republican) 69.8% Scott E. Sidwell (Democratic) 30.2% |
Nevada
| District | Incumbent | Party | First elected |
Result | Candidates |
|---|---|---|---|---|---|
| Nevada 1 | Harry Reid | Democratic | 1982 | Incumbent retired to run for U.S. Senator. New member elected. Democratic hold. |
√ James Bilbray (Democratic) 54.1% Bob Ryan (Republican) 44.0% Gordon Michael Morris (Libertarian) 1.9% |
| Nevada 2 | Barbara Vucanovich | Republican | 1982 | Incumbent re-elected. | √ Barbara Vucanovich (Republican) 58.4% Pete Sferrazza (Democratic) 41.6% |
New Hampshire
| District | Incumbent | Party | First elected |
Result | Candidates |
|---|---|---|---|---|---|
| New Hampshire 1 | Bob Smith | Republican | 1984 | Incumbent re-elected. | √ Bob Smith (Republican) 56.4% James M. Demers (Democratic) 43.6% |
| New Hampshire 2 | Judd Gregg | Republican | 1980 | Incumbent re-elected. | √ Judd Gregg (Republican) 74.2% Lawrence Craig-Green (Democratic) 25.8% |
New Jersey
| District | Incumbent | Party | First elected |
Result | Candidates |
|---|---|---|---|---|---|
| New Jersey 1 | James J. Florio | Democratic | 1974 | Incumbent re-elected. | √ James J. Florio (Democratic) 75.6% Frederick A. Busch Jr. (Republican) 23.6% Jerry Zeldin (Libertarian) 0.8% |
| New Jersey 2 | William J. Hughes | Democratic | 1974 | Incumbent re-elected. | √ William J. Hughes (Democratic) 68.3% Alfred J. Bennington Jr. (Republican) 28.6% Len Smith (Pro-Life) 3.1% |
| New Jersey 3 | James J. Howard | Democratic | 1964 | Incumbent re-elected. | √ James J. Howard (Democratic) 58.7% Brian T. Kennedy (Republican) 41.3% |
| New Jersey 4 | Christopher H. Smith | Republican | 1980 | Incumbent re-elected. | √ Christopher H. Smith (Republican) 61.1% Jeffrey Laurenti (Democratic) 38.3% Earl G. Dickey (Independent) 0.6% |
| New Jersey 5 | Marge Roukema | Republican | 1980 | Incumbent re-elected. | √ Marge Roukema (Republican) 68.0% H. Vernon Jolley (Democratic) 32.0% |
| New Jersey 6 | Bernard J. Dwyer | Democratic | 1980 | Incumbent re-elected. | √ Bernard J. Dwyer (Democratic) 69.0% John D. Scalamonti (Republican) 28.9% Rose Monyek (Independent) 2.1% |
| New Jersey 7 | Matthew John Rinaldo | Republican | 1972 | Incumbent re-elected. | √ Matthew John Rinaldo (Republican) 79.0% June S. Fischer (Democratic) 21.0% |
| New Jersey 8 | Robert A. Roe | Democratic | 1970 | Incumbent re-elected. | √ Robert A. Roe (Democratic) 62.8% Thomas P. Zampino (Republican) 37.2% |
| New Jersey 9 | Robert Torricelli | Democratic | 1982 | Incumbent re-elected. | √ Robert Torricelli (Democratic) 69.0% Arthur F. Jones (Republican) 31.0% |
| New Jersey 10 | Peter W. Rodino | Democratic | 1948 | Incumbent re-elected. | √ Peter W. Rodino (Democratic) 95.9% Chris Brandlon (Socialist Workers) 4.1% |
| New Jersey 11 | Dean Gallo | Republican | 1984 | Incumbent re-elected. | √ Dean Gallo (Republican) 68.0% Frank Askin (Democratic) 32.0% |
| New Jersey 12 | James A. Courter | Republican | 1978 | Incumbent re-elected. | √ James A. Courter (Republican) 63.5% David B. Crabiel (Democratic) 36.5% |
| New Jersey 13 | Jim Saxton | Republican | 1984 | Incumbent re-elected. | √ Jim Saxton (Republican) 65.4% John Wydra (Democratic) 34.6% |
| New Jersey 14 | Frank Joseph Guarini | Democratic | 1978 | Incumbent re-elected. | √ Frank Joseph Guarini (Democratic) 70.7% Albio Sires (Republican) 26.7% Herbert H. Shaw (Independent) 2.0% William Link (Independent) 0.6% |
New Mexico
| District | Incumbent | Party | First elected |
Result | Candidates |
|---|---|---|---|---|---|
| New Mexico 1 | Manuel Lujan Jr. | Republican | 1968 | Incumbent re-elected. | √ Manuel Lujan Jr. (Republican) 70.9% Manny Garcia (Democratic) 29.1% |
| New Mexico 2 | Joe Skeen | Republican | 1980 | Incumbent re-elected. | √ Joe Skeen (Republican) 62.9% Mike Runnels (Democratic) 37.1% |
| New Mexico 3 | Bill Richardson | Democratic | 1982 | Incumbent re-elected. | √ Bill Richardson (Democratic) 71.3% David F. Cargo (Republican) 28.7% |
New York
| District | Incumbent | Party | First elected |
Result | Candidates |
|---|---|---|---|---|---|
| New York 1 | William Carney | Republican | 1978 | Incumbent retired. New member elected. Democratic gain. |
√ George J. Hochbrueckner (Democratic) 51.2% Gregory J. Blass (Republican) 42.3% Dominic J. Santoro (Con) 3.3% William J. Doyle (Right to Life) 3.2% |
| New York 2 | Thomas J. Downey | Democratic | 1974 | Incumbent re-elected. | √ Thomas J. Downey (Democratic) 64.3% Jeffrey A. Butzke (Republican) 32.4% Veronica Windishman (Right to Life) 3.4% |
| New York 3 | Robert J. Mrazek | Democratic | 1982 | Incumbent re-elected. | √ Robert J. Mrazek (Democratic) 56.4% Joseph A. Guarino (Republican) 40.6% Charles W. Welch (Right to Life) 3.0% |
| New York 4 | Norman F. Lent | Republican | 1970 | Incumbent re-elected. | √ Norman F. Lent (Republican) 64.8% Patricia Sullivan (Democratic) 30.6% George E. Patterson (Right to Life) 4.6% |
| New York 5 | Raymond J. McGrath | Republican | 1980 | Incumbent re-elected. | √ Raymond J. McGrath (Republican) 65.3% Michael T. Sullivan (Democratic) 34.7% |
| New York 6 | Alton R. Waldon Jr. | Democratic | 1986 | Lost renomination New member elected. Democratic hold. |
√ Floyd H. Flake (Democratic) 67.7% Richard Dietl (Republican) 32.3% |
| New York 7 | Gary L. Ackerman | Democratic | 1983 | Incumbent re-elected. | √ Gary L. Ackerman (Democratic) 77.4% Edward Nelson Rodriguez (Republican) 22.6% |
| New York 8 | James H. Scheuer | Democratic | 1974 | Incumbent re-elected. | √ James H. Scheuer (Democratic) 90.2% Gustave Reifenkugel (Con) 9.8% |
| New York 9 | Thomas J. Manton | Democratic | 1984 | Incumbent re-elected. | √ Thomas J. Manton (Democratic) 69.4% Salvatore J. Calise (Republican) 24.7% Thomas V. Ognibene (Con) 5.9% |
| New York 10 | Chuck Schumer | Democratic | 1980 | Incumbent re-elected. | √ Chuck Schumer (Democratic) 93.3% Alice Gaffney (Con) 6.7% |
| New York 11 | Edolphus Towns | Democratic | 1982 | Incumbent re-elected. | √ Edolphus Towns (Democratic) 89.4% Nathaniel Hendricks (Republican) 8.7% Alfred Hamel (Con) 1.9% |
| New York 12 | Major Owens | Democratic | 1982 | Incumbent re-elected. | √ Major Owens (Democratic) 91.5% Owen Augustin (Republican) 6.0% Joseph Caesar (Con) 2.5% |
| New York 13 | Stephen J. Solarz | Democratic | 1974 | Incumbent re-elected. | √ Stephen J. Solarz (Democratic) 82.4% Leon Nadrowski (Republican) 14.8% Samuel Roth (Con) 2.8% |
| New York 14 | Guy V. Molinari | Republican | 1980 | Incumbent re-elected. | √ Guy V. Molinari (Republican) 68.8% Barbara Walla (Democratic) 29.7% Joseph F. Sulley (Lib) 1.5% |
| New York 15 | S. William Green | Republican | 1978 | Incumbent re-elected. | √ S. William Green (Republican) 58.0% George A. Hirsch (Democratic) 42.0% |
| New York 16 | Charles B. Rangel | Democratic | 1970 | Incumbent re-elected. | √ Charles B. Rangel (Democratic) 96.4% Michael R. Berns (Con) 2.0% William Seraile (New Alliance) 1.6% |
| New York 17 | Theodore S. Weiss | Democratic | 1976 | Incumbent re-elected. | √ Theodore S. Weiss (Democratic) 85.5% Thomas A. Chorba (Republican) 14.0% James J. Mangia (New Alliance) 0.5% |
| New York 18 | Robert Garcia | Democratic | 1978 | Incumbent re-elected. | √ Robert Garcia (Democratic) 93.5% Melanie Chase (Republican) 5.3% Lorraine Verhoff (Con) 1.1% |
| New York 19 | Mario Biaggi | Democratic | 1968 | Incumbent re-elected. | √ Mario Biaggi (Democratic) 90.2% Alice Farrell (Con) 7.1% John J. Barry (Right to Life) 2.7% |
| New York 20 | Joseph J. DioGuardi | Republican | 1984 | Incumbent re-elected. | √ Joseph J. DioGuardi (Republican) 53.9% Bella Abzug (Democratic) 44.6% Florence T. O'Grady (Right to Life) 1.6% |
| New York 21 | Hamilton Fish IV | Republican | 1968 | Incumbent re-elected. | √ Hamilton Fish IV (Republican) 76.5% Lawrence W. Grunberger (Democratic) 21.2% Karen A. Gormley-Vitale (Right to Life) 2.2% |
| New York 22 | Benjamin A. Gilman | Republican | 1972 | Incumbent re-elected. | √ Benjamin A. Gilman (Republican) 69.5% Eleanor F. Burlingham (Democratic) 27.2% Richard Bruno (Right to Life) 3.4% |
| New York 23 | Samuel S. Stratton | Democratic | 1958 | Incumbent re-elected. | √ Samuel S. Stratton (Democratic) 96.4% James Joseph Callahan (Socialist Workers) 3.6% |
| New York 24 | Gerald B. H. Solomon | Republican | 1978 | Incumbent re-elected. | √ Gerald B. H. Solomon (Republican) 70.4% Edward James Bloch (Democratic) 29.6% |
| New York 25 | Sherwood Boehlert | Republican | 1982 | Incumbent re-elected. | √ Sherwood Boehlert (Republican) 69.0% Kevin J. Conway (Democratic) 22.4% Robert S. Barstow (Con) 8.6% |
| New York 26 | David O'Brien Martin | Republican | 1980 | Incumbent re-elected. | √ David O'Brien Martin (Republican) Unopposed |
| New York 27 | George C. Wortley | Republican | 1980 | Incumbent re-elected. | √ George C. Wortley (Republican) 49.7% Rosemary S. Pooler (Democratic) 49.1% Dennis R. Burns (Right to Life) 1.3% |
| New York 28 | Matthew F. McHugh | Democratic | 1974 | Incumbent re-elected. | √ Matthew F. McHugh (Democratic) 68.3% Mark R. Masterson (Republican) 31.7% |
| New York 29 | Frank Horton | Republican | 1962 | Incumbent re-elected. | √ Frank Horton (Republican) 70.7% James R. Vogel (Democratic) 24.2% Robert C. Byrnes Jr. (Con) 3.4% Donald M. Peters (Right to Life) 1.7% |
| New York 30 | Fred J. Eckert | Republican | 1984 | Incumbent lost re-election. New member elected. Democratic gain. |
√ Louise Slaughter (Democratic) 51.0% Fred J. Eckert (Republican) 49.0% |
| New York 31 | Jack Kemp | Republican | 1970 | Incumbent re-elected. | √ Jack Kemp (Republican) 57.5% James P. Keane (Democratic) 42.0% Gerald R. Morgan (Lib) 0.6% |
| New York 32 | John J. LaFalce | Democratic | 1974 | Incumbent re-elected. | √ John J. LaFalce (Democratic) 91.0% Dean L. Walker (Con) 5.7% Anthony J. Murty (Right to Life) 3.4% |
| New York 33 | Henry J. Nowak | Democratic | 1974 | Incumbent re-elected. | √ Henry J. Nowak (Democratic) 85.1% Charles A. Walker (Republican) 14.9% |
| New York 34 | Stan Lundine | Democratic | 1976 | Retired to run for run for Lieutenant Governor of New York. New member elected. Republican gain. |
√ Amo Houghton (Republican) 60.1% Larry M. Himelein (Democratic) 39.9% |
North Carolina
| District | Incumbent | Party | First elected |
Result | Candidates |
|---|---|---|---|---|---|
| North Carolina 1 | Walter B. Jones Sr. | Democratic | 1966 | Incumbent re-elected. | √ Walter B. Jones Sr. (Democratic) 69.5% Howard Moye (Republican) 30.5% |
| North Carolina 2 | Tim Valentine | Democratic | 1982 | Incumbent re-elected. | √ Tim Valentine (Democratic) 74.6% Bud McElhaney (Republican) 25.4% |
| North Carolina 3 | Charles Orville Whitley | Democratic | 1976 | Incumbent retired. New member elected. Democratic hold. |
√ Martin Lancaster (Democratic) 64.5% Gerald B. Hurst (Republican) 35.5% |
| North Carolina 4 | Bill Cobey | Republican | 1984 | Incumbent lost re-election. New member elected. Democratic gain. |
√ David E. Price (Democratic) 55.7% Bill Cobey (Republican) 44.3% |
| North Carolina 5 | Stephen L. Neal | Democratic | 1974 | Incumbent re-elected. | √ Stephen L. Neal (Democratic) 54.1% Stuart Epperson (Republican) 45.9% |
| North Carolina 6 | Howard Coble | Republican | 1984 | Incumbent re-elected. | √ Howard Coble (Republican) 50.0% Charles Robin Britt (Democratic) 50.0% |
| North Carolina 7 | Charlie Rose | Democratic | 1972 | Incumbent re-elected. | √ Charlie Rose (Democratic) 64.2% Thomas J. Harrelson (Republican) 35.8% |
| North Carolina 8 | Bill Hefner | Democratic | 1974 | Incumbent re-elected. | √ Bill Hefner (Democratic) 57.9% William G. Hamby Jr. (Republican) 42.1% |
| North Carolina 9 | Alex McMillan | Republican | 1984 | Incumbent re-elected. | √ Alex McMillan (Republican) 51.3% D. G. Martin (Democratic) 48.7% |
| North Carolina 10 | James T. Broyhill | Republican | 1962 | Incumbent resigned when appointed U.S. Senator. New member elected. Republican hold. |
√ Cass Ballenger (Republican) 57.5% Lester D. Roark (Democratic) 42.5% |
| North Carolina 11 | Bill Hendon | Republican | 1984 | Incumbent lost re-election. New member elected. Democratic gain. |
√ James McClure Clarke (Democratic) 50.7% Bill Hendon (Republican) 49.3% |
North Dakota
| District | Incumbent | Party | First elected |
Result | Candidates |
|---|---|---|---|---|---|
| North Dakota at-large | Byron Dorgan | Democratic | 1980 | Incumbent re-elected. | √ Byron Dorgan (Democratic) 75.5% Syver Vinje (Republican) 23.4% Gerald W. Kopp (Independent) 1.1% |
Ohio
| District | Incumbent | Party | First elected |
Result | Candidates |
|---|---|---|---|---|---|
| Ohio 1 | Tom Luken | Democratic | 1976 | Incumbent re-elected. | √ Tom Luken (Democratic) 61.7% Fred E. Morr (Republican) 38.3% |
| Ohio 2 | Bill Gradison | Republican | 1974 | Incumbent re-elected. | √ Bill Gradison (Republican) 70.7% William F. Stineman (Democratic) 29.3% |
| Ohio 3 | Tony P. Hall | Democratic | 1978 | Incumbent re-elected. | √ Tony P. Hall (Democratic) 73.7% Ron Crutcher (Republican) 26.3% |
| Ohio 4 | Mike Oxley | Republican | 1972 | Incumbent re-elected. | √ Mike Oxley (Republican) 75.1% Clem T. Cratty (Democratic) 17.1% Raven L. Workman (Independent) 7.8% |
| Ohio 5 | Del Latta | Republican | 1958 | Incumbent re-elected. | √ Del Latta (Republican) 65.0% Tom Murray (Democratic) 35.0% |
| Ohio 6 | Bob McEwen | Republican | 1980 | Incumbent re-elected. | √ Bob McEwen (Republican) 70.3% Gordon R. Roberts (Democratic) 27.9% Amos Seeley (Independent) 1.9% |
| Ohio 7 | Mike DeWine | Republican | 1982 | Incumbent re-elected. | √ Mike DeWine (Republican) Unopposed |
| Ohio 8 | Tom Kindness | Republican | 1974 | Incumnent retired to run for U.S. Senator. New member elected. Republican hold. |
√ Buz Lukens (Republican) 68.1% John W. Griffin (Democratic) 31.9% |
| Ohio 9 | Marcy Kaptur | Democratic | 1982 | Incumbent re-elected. | √ Marcy Kaptur (Democratic) 77.5% Mike Shufeldt (Republican) 22.5% |
| Ohio 10 | Clarence E. Miller | Republican | 1966 | Incumbent re-elected. | √ Clarence E. Miller (Republican) 70.4% John M. Buchanan (Democratic) 29.6% |
| Ohio 11 | Dennis E. Eckart | Democratic | 1980 | Incumbent re-elected. | √ Dennis E. Eckart (Democratic) 72.5% Margaret R. Mueller (Republican) 24.9% Werner J. Lange (Independent) 2.7% |
| Ohio 12 | John Kasich | Republican | 1982 | Incumbent re-elected. | √ John Kasich (Republican) 73.4% Timothy C. Jochim (Democratic) 26.6% |
| Ohio 13 | Don Pease | Democratic | 1976 | Incumbent re-elected. | √ Don Pease (Democratic) 62.8% William D. Nielsen Jr. (Republican) 37.2% |
| Ohio 14 | John F. Seiberling | Democratic | 1970 | Incumbent retired. New member elected. Democratic hold. |
√ Thomas C. Sawyer (Democratic) 53.7% Lynn Slaby (Republican) 46.3% |
| Ohio 15 | Chalmers P. Wylie | Republican | 1966 | Incumbent re-elected. | √ Chalmers P. Wylie (Republican) 63.7% David L. Jackson (Democratic) 36.3% |
| Ohio 16 | Ralph Regula | Republican | 1972 | Incumbent re-elected. | √ Ralph Regula (Republican) 76.3% William J. Kennick (Democratic) 23.7% |
| Ohio 17 | Jim Traficant | Democratic | 1984 | Incumbent re-elected. | √ Jim Traficant (Democratic) 72.3% James H. Fulks (Republican) 27.7% |
| Ohio 18 | Douglas Applegate | Democratic | 1976 | Incumbent re-elected. | √ Douglas Applegate (Democratic) Unopposed |
| Ohio 19 | Ed Feighan | Democratic | 1982 | Incumbent re-elected. | √ Ed Feighan (Democratic) 54.8% Gary C. Suhadolnik (Republican) 45.2% |
| Ohio 20 | Mary Rose Oakar | Democratic | 1976 | Incumbent re-elected. | √ Mary Rose Oakar (Democratic) 84.9% Bill Smith (Republican) 15.1% |
| Ohio 21 | Louis Stokes | Democratic | 1968 | Incumbent re-elected. | √ Louis Stokes (Democratic) 81.6% Franklin H. Roski (Republican) 18.4% |
Oklahoma
| District | Incumbent | Party | First elected |
Result | Candidates |
|---|---|---|---|---|---|
| Oklahoma 1 | James R. Jones | Democratic | 1972 | Incumnent retired to run for U.S. Senator. New member elected. Republican gain. |
√ Jim Inhofe (Republican) 54.8% Gary D. Allison (Democratic) 42.8% Carl E. McCullough Jr. (Independent) 2.4% |
| Oklahoma 2 | Mike Synar | Democratic | 1978 | Incumbent re-elected. | √ Mike Synar (Democratic) 73.3% Gary K. Rice (Republican) 26.7% |
| Oklahoma 3 | Wes Watkins | Democratic | 1976 | Incumbent re-elected. | √ Wes Watkins (Democratic) 78.1% Patrick K. Miller (Republican) 21.9% |
| Oklahoma 4 | Dave McCurdy | Democratic | 1980 | Incumbent re-elected. | √ Dave McCurdy (Democratic) 76.2% Larry Humphreys (Republican) 23.8% |
| Oklahoma 5 | Mickey Edwards | Republican | 1976 | Incumbent re-elected. | √ Mickey Edwards (Republican) 70.6% Donna Compton (Democratic) 29.4% |
| Oklahoma 6 | Glenn English | Democratic | 1974 | Incumbent re-elected. | √ Glenn English (Democratic) Unopposed |
Oregon
| District | Incumbent | Party | First elected |
Result | Candidates |
|---|---|---|---|---|---|
| Oregon 1 | Les AuCoin | Democratic | 1974 | Incumbent re-elected. | √ Les AuCoin (Democratic) 61.7% Anthony Meeker (Republican) 38.3% |
| Oregon 2 | Robert Freeman Smith | Republican | 1982 | Incumbent re-elected. | √ Robert Freeman Smith (Republican) 60.2% Larry Tuttle (Democratic) 39.8% |
| Oregon 3 | Ron Wyden | Democratic | 1980 | Incumbent re-elected. | √ Ron Wyden (Democratic) 86.0% Thomas H. Phelan (Republican) 14.0% |
| Oregon 4 | Jim Weaver | Democratic | 1974 | Incumnent retired to run for U.S. Senator. New member elected. Democratic hold. |
√ Peter DeFazio (Democratic) 54.1% Bruce Long (Republican) 45.9% |
| Oregon 5 | Denny Smith | Republican | 1980 | Incumbent re-elected. | √ Denny Smith (Republican) 60.5% Barbara Ross (Democratic) 39.5% |
Pennsylvania
| District | Incumbent | Party | First elected |
Result | Candidates |
|---|---|---|---|---|---|
| Pennsylvania 1 | Thomas M. Foglietta | Democratic | 1980 | Incumbent re-elected. | √ Thomas M. Foglietta (Democratic) 74.7% Anthony J. Mucciolo (Republican) 25.3% |
| Pennsylvania 2 | William H. Gray | Democratic | 1978 | Incumbent re-elected. | √ William H. Gray (Democratic) 98.4% Linda R. Ragin (New Alliance) 1.6% |
| Pennsylvania 3 | Robert A. Borski, Jr. | Democratic | 1982 | Incumbent re-elected. | √ Robert A. Borski, Jr. (Democratic) 61.8% Robert A. Rovner (Republican) 38.2% |
| Pennsylvania 4 | Joseph P. Kolter | Democratic | 1982 | Incumbent re-elected. | √ Joseph P. Kolter (Democratic) 60.4% Al Lindsay (Republican) 38.7% Emily C. Fair (Populist) 0.9% |
| Pennsylvania 5 | Richard T. Schulze | Republican | 1974 | Incumbent re-elected. | √ Richard T. Schulze (Republican) 65.7% Tim Ringgold (Democratic) 34.3% |
| Pennsylvania 6 | Gus Yatron | Democratic | 1968 | Incumbent re-elected. | √ Gus Yatron (Democratic) 69.1% Norm Bertasavage (Republican) 30.9% |
| Pennsylvania 7 | Robert W. Edgar | Democratic | 1974 | Incumnent retired to run for U.S. Senator. New member elected. Republican gain. |
√ Curt Weldon (Republican) 61.3% Bill Spingler (Democratic) 38.7% |
| Pennsylvania 8 | Peter H. Kostmayer | Democratic | 1982 | Incumbent re-elected. | √ Peter H. Kostmayer (Democratic) 55.0% David A. Christian (Republican) 45.0% |
| Pennsylvania 9 | Bud Shuster | Republican | 1972 | Incumbent re-elected. | √ Bud Shuster (Republican) Unopposed |
| Pennsylvania 10 | Joseph M. McDade | Republican | 1962 | Incumbent re-elected. | √ Joseph M. McDade (Republican) 74.7% Robert C. Bolus (Democratic) 25.3% |
| Pennsylvania 11 | Paul E. Kanjorski | Democratic | 1984 | Incumbent re-elected. | √ Paul E. Kanjorski (Democratic) 70.6% Marc Holtzman (Republican) 29.4% |
| Pennsylvania 12 | John Murtha | Democratic | 1974 | Incumbent re-elected. | √ John Murtha (Democratic) 67.4% Kathy Holtzman (Republican) 32.6% |
| Pennsylvania 13 | R. Lawrence Coughlin | Republican | 1968 | Incumbent re-elected. | √ R. Lawrence Coughlin (Republican) 58.5% Joseph M. Hoeffel (Democratic) 41.5% |
| Pennsylvania 14 | William J. Coyne | Democratic | 1980 | Incumbent re-elected. | √ William J. Coyne (Democratic) 89.6% Richard Edward Caligiuri (Libertarian) 5.2% Mark Weddleton (Socialist Workers) 2.7% Thomas R. McIntyre (Populist) 1.3% Phyllis Gray (Workers) 1.3% |
| Pennsylvania 15 | Donald L. Ritter | Republican | 1978 | Incumbent re-elected. | √ Donald L. Ritter (Republican) 56.8% Joe Simonetta (Democratic) 43.2% |
| Pennsylvania 16 | Robert Smith Walker | Republican | 1976 | Incumbent re-elected. | √ Robert Smith Walker (Republican) 74.6% James Hagelgans (Democratic) 25.4% |
| Pennsylvania 17 | George Gekas | Republican | 1982 | Incumbent re-elected. | √ George Gekas (Republican) 73.6% Michael S. Ogden (Democratic) 26.4% |
| Pennsylvania 18 | Doug Walgren | Democratic | 1976 | Incumbent re-elected. | √ Doug Walgren (Democratic) 63.0% Ernie Buckman (Republican) 37.0% |
| Pennsylvania 19 | William F. Goodling | Republican | 1974 | Incumbent re-elected. | √ William F. Goodling (Republican) 72.9% Richard F. Thornton (Democratic) 27.1% |
| Pennsylvania 20 | Joseph M. Gaydos | Democratic | 1968 | Incumbent re-elected. | √ Joseph M. Gaydos (Democratic) 98.5% Alden W. Vedder (Workers) 1.5% |
| Pennsylvania 21 | Tom Ridge | Republican | 1982 | Incumbent re-elected. | √ Tom Ridge (Republican) 80.9% Joylyn Blackwell (Democratic) 19.1% |
| Pennsylvania 22 | Austin Murphy | Democratic | 1976 | Incumbent re-elected. | √ Austin Murphy (Democratic) Unopposed |
| Pennsylvania 23 | William F. Clinger Jr. | Republican | 1978 | Incumbent re-elected. | √ William F. Clinger Jr. (Republican) 55.5% Bill Wachob (Democratic) 44.5% |
Rhode Island
| District | Incumbent | Party | First elected |
Result | Candidates |
|---|---|---|---|---|---|
| Rhode Island 1 | Fernand St. Germain | Democratic | 1960 | Incumbent re-elected. | √ Fernand St. Germain (Democratic) 68.5% John A. Holmes Jr. (Republican) 31.5% |
| Rhode Island 2 | Claudine Schneider | Republican | 1980 | Incumbent re-elected. | √ Claudine Schneider (Republican) 67.6% Donald J. Ferry (Democratic) 32.4% |
South Carolina
| District | Incumbent | Party | First elected |
Result | Candidates |
|---|---|---|---|---|---|
| South Carolina 1 | Thomas F. Hartnett | Republican | 1980 | Retired to run for Lieutenant Governor of South Carolina. New member elected. Republican hold. |
√ Arthur Ravenel Jr. (Republican) 52.0% Jimmy Stuckey (Democratic) 48.0% |
| South Carolina 2 | Floyd Spence | Republican | 1970 | Incumbent re-elected. | √ Floyd Spence (Republican) 53.6% Fred Zeigler (Democratic) 46.4% |
| South Carolina 3 | Butler Derrick | Democratic | 1974 | Incumbent re-elected. | √ Butler Derrick (Democratic) 68.4% Richard Dickison (Republican) 31.6% |
| South Carolina 4 | Carroll A. Campbell Jr. | Republican | 1978 | Retired to run for Governor of South Carolina. New member elected. Democratic gain. |
√ Liz J. Patterson (Democratic) 51.4% Bill Workman (Republican) 47.3% Bob Wilson (American) 1.3% |
| South Carolina 5 | John Spratt | Democratic | 1982 | Incumbent re-elected. | √ John Spratt (Democratic) Unopposed |
| South Carolina 6 | Robin Tallon | Democratic | 1982 | Incumbent re-elected. | √ Robin Tallon (Democratic) 75.5% Robbie Cunningham (Republican) 24.5% |
South Dakota
| District | Incumbent | Party | First elected |
Result | Candidates |
|---|---|---|---|---|---|
| South Dakota at-large | Tom Daschle | Democratic | 1978 | Incumnent retired to run for U.S. Senator. New member elected. Democratic hold. |
√ Tim Johnson (Democratic) 59.2% Dale Bell (Republican) 40.8% |
Tennessee
| District | Incumbent | Party | First elected |
Result | Candidates |
|---|---|---|---|---|---|
| Tennessee 1 | Jimmy Quillen | Republican | 1962 | Incumbent re-elected. | √ Jimmy Quillen (Republican) 68.9% John B. Russell (Democratic) 31.1% |
| Tennessee 2 | John Duncan Sr. | Republican | 1964 | Incumbent re-elected. | √ John Duncan Sr. (Republican) 76.2% John F. Bowen (Democratic) 23.8% |
| Tennessee 3 | Marilyn Lloyd | Democratic | 1974 | Incumbent re-elected. | √ Marilyn Lloyd (Democratic) 53.9% Jim Golden (Republican) 46.1% |
| Tennessee 4 | Jim Cooper | Democratic | 1982 | Incumbent re-elected. | √ Jim Cooper (Democratic) Unopposed |
| Tennessee 5 | Bill Boner | Democratic | 1978 | Incumbent re-elected. | √ Bill Boner (Democratic) 57.9% Terry Holcomb (Republican) 39.9% Charlie Daniels (Independent) 1.4% Russell Hancock (Independent) 0.4% Kenneth Wayne Bloodworth (Independent) 0.4% |
| Tennessee 6 | Bart Gordon | Democratic | 1984 | Incumbent re-elected. | √ Bart Gordon (Democratic) 76.8% Fred Vail (Republican) 23.2% |
| Tennessee 7 | Don Sundquist | Republican | 1982 | Incumbent re-elected. | √ Don Sundquist (Republican) 72.3% M. Lloyd Hiler (Democratic) 27.7% |
| Tennessee 8 | Ed Jones | Democratic | 1969 | Incumbent re-elected. | √ Ed Jones (Democratic) 80.4% Dan H. Campbell (Republican) 19.6% |
| Tennessee 9 | Harold Ford Sr. | Democratic | 1974 | Incumbent re-elected. | √ Harold Ford Sr. (Democratic) 83.7% Isaac Richmond (Independent) 16.3% |
Texas
| District | Incumbent | Party | First elected |
Result | Candidates |
|---|---|---|---|---|---|
| Texas 1 | Jim Chapman | Democratic | 1985 | Incumbent re-elected. | √ Jim Chapman (Democratic) Unopposed |
| Texas 2 | Charles Wilson | Democratic | 1972 | Incumbent re-elected. | √ Charles Wilson (Democratic) 56.8% Julian Gordon (Republican) 40.5% Sam I. Paradice (Independent) 2.8% |
| Texas 3 | Steve Bartlett | Republican | 1982 | Incumbent re-elected. | √ Steve Bartlett (Republican) 94.1% Brent Barnes (Independent) 4.1% Don Gough (Libertarian) 1.8% |
| Texas 4 | Ralph Hall | Democratic | 1980 | Incumbent re-elected. | √ Ralph Hall (Democratic) 71.7% Thomas Blow (Republican) 28.3% |
| Texas 5 | John Wiley Bryant | Democratic | 1982 | Incumbent re-elected. | √ John Wiley Bryant (Democratic) 58.5% Tom Carter (Republican) 40.7% Bob Brewer (Libertarian) 0.8% |
| Texas 6 | Joe Barton | Republican | 1984 | Incumbent re-elected. | √ Joe Barton (Republican) 55.8% Pete Geren (Democratic) 44.2% |
| Texas 7 | William Reynolds Archer Jr. | Republican | 1970 | Incumbent re-elected. | √ William Reynolds Archer Jr. (Republican) 87.4% Harry Kniffen (Democratic) 11.9% Roger Plail (Libertarian) 0.7% |
| Texas 8 | Jack Fields | Republican | 1980 | Incumbent re-elected. | √ Jack Fields (Republican) 68.4% Blaine Mann (Democratic) 31.6% |
| Texas 9 | Jack Brooks | Democratic | 1952 | Incumbent re-elected. | √ Jack Brooks (Democratic) 61.5% Lisa D. Duperier (Republican) 38.5% |
| Texas 10 | J. J. Pickle | Democratic | 1963 | Incumbent re-elected. | √ J. J. Pickle (Democratic) 72.3% Carole Keeton Rylander (Republican) 27.7% |
| Texas 11 | Marvin Leath | Democratic | 1978 | Incumbent re-elected. | √ Marvin Leath (Democratic) Unopposed |
| Texas 12 | Jim Wright | Democratic | 1954 | Incumbent re-elected. | √ Jim Wright (Democratic) 68.7% Don McNeil (Republican) 31.3% |
| Texas 13 | Beau Boulter | Republican | 1984 | Incumbent re-elected. | √ Beau Boulter (Republican) 64.9% Doug Seal (Democratic) 35.1% |
| Texas 14 | Mac Sweeney | Republican | 1984 | Incumbent re-elected. | √ Mac Sweeney (Republican) 52.3% Greg Laughlin (Democratic) 47.7% |
| Texas 15 | Kika de la Garza | Democratic | 1964 | Incumbent re-elected. | √ Kika de la Garza (Democratic) Unopposed |
| Texas 16 | Ronald D. Coleman | Democratic | 1982 | Incumbent re-elected. | √ Ronald D. Coleman (Democratic) 65.7% Roy Gillia (Republican) 34.3% |
| Texas 17 | Charles Stenholm | Democratic | 1978 | Incumbent re-elected. | √ Charles Stenholm (Democratic) Unopposed |
| Texas 18 | Mickey Leland | Democratic | 1978 | Incumbent re-elected. | √ Mickey Leland (Democratic) 90.2% Joanne Kuniansky (Independent) 9.8% |
| Texas 19 | Larry Combest | Republican | 1984 | Incumbent re-elected. | √ Larry Combest (Republican) 62.0% Gerald McCathern (Democratic) 38.0% |
| Texas 20 | Henry B. Gonzalez | Democratic | 1961 | Incumbent re-elected. | √ Henry B. Gonzalez (Democratic) Unopposed |
| Texas 21 | Tom Loeffler | Republican | 1978 | Retired to run for Governor of Texas. New member elected. Republican hold. |
√ Lamar S. Smith (Republican) 60.6% Pete Snelson (Democratic) 38.5% Jim Robinson (Libertarian) 0.9% |
| Texas 22 | Tom DeLay | Republican | 1984 | Incumbent re-elected. | √ Tom DeLay (Republican) 71.8% Susan Director (Democratic) 28.2% |
| Texas 23 | Albert Bustamante | Democratic | 1984 | Incumbent re-elected. | √ Albert Bustamante (Democratic) 90.7% Ken Hendrix (Libertarian) 9.3% |
| Texas 24 | Martin Frost | Democratic | 1978 | Incumbent re-elected. | √ Martin Frost (Democratic) 67.2% Bob Burk (Republican) 32.8% |
| Texas 25 | Michael A. Andrews | Democratic | 1982 | Incumbent re-elected. | √ Michael A. Andrews (Democratic) Unopposed |
| Texas 26 | Dick Armey | Republican | 1984 | Incumbent re-elected. | √ Dick Armey (Republican) 68.1% George Richardson (Democratic) 31.9% |
| Texas 27 | Solomon P. Ortiz | Democratic | 1982 | Incumbent re-elected. | √ Solomon P. Ortiz (Democratic) Unopposed |
Utah
| District | Incumbent | Party | First elected |
Result | Candidates |
|---|---|---|---|---|---|
| Utah 1 | James V. Hansen | Republican | 1980 | Incumbent re-elected. | √ James V. Hansen (Republican) 51.6% Gunn McKay (Democratic) 48.4% |
| Utah 2 | David Smith Monson | Republican | 1984 | Incumbent retired. New member elected. Democratic gain. |
√ Wayne Owens (Democratic) 55.2% M. Tom Shimizu (Republican) 43.7% Stephen Carmichael Carr (Libertarian) 0.9% Scott Alan Breen (Socialist Workers) 0.1% |
| Utah 3 | Howard C. Nielson | Republican | 1982 | Incumbent re-elected. | √ Howard C. Nielson (Republican) 66.6% Dale F. Gardiner (Democratic) 32.7% David P. Hurst (Socialist Workers) 0.7% |
Vermont
| District | Incumbent | Party | First elected |
Result | Candidates |
|---|---|---|---|---|---|
| Vermont at-large | Jim Jeffords | Republican | 1974 | Incumbent re-elected. | √ Jim Jeffords (Republican) 89.2% John T. McNulty (Pro-Life) 3.9% Peter Diamondstone (Liberty) 3.7% Morris Earle (Independent) 3.1% |
Virginia
| District | Incumbent | Party | First elected |
Result | Candidates |
|---|---|---|---|---|---|
| Virginia 1 | Herbert H. Bateman | Republican | 1982 | Incumbent re-elected. | √ Herbert H. Bateman (Republican) 56.0% Robert C. Scott (Democratic) 44.0% |
| Virginia 2 | G. William Whitehurst | Republican | 1968 | Incumbent retired. New member elected. Democratic gain. |
√ Owen B. Pickett (Democratic) 49.5% A. J. "Joe" Canada Jr. (Republican) 41.9% Stephen P. Shao (Independent) 8.6% |
| Virginia 3 | Thomas J. Bliley Jr. | Republican | 1980 | Incumbent re-elected. | √ Thomas J. Bliley Jr. (Republican) 67.0% Kenneth E. Powell (Democratic) 29.7% J. Stephen Hodges (Independent) 3.3% |
| Virginia 4 | Norman Sisisky | Democratic | 1982 | Incumbent re-elected. | √ Norman Sisisky (Democratic) Unopposed |
| Virginia 5 | Dan Daniel | Democratic | 1968 | Incumbent re-elected. | √ Dan Daniel (Democratic) 81.5% Frank Cole (Independent) 18.5% |
| Virginia 6 | Jim Olin | Democratic | 1982 | Incumbent re-elected. | √ Jim Olin (Democratic) 69.9% Flo Neher Traywick (Republican) 30.1% |
| Virginia 7 | D. French Slaughter Jr. | Republican | 1984 | Incumbent re-elected. | √ D. French Slaughter Jr. (Republican) Unopposed |
| Virginia 8 | Stanford E. Parris | Republican | 1980 | Incumbent re-elected. | √ Stanford E. Parris (Republican) 61.8% James H. Boren (Democratic) 38.2% |
| Virginia 9 | Rick Boucher | Democratic | 1982 | Incumbent re-elected. | √ Rick Boucher (Democratic) Unopposed |
| Virginia 10 | Frank Wolf | Republican | 1980 | Incumbent re-elected. | √ Frank Wolf (Republican) 60.2% John G. Milliken (Democratic) 39.8% |
Washington
| District | Incumbent | Party | First elected |
Result | Candidates |
|---|---|---|---|---|---|
| Washington 1 | John Miller | Republican | 1984 | Incumbent re-elected. | √ John Miller (Republican) 51.4% Reese M. Lindquist (Democratic) 48.6% |
| Washington 2 | Al Swift | Democratic | 1978 | Incumbent re-elected. | √ Al Swift (Democratic) 72.2% Thomas S. Talman (Republican) 27.8% |
| Washington 3 | Don Bonker | Democratic | 1974 | Incumbent re-elected. | √ Don Bonker (Democratic) 73.6% Joseph R. Illing (Republican) 26.4% |
| Washington 4 | Sid Morrison | Republican | 1980 | Incumbent re-elected. | √ Sid Morrison (Republican) 72.1% Robert Goedecke (Democratic) 27.9% |
| Washington 5 | Tom Foley | Democratic | 1964 | Incumbent re-elected. | √ Tom Foley (Democratic) 74.7% Floyd Lee Wakefield (Republican) 25.3% |
| Washington 6 | Norman D. Dicks | Democratic | 1976 | Incumbent re-elected. | √ Norman D. Dicks (Democratic) 71.2% Kenneth W. Braaten (Republican) 28.8% |
| Washington 7 | Mike Lowry | Democratic | 1978 | Incumbent re-elected. | √ Mike Lowry (Democratic) 72.6% Don McDonald (Republican) 27.4% |
| Washington 8 | Rod Chandler | Republican | 1982 | Incumbent re-elected. | √ Rod Chandler (Republican) 65.2% David E. Giles (Democratic) 34.8% |
West Virginia
| District | Incumbent | Party | First elected |
Result | Candidates |
|---|---|---|---|---|---|
| West Virginia 1 | Alan Mollohan | Democratic | 1982 | Incumbent re-elected. | √ Alan Mollohan (Democratic) Unopposed |
| West Virginia 2 | Harley O. Staggers Jr. | Democratic | 1982 | Incumbent re-elected. | √ Harley O. Staggers Jr. (Democratic) 69.5% Michele Golden (Republican) 30.5% |
| West Virginia 3 | Bob Wise | Democratic | 1982 | Incumbent re-elected. | √ Bob Wise (Democratic) 64.9% Tim Sharp (Republican) 35.1% |
| West Virginia 4 | Nick Rahall | Democratic | 1976 | Incumbent re-elected. | √ Nick Rahall (Democratic) 71.3% Martin Miller Sr. (Republican) 28.7% |
Wisconsin
| District | Incumbent | Party | First elected |
Result | Candidates |
|---|---|---|---|---|---|
| Wisconsin 1 | Les Aspin | Democratic | 1970 | Incumbent re-elected. | √ Les Aspin (Democratic) 74.3% Iris Peterson (Republican) 24.1% John Graf (Lab) 1.6% |
| Wisconsin 2 | Robert W. Kastenmeier | Democratic | 1958 | Incumbent re-elected. | √ Robert W. Kastenmeier (Democratic) 55.5% Ann J. Haney (Republican) 44.2% Syed Ameen (Independent) 0.2% |
| Wisconsin 3 | Steve Gunderson | Republican | 1980 | Incumbent re-elected. | √ Steve Gunderson (Republican) 64.1% Leland E. Mulder (Democratic) 35.9% |
| Wisconsin 4 | Jerry Kleczka | Democratic | 1984 | Incumbent re-elected. | √ Jerry Kleczka (Democratic) Unopposed |
| Wisconsin 5 | Jim Moody | Democratic | 1982 | Incumbent re-elected. | √ Jim Moody (Democratic) Unopposed |
| Wisconsin 6 | Tom Petri | Republican | 1979 | Incumbent re-elected. | √ Tom Petri (Republican) 96.7% John Richard Daggett (Independent) 3.3% |
| Wisconsin 7 | Dave Obey | Democratic | 1969 | Incumbent re-elected. | √ Dave Obey (Democratic) 62.1% Kevin J. Hermening (Republican) 36.9% Joseph D. Damrell (Lab) 0.9% |
| Wisconsin 8 | Toby Roth | Republican | 1978 | Incumbent re-elected. | √ Toby Roth (Republican) 67.4% Paul Willems (Democratic) 32.6% |
| Wisconsin 9 | Jim Sensenbrenner | Republican | 1978 | Incumbent re-elected. | √ Jim Sensenbrenner (Republican) 78.2% Thomas G. Popp (Democratic) 21.8% |
Wyoming
| District | Incumbent | Party | First elected |
Result | Candidates |
|---|---|---|---|---|---|
| Wyoming at-large | Dick Cheney | Republican | 1978 | Incumbent re-elected. | √ Dick Cheney (Republican) 69.5% Rick Gilmore (Democratic) 30.5% |