United States Senate elections, 1986
|
| ||||||||||||||||||||||||||||||||||||||||
| ||||||||||||||||||||||||||||||||||||||||
Class 3 (34 of the 100) seats in the United States Senate 51 seats needed for a majority | ||||||||||||||||||||||||||||||||||||||||
|---|---|---|---|---|---|---|---|---|---|---|---|---|---|---|---|---|---|---|---|---|---|---|---|---|---|---|---|---|---|---|---|---|---|---|---|---|---|---|---|---|
| ||||||||||||||||||||||||||||||||||||||||
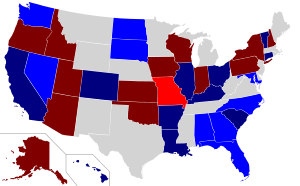 Results Democratic gain Democratic hold Republican gain Republican hold | ||||||||||||||||||||||||||||||||||||||||
| ||||||||||||||||||||||||||||||||||||||||

.jpg)
The United States Senate elections, 1986 was an election for the United States Senate in the middle of Ronald Reagan's second presidential term. The Republicans had to defend an unusually large number of freshman Senate incumbents who had been elected on President Ronald Reagan's coattails in 1980. Democrats won a net of eight seats, defeating seven freshman incumbents and regaining control of the Senate for the first time since January 1981. The party not controlling the presidency gained seats, as usually occurs in mid-term elections.
Results summary
| 55 | 45 |
| Democratic | Republican |
Shading indicates party with largest share of that line.
| Parties | Total | |||||||
|---|---|---|---|---|---|---|---|---|
| Democratic | Republican | Conservative | Independent | Libertarian | Other | |||
| Last election: 1984 | 47 | 53 | 0 | 0 | 0 | 0 | 100 | |
| Before this election | 47 | 53 | 0 | 0 | 0 | 0 | 100 | |
| Not up | 35 | 31 | 0 | 0 | 0 | 0 | 66 | |
| Up | 12 | 22 | 0 | 0 | 0 | 0 | 34 | |
| Incumbent retired |
Replaced by other party | 2 | 1 | — | — | — | — | 3 |
| Held by same party | 1 | 2 | — | — | — | — | 3 | |
| Incumbent ran |
Won re-election | 9 | 12 | — | — | — | — | 21 |
| Lost re-election | 0 | 7 | — | — | — | — | 7 | |
| Lost renomination, but held by same party |
0 | 0 | — | — | — | — | 0 | |
| Summary | Total won | 11 | 13 | — | — | — | — | 24 |
| Total lost | 1 | 9 | — | — | — | — | 9 | |
| Total picked-up | 9 | 1 | — | — | — | — | 10 | |
| Change | ||||||||
| Elected | 20 | 14 | 0 | 0 | 0 | 0 | 34 | |
| Popular vote |
Votes | 24,347,369 | 23,126,219 | 212,101 | 155,032 | 104,338 | 665,946 | 48,611,005 |
| Share | 50.1% | 47.6% | 0.4% | 0.3% | 0.2% | 1.4% | 100% | |
| Result | 55 | 45 | 0 | 0 | 0 | 0 | 100 | |
Democratic gains
Democrats gained a net of eight seats, and recaptured control of the Senate from the Republicans with a 55–45 majority. Robert Dole (R-Kansas) and Robert C. Byrd (D-West Virginia) exchanged positions as the Majority Leader and the Minority Leader.
This was the last election — until 2016 — in which the Democrats in this Class of Senators (1/3 of the Senate) amassed a gain in seats (not including special elections held in off-years in some states to fill the seats that had been vacated by Senators due to death, resignation, or otherwise).
Republican gain
The only gain by the Republican Party was for one "open seat" in Missouri. On the other hand, the Democratic Party gained the "open seats" in Maryland and Nevada, and the Democrats also defeated seven incumbent Republican Senators, six of them who were first-term senators who had been elected in 1980.
Incumbents who lost re-election
- Jeremiah Denton (R-Alabama)
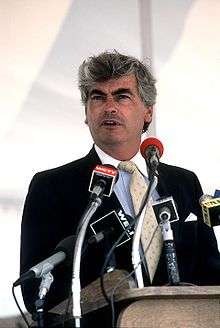
- Paula Hawkins (R-Florida)
- Mack Mattingly (R-Georgia)
- James T. Broyhill (R-North Carolina). Broyhill was the only Republican who was defeated who had not been elected for the first time in 1980. However, Broyhill had been appointed to the seat that had been left vacant by the suicide of John P. East, a Republican who had been elected in 1980.
- Mark Andrews (R-North Dakota)
- James Abdnor (R-South Dakota)
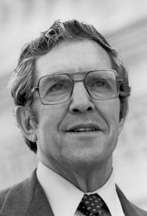
- Slade Gorton (R-Washington).
Change in Senate composition
Before the elections
| D1 | D2 | D3 | D4 | D5 | D6 | D7 | D8 | D9 | D10 |
| D20 | D19 | D18 | D17 | D16 | D15 | D14 | D13 | D12 | D11 |
| D21 | D22 | D23 | D24 | D25 | D26 | D27 | D28 | D29 | D30 |
| D40 Ran |
D39 Ran |
D38 Ran |
D37 Ran |
D36 Ran |
D35 | D34 | D33 | D32 | D31 |
| D41 Ran |
D42 Ran |
D43 Ran |
D44 Ran |
D45 Ran |
D46 Ran |
D47 Ran |
R53 Ran |
R52 Ran |
R51 Ran |
| Majority → | |||||||||
| R41 Ran |
R42 Ran |
R43 Ran |
R44 Ran |
R45 Ran |
R46 Ran |
R47 Ran |
R48 Ran |
R49 Ran |
R50 Ran |
| R40 Ran |
R39 Ran |
R38 Ran |
R37 Ran |
R36 Ran |
R35 Ran |
R34 Ran |
R33 Ran |
R32 Ran |
R31 Ran |
| R21 | R22 | R23 | R24 | R25 | R26 | R27 | R28 | R29 | R30 Ran |
| R20 | R19 | R18 | R17 | R16 | R15 | R14 | R13 | R12 | R11 |
| R1 | R2 | R3 | R4 | R5 | R6 | R7 | R8 | R9 | R10 |
After the elections
| D1 | D2 | D3 | D4 | D5 | D6 | D7 | D8 | D9 | D10 |
| D20 | D19 | D18 | D17 | D16 | D15 | D14 | D13 | D12 | D11 |
| D21 | D22 | D23 | D24 | D25 | D26 | D27 | D28 | D29 | D30 |
| D40 Re-elected |
D39 Re-elected |
D38 Re-elected |
D37 Re-elected |
D36 Re-elected |
D35 | D34 | D33 | D32 | D31 |
| D41 Re-elected |
D42 Re-elected |
D43 Re-elected |
D44 Re-elected |
D45 Hold |
D46 Hold |
D47 Gain |
D48 Gain |
D49 Gain |
D50 Gain |
| Majority → | D51 Gain | ||||||||
| R41 Re-elected |
R42 Re-elected |
R43 Re-elected |
R44 Hold |
R45 Gain |
D55 Gain |
D54 Gain |
D53 Gain |
D52 Gain | |
| R40 Re-elected |
R39 Re-elected |
R38 Re-elected |
R37 Re-elected |
R36 Re-elected |
R35 Re-elected |
R34 Re-elected |
R33 Re-elected |
R32 Re-elected |
R31 Re-elected |
| R21 | R22 | R23 | R24 | R25 | R26 | R27 | R28 | R29 | R30 Re-elected |
| R20 | R19 | R18 | R17 | R16 | R15 | R14 | R13 | R12 | R11 |
| R1 | R2 | R3 | R4 | R5 | R6 | R7 | R8 | R9 | R10 |
| Key: |
|
|---|
Race summary
Special election during the 99th Congress
In this special election, the winner was seated during 1986.
| State (linked to summaries below) |
Incumbent | Results | Candidates | ||
|---|---|---|---|---|---|
| Senator | Party | Electoral history | |||
| North Carolina (Class 3) |
Jim Broyhill | Republican | 1986 (Appointed) | Interim appointee lost election to finish term. New senator elected November 4, 1986. Democratic gain. Winner also elected to the next term, see below. |
√ Terry Sanford (Democratic) 50.9% Jim Broyhill (Republican) 49.1% |
Elections leading to the next Congress
In these general elections, the winners were elected for the term beginning January 3, 1987; ordered by state.
All of the elections involved the Class 3 seats.
| State (linked to summaries below) |
Incumbent | Results | Candidates | ||
|---|---|---|---|---|---|
| Senator | Party | Electoral history | |||
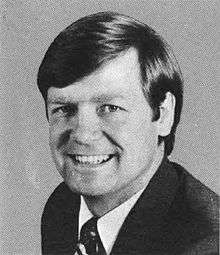
| Alabama | Jeremiah Denton | Republican | 1980 | Incumbent lost re-election. New senator elected. Democratic gain. |
√ Richard Shelby (Democratic) 50.9% Jeremiah Denton (Republican) 49.1% |
| Alaska | Frank Murkowski | Republican | 1980 | Incumbent re-elected. | √ Frank Murkowski (Republican) 54.0% Glenn Olds (Democratic) 44.1% Chuck House (Libertarian) 1.7% |
| Arizona | Barry Goldwater | Republican | 1952 1958 1964 (Retired) 1968 1974 1980 |
Incumbent retired. New senator elected. Republican hold. |
√ John McCain (Republican) 60.6% Richard Kimball (Democratic) 39.4% |
| Arkansas | Dale Bumpers | Democratic | 1974 1980 |
Incumbent re-elected. | √ Dale Bumpers (Democratic) 62.9% Asa Hutchinson (Republican) 37.1% |
| California | Alan Cranston | Democratic | 1968 1974 1980 |
Incumbent re-elected. | √ Alan Cranston (Democratic) 49.3% Ed Zschau (Republican) 47.8% Breck McKinley (Libertarian) 1.5% Edward B. Vallen (American Ind.) 0.9% Andrew R. Kangas (Peace & Freedom) 0.5% |
| Colorado | Gary Hart | Democratic | 1974 1980 |
Incumbent retired. New senator elected. Democratic hold. |
√ Tim Wirth (Democratic) 49.9% Ken Kramer (Republican) 48.4% Michael Bush (Independent) 1.0% Michael Chamberlain (Socialist Workers) 0.4% Henry Olshaw (Unaffiliated American) 0.2% Calvin Dodge (Prohibition) 0.1% |
| Connecticut | Chris Dodd | Democratic | 1980 | Incumbent re-elected. | √ Chris Dodd (Democratic) 64.8% Roger W. Eddy (Republican) 34.8% Edward McCallum (Independent) 0.4% |
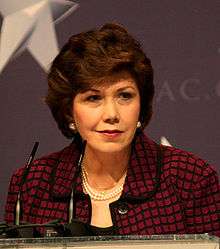
| Florida | Paula Hawkins | Republican | 1980 | Incumbent lost re-election. New senator elected. Democratic gain. |
√ Bob Graham (Democratic) 55% Paula Hawkins (Republican) 45% |
| Georgia | Mack Mattingly | Republican | 1980 | Incumbent lost re-election. New senator elected. Democratic gain. |
√ Wyche Fowler (Democratic) 50.9% Mack Mattingly (Republican) 49.1% |
| Hawaii | Daniel Inouye | Democratic | 1962 1968 1974 1980 |
Incumbent re-elected. | √ Daniel Inouye (Democratic) 73.6% Frank Hutchinson (Republican) 26.4% |
| Idaho | Steve Symms | Republican | 1980 | Incumbent re-elected. | √ Steve Symms (Republican) 51.4% John V. Evans (Democratic) 48.6% |
| Illinois | Alan J. Dixon | Democratic | 1980 | Incumbent re-elected. | √ Alan J. Dixon (Democratic) 65.4% Judy Koehler (Republican) 34.1% |
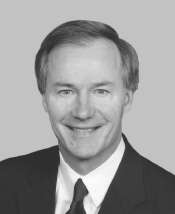
| Indiana | Dan Quayle | Republican | 1980 | Incumbent re-elected. | √ Dan Quayle (Republican) 61.1% Jill L. Long (Democratic) 38.9% |
| Iowa | Chuck Grassley | Republican | 1980 | Incumbent re-elected. | √ Chuck Grassley (Republican) 66.0% John P. Roehrick (Democratic) 34.0% |
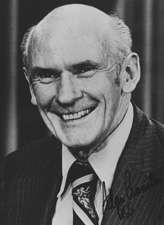
| Kansas | Bob Dole | Republican | 1968 1974 1980 |
Incumbent re-elected. | √ Bob Dole (Republican) 70.1% Guy MacDonald (Democratic) 29.9% |
| Kentucky | Wendell H. Ford | Democratic | 1974 1980 |
Incumbent re-elected. | √ Wendell H. Ford (Democratic) 74.3% Jackson M. Andrews (Republican) 25.7% |
| Louisiana | Russell B. Long | Democratic | 1948 (Special) 1950 1956 1962 1968 1974 1980 |
Incumbent retired. New senator elected. Democratic hold. |
√ John Breaux (Democratic) 52.8% Henson Moore (Republican) 47.2% |
| Maryland | Charles Mathias | Republican | 1968 1974 1980 |
Incumbent retired. New senator elected. Democratic gain. |
√ Barbara Mikulski (Democratic) 60.8% Linda Chavez (Republican) 39.2% |
| Missouri | Thomas Eagleton | Democratic | 1968 1974 1980 |
Incumbent retired. New senator elected. Republican gain. |
√ Kit Bond (Republican) 52.6% Harriett Woods (Democratic) 47.4% |
| Nevada | Paul Laxalt | Republican | 1974 1980 |
Incumbent retired. New senator elected. Democratic gain. |
√ Harry Reid (Democratic) 50.0% James David Santini (Republican) 44.5% Kent Cromwell (Libertarian) 1.9% |
| New Hampshire | Warren Rudman | Republican | 1980 | Incumbent re-elected. | √ Warren Rudman (Republican) 62.9% Endicott Peabody (Democratic) 32.4% Gruce Valley (Independent) 4.7% |
| New York | Al D'Amato | Republican | 1980 | Incumbent re-elected. | √ Al D'Amato (Republican) 57.7% Mark J. Green (Democratic) 40.9% John S. Dyson (Liberal) 1.4% Fred Newman (New Alliance) 0.3% Michael Shur (Socialist Workers) 0.2% |
| North Carolina | Jim Broyhill | Republican | 1986 (Appointed) | Interim appointee lost election to the next term. New senator elected. Democratic gain. Winner was also elected to finish the current term, see above. |
√ Terry Sanford (Democratic) 51.8% Jim Broyhill (Republican) 48.2% |
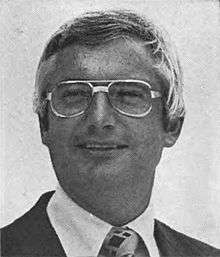
| North Dakota | Mark Andrews | Republican | 1980 | Incumbent lost re-election. New senator elected. Democratic gain. |
√ Kent Conrad (Democratic) 49.8% Mark Andrews (Republican) 49.0% |
| Ohio | John Glenn | Democratic | 1974 1974 (Appointed) 1980 |
Incumbent re-elected. | √ John Glenn (Democratic) 62.4% Tom Kindness (Republican) 37.6% |
| Oklahoma | Don Nickles | Republican | 1980 | Incumbent re-elected. | √ Don Nickles (Republican) 54.5% James R. Jones (Democratic) 45.5% |
| Oregon | Bob Packwood | Republican | 1968 1974 1980 |
Incumbent re-elected. | √ Bob Packwood (Republican) 63.5% Rick Bauman (Democratic) 36.5% |
| Pennsylvania | Arlen Specter | Republican | 1980 | Incumbent re-elected. | √ Arlen Specter (Republican) 56.9% Robert W. Edgar (Democratic) 43.1% |
| South Carolina | Ernest Hollings | Democratic | 1966 (Special) 1968 1974 1980 |
Incumbent re-elected. | √ Ernest Hollings (Democratic) 63.9% Henry D. McMaster (Republican) 36.1% |
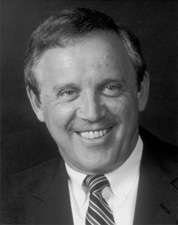
| South Dakota | James Abdnor | Republican | 1980 | Incumbent lost re-election. New senator elected. Democratic gain. |
√ Tom Daschle (Democratic) 51.6% James Abdnor (Republican) 48.4% |
| Utah | Jake Garn | Republican | 1974 1980 |
Incumbent re-elected. | √ Jake Garn (Republican) 72.3% Craig Oliver (Democratic) 26.6% Hugh A. Butler (Libertarian) 0.7% Mary Zins (Independent) 0.4% |
| Vermont | Patrick Leahy | Democratic | 1974 1980 |
Incumbent re-elected. | √ Patrick Leahy (Democratic) 63.7% Richard A. Snelling (Republican) 34.7% |
| Washington | Slade Gorton | Republican | 1980 | Incumbent lost re-election. New senator elected. Democratic gain. |
√ Brock Adams (Democratic) 50.6% Slade Gorton (Republican) 48.7% Jill Fein (Socialist Workers) 0.7% |
| Wisconsin | Bob Kasten | Republican | 1980 | Incumbent re-elected. | √ Bob Kasten (Republican) 51.8% Ed Garvey (Democratic) 48.2% |
Special elections during the 100th Congress
There were no special elections in 1987 after January 3.
Alabama
|
| |||||||||||||||||
| |||||||||||||||||
| |||||||||||||||||
Incumbent Republican Jeremiah Denton ran for a second term but lost to Democrat Richard Shelby.
Shelby, a moderate-to-conservative Democrat avoided a primary runoff and won nomination in the Democratic Party primary.[1]
| Party | Candidate | Votes | % | |
|---|---|---|---|---|
| Democratic | Richard Shelby | 420,155 | 51.33% | |
| Democratic | Jim Allen, Jr. | 284,206 | 34.72% | |
| Democratic | Ted McLaughlin | 70,784 | 8.65% | |
| Democratic | Margaret Stewart | 26,723 | 3.27% | |
| Democratic | Steve Arnold | 16,722 | 2.04% | |
| Total votes | 818,590 | 100.00% | ||
Incumbent Senator Jeremiah Denton, a retired Rear Admiral and decorated Vietnam War veteran who six years earlier became the first Republican elected to the Senate from Alabama since Reconstruction, won the Republican primary with little opposition.[2]
| Party | Candidate | Votes | % | |
|---|---|---|---|---|
| Republican | Jeremiah Denton | 29,805 | 88.55% | |
| Republican | Richard Vickers | 3,854 | 11.45% | |
| Total votes | 33,659 | 100.00% | ||
Shelby won a very narrow victory over Denton (less than one percent).[3]
- Shelby - 609,360 (50.28%)
- Denton - 602,537 (49.72%)
Alaska
|
| |||||||||||||||||
| |||||||||||||||||
| |||||||||||||||||

Incumbent Republican Frank Murkowski ran for a second term and was primarily opposed by Alaska Pacific University President Glenn Olds and Libertarian Chuck House, field representative for Eastman Kodak Company. Following a highly competitive election in 1980, Murkowski faced a legitimate opponent in Glenn Olds, and the contest was fairly close. However, in the end, Murkowski was able to defeat Olds by a slightly wider margin than he won by six years prior.
| Party | Candidate | Votes | % | |
|---|---|---|---|---|
| Republican | Frank Murkowski (inc.) | 91,705 | 63.11% | |
| Democratic | Glenn Olds | 36,995 | 25.46% | |
| Democratic | Bill Barnes | 4,871 | 3.35% | |
| Libertarian | Chuck House | 4,265 | 2.94% | |
| Democratic | Dave J. Carlson | 4,211 | 2.90% | |
| Democratic | Michael J. Bruner | 1,809 | 1.24% | |
| Democratic | Karl Francis | 1,454 | 1.00% | |
| Total votes | 145,310 | 100.00% | ||
| Party | Candidate | Votes | % | ± | |
|---|---|---|---|---|---|
| Republican | Frank Murkowski (Incumbent) | 97,674 | 54.02% | +0.34% | |
| Democratic | Glenn Olds | 79,727 | 44.10% | -1.84% | |
| Libertarian | Chuck House | 3,161 | 1.75% | ||
| Write-ins | 239 | 0.13% | |||
| Majority | 17,947 | 9.93% | +2.17% | ||
| Turnout | 180,801 | ||||
| Republican hold | Swing | ||||
Arizona
|
| |||||||||||||||||
| |||||||||||||||||
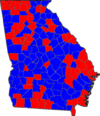
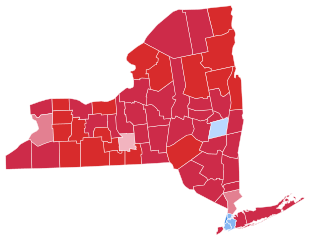
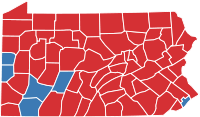
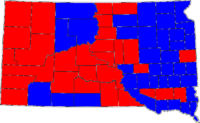
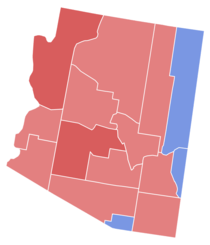 U.S. Senate election results map. Red denotes counties won by McCain. Blue denotes those won by Kimball. | |||||||||||||||||
| |||||||||||||||||


Incumbent Republican Barry Goldwater decided to retire instead of seeking a sixth term. The open seat was won by Republican John McCain, a Congressman and former Navy Officer who beat Democratic State Legislator Richard Kimball.
Kimball's campaign was subject to negative press from the Arizona Republic and Phoenix Gazette, both owned by McCain benefactor Darrow Tully. One Gazette columnist described him as displaying "terminal weirdness."[6] McCain ultimately won the election by a margin of 20%.[5]</ref>
| Party | Candidate | Votes | % | ± | |
|---|---|---|---|---|---|
| Republican | John McCain | 521,850 | 60.47% | +11.02% | |
| Democratic | Richard Kimball | 340,965 | 39.51% | -8.87% | |
| Write-ins | 106 | 0.01% | |||
| Majority | 180,885 | 20.96% | +19.89% | ||
| Turnout | 862,921 | ||||
| Republican hold | Swing | ||||
Arkansas
|
| |||||||||||||||||
| |||||||||||||||||
| |||||||||||||||||
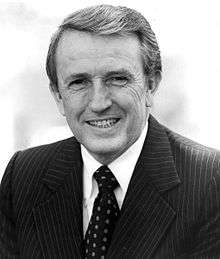
Incumbent Democrat Dale Bumpers won re-election to a third term over Republican U.S. Attorney Asa Hutchinson.
| Party | Candidate | Votes | % | |
|---|---|---|---|---|
| Democratic | Dale Bumpers (Incumbent) | 433,122 | 62.3% | |
| Republican | Asa Hutchinson | 262,313 | 37.7% | |
| Independent | Ralph Forbes | 52 | 0.1% | |
California
|
| |||||||||||||||||
| |||||||||||||||||
| |||||||||||||||||
Incumbent Democratic Alan Cranston narrowly won re-election to a fourth term over Republican Ed Zschau, U.S. Congressman from the 12th district.
| Party | Candidate | Votes | % | |
|---|---|---|---|---|
| Democratic | Alan Cranston (Incumbent) | 3,646,672 | 49.3% | |
| Republican | Ed Zschau | 3,541,804 | 47.9% | |
| American Independent | Edward B Vallen | 109,916 | 1.5% | |
| Libertarian | Breck McKinley | 66,261 | 0.9% | |
| Peace and Freedom | Paul Kangas | 33,869 | 0.5% | |
Colorado
|
| |||||||||||||||||
| |||||||||||||||||
| |||||||||||||||||
Incumbent Democrat Gary Hart retired instead of seeking a third term. Democratic nominee Tim Wirth won the open seat over Republican U.S. Representative Ken Kramer.
| Party | Candidate | Votes | % | ± | |
|---|---|---|---|---|---|
| Democratic | Tim Wirth | 529,449 | 49.91% | -0.42% | |
| Republican | Ken Kramer | 512,994 | 48.36% | -0.34% | |
| Independent | Michael Martin Bush | 11,127 | 1.05% | ||
| Socialist Workers | Michael R. Chamberlain | 3,756 | 0.35% | ||
| Independent American | Henry John Olshaw | 1,868 | 0.18% | -0.17% | |
| Prohibition | Calvin G. Dodge | 1,571 | 0.15% | ||
| Majority | 16,455 | 1.55% | -0.09% | ||
| Turnout | 1,060,765 | ||||
| Democratic hold | Swing | ||||
Connecticut
|
| |||||||||||||||||
| |||||||||||||||||
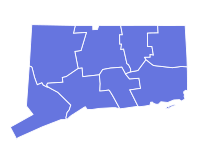 County Results | |||||||||||||||||
| |||||||||||||||||
Incumbent Democrat Chris Dodd won re-election to a second term over Republican Roger Eddy of the Republican National Committee[9]
| Party | Candidate | Votes | % | |
|---|---|---|---|---|
| Democratic | Christ Dodd (Incumbent) | 632,695 | 64.8% | |
| Republican | Roger Eddy | 340,438 | 34.9% | |
| Independent | Edward J. McCallum, Jr. | 3,800 | 0.4% | |
Florida
|
| |||||||||||||||||
| |||||||||||||||||
| |||||||||||||||||
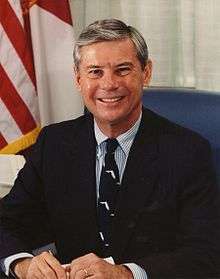
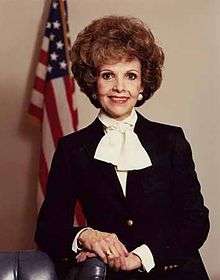
Incumbent Republican Paula Hawkins decided to run for re-election to second term, but lost to popular Governor of Florida Bob Graham.[5]
| Party | Candidate | Votes | % | |
|---|---|---|---|---|
| Democratic | Bob Graham | 850,560 | 85.04% | |
| Democratic | Bob Kunst | 149,657 | 14.96% | |
| Total votes | 1,000,217 | 100.00% | ||
| Party | Candidate | Votes | % | |
|---|---|---|---|---|
| Republican | Paula Hawkins (Incumbent) | 491,767 | 88.73% | |
| Republican | Jon Larsen Shudlick | 62,443 | 11.27% | |
| Total votes | 554,210 | 100.00% | ||
| Party | Candidate | Votes | % | ± | |
|---|---|---|---|---|---|
| Democratic | Bob Graham | 1,877,543 | 54.74% | +6.40% | |
| Republican | Paula Hawkins (Incumbent) | 1,552,376 | 45.26% | -6.40% | |
| Write-ins | 77 | 0.00% | |||
| Majority | 325,167 | 9.48% | +6.16% | ||
| Turnout | 3,429,996 | ||||
| Democratic gain from Republican | Swing | ||||
Georgia
|
| |||||||||||||||||
| |||||||||||||||||
 County Results | |||||||||||||||||
| |||||||||||||||||

Incumbent Republican Mack Mattingly decided to run for re-election and lost a close race to Democratic U.S. Congressman Wyche Fowler.[5]
| Party | Candidate | Votes | % | ± | |
|---|---|---|---|---|---|
| Democratic | Wyche Fowler | 623,707 | 50.91% | +1.78% | |
| Republican | Mack Mattingly (Incumbent) | 601,241 | 49.08% | -1.79% | |
| Write-In Votes | 60 | 0.00% | N/A | ||
| Majority | 22,466 | 1.83% | +.09% | ||
| Turnout | 1,225,008 | ||||
| Democratic gain from Republican | Swing | 1.78% | |||
Hawaii
Idaho
|
| |||||||||||||||||
| |||||||||||||||||
| |||||||||||||||||
Incumbent Republican Steve Symms won re-election to a second term over Democratic Governor John V. Evans.
| Party | Candidate | Votes | % | ± | |
|---|---|---|---|---|---|
| Republican | Steve Symms (Incumbent) | 196,958 | 51.56% | +1.81% | |
| Democratic | John V. Evans | 185,066 | 48.44% | -0.33% | |
| Majority | 11,892 | 3.11% | +2.14% | ||
| Turnout | 382,024 | ||||
| Republican hold | Swing | ||||
Illinois
|
| |||||||||||||||||
| |||||||||||||||||
 County Results | |||||||||||||||||
| |||||||||||||||||
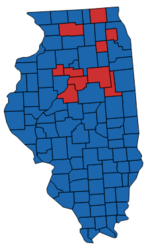
The incumbent Democratic Alan J. Dixon won re-election to a second term over Republican State Representative Judy Koehler. This is also the last time as of 2016 that a winning Senate Candidate was elected to this seat twice.
Dixon easily won the senate race. Koehler fared poorly throughout most parts of the state, only winning 10 of the states 102 counties.
| Party | Candidate | Votes | % | ± | |
|---|---|---|---|---|---|
| Democratic | Alan J. Dixon (Incumbent) | 2,033,783 | 65.1% | +9.1% | |
| Republican | Judy Koehler | 1,053,734 | 33.7% | -8.8% | |
| Independent | Einar V. Dyhrkopp | 15,804 | 0.5% | ||
| Libertarian | Donald M. Parrish, Jr. | 13,891 | 0.5% | ||
| Socialist Workers | Omari Musa | 5,671 | 0.2% | ||
Indiana
|
| |||||||||||||||||
| |||||||||||||||||
| |||||||||||||||||
Incumbent Republican Dan Quayle won re-election to a second term over Democratic Valparaiso City Councilwoman Jill L. Long.[14]
| Party | Candidate | Votes | % | |
|---|---|---|---|---|
| Republican | Dan Quayle (Incumbent) | 936,143 | 60.57% | |
| Democratic | Jill L. Long | 595,192 | 38.51% | |
| Libertarian | Bradford Warren | 8,314 | 0.54% | |
| American | Rockland Snyder | 5,914 | 0.38% | |
| Majority | 340,951 | 22.06% | ||
| Turnout | 1,545,563 | |||
Iowa
|
| |||||||||||||||||
| |||||||||||||||||
| |||||||||||||||||
Incumbent Republican Chuck Grassley ran for re-election to a second term, which he won easily over Democratic nominee John P. Roehrick, an attorney.
| Party | Candidate | Votes | % | |
|---|---|---|---|---|
| Democratic | John P. Roehrick | 88,347 | 83.83% | |
| Democratic | Juan Cortez | 16,987 | 16.12% | |
| Democratic | Write-ins | 60 | 0.06% | |
| Total votes | 105,394 | 100.00% | ||
| Party | Candidate | Votes | % | |
|---|---|---|---|---|
| Republican | Chuck Grassley (Incumbent) | 108,370 | 99.96% | |
| Republican | Write-ins | 38 | 0.04% | |
| Total votes | 108,408 | 100.00% | ||
| Party | Candidate | Votes | % | ± | |
|---|---|---|---|---|---|
| Republican | Chuck Grassley (Incumbent) | 588,880 | 66.04% | +12.55% | |
| Democratic | John P. Roehrick | 299,406 | 33.57% | -11.97% | |
| Independent | John Masters | 3,370 | 0.38% | ||
| Write-ins | 106 | 0.01% | |||
| Majority | 289,474 | 32.46% | +24.51% | ||
| Turnout | 891,762 | ||||
| Republican hold | Swing | ||||
Kansas
Kentucky
Louisiana
Maryland
|
| |||||||||||||||||
| |||||||||||||||||
| |||||||||||||||||
Incumbent Republican Charles Mathias, Jr. decided to retire, instead of seeking a fourth term. Democratic Congresswoman Barbara Mikulski defeated Republican Reagan Administration official Linda Chavez for the open seat.
| Party | Candidate | Votes | % | |
|---|---|---|---|---|
| Democratic | Barbara A. Mikulski | 307,876 | 49.50% | |
| Democratic | Michael D. Barnes | 195,086 | 31.37% | |
| Democratic | Harry Hughes | 88,908 | 14.30% | |
| Democratic | Debra Hanania Freeman | 9,350 | 1.50% | |
| Democratic | Edward M. Olszewski | 7,877 | 1.27% | |
| Democratic | A. Robert Kaufman | 6,505 | 1.05% | |
| Democratic | Boyd E. Sweatt | 3,580 | 0.58% | |
| Democratic | Leonard E. Trout, Jr. | 2,742 | 0.44% | |
| Total votes | 621,924 | 100.00% | ||
| Party | Candidate | Votes | % | |
|---|---|---|---|---|
| Republican | Linda Chavez | 100,888 | 73.07% | |
| Republican | Michael Schaefer | 16,902 | 12.24% | |
| Republican | George Haley | 5,808 | 4.21% | |
| Republican | Melvin Perkins | 2,785 | 2.02% | |
| Republican | Nicholas T. Nonnenmacher | 2,751 | 1.99% | |
| Republican | Richard Sullivan | 2,328 | 1.69% | |
| Republican | Howard D. Greyber | 1,678 | 1.22% | |
| Republican | Monroe Cornish | 1,497 | 1.08% | |
| Republican | Herbert Stone Rosenberg | 1,337 | 0.97% | |
| Republican | Horace Stuart Rich | 1,199 | 0.87% | |
| Republican | Abraham H. Kalish | 901 | 0.65% | |
| Total votes | 138,074 | 100.00% | ||
Mathias announced his retirement from politics. At the time of this announcement, it was expected that then-Governor Harry Hughes would run for the seat being vacated by retiring Senator Mathias. However, Hughes became caught up in the aftermath of the Maryland savings and loan crisis. He lost popularity with voters, opening the door for Mikulski's bid for the Senate.
Chavez won the primary handily, defeating several Republican challengers. Later, she made comments that some Mikulski supporters interpreted as an attempt to draw attention to the issue of Mikulski's sexual orientation. In an article quoting Chavez's claim that Mikulski was a "San Francisco-style, George McGovern, liberal Democrat", the Washington Post reported that Chavez was directly implying that the never-married Mikulski was a lesbian. Chavez was accused of making Mikulski's sexual orientation a central issue of the political campaign. In defending her use of the phrase, Chavez stated the line "San Francisco Democrats" was a reference to Jeane Kirkpatrick's 1984 Republican National Convention "Blame America First" speech, in which Kirkpatrick coined the phrase "San Francisco Liberal.". The phrase "San Francisco liberal" was common at the time.
Mikulski never directly responded to the issue and eventually won the race with 61 percent of the vote. She was the first female Democrat elected to the U.S. Senate in her own right (not appointed or filling a seat of a deceased husband).
| Party | Candidate | Votes | % | ± | |
|---|---|---|---|---|---|
| Democratic | Barbara A. Mikulski | 675,225 | 60.69% | +26.85% | |
| Republican | Linda Chavez | 437,411 | 39.31% | -26.85% | |
| Majority | 237,814 | 21.37% | -10.96% | ||
| Total votes | 1,017,151 | 100.00% | |||
| Democratic gain from Republican | Swing | ||||
Missouri
|
| |||||||||||||||||
| |||||||||||||||||
| |||||||||||||||||

Incumbent Democrat Tom Eagleton decided to retire instead of seeking a fourth term. Republican Governor Kit Bond won the open seat, beating Democratic Lieutenant Governor Harriett Woods.
| Party | Candidate | Votes | % | |
|---|---|---|---|---|
| Republican | Kit Bond | 777,612 | 52.6% | |
| Democratic | Harriett Woods | 699,624 | 47.4% | |
Nevada
|
| |||||||||||||||||
| |||||||||||||||||
| |||||||||||||||||

Incumbent Republican Paul Laxalt decided to retire instead of seeking a third term. U.S. Representative Democratic nominee Harry Reid won the open seat over Republican former U.S. Representative James David Santini.[5]
| Party | Candidate | Votes | % | ± | |
|---|---|---|---|---|---|
| Democratic | Harry Reid | 130,955 | 50.00% | +12.61% | |
| Republican | Jim Santini | 116,606 | 44.52% | -14.01% | |
| None of These Candidates | 9,472 | 3.62% | +2.33% | ||
| Libertarian | Kent Cromwell | 4,899 | 1.87% | -0.94% | |
| Majority | 14,349 | 5.48% | -15.66% | ||
| Turnout | 261,932 | ||||
| Democratic gain from Republican | Swing | ||||
New Hampshire
|
| |||||||||||||||||
| |||||||||||||||||
| |||||||||||||||||
Incumbent Republican Warren Rudman won re-election to a second term, beating the Democratic former Governor of Massachusetts Endicott Peabody.
| Party | Candidate | Votes | % | |
|---|---|---|---|---|
| Republican | Warren Rudman (Incumbent) | 154,090 | 63.0% | |
| Democratic | Endicott Peabody | 79,222 | 32.4% | |
| Independent | Bruce Valley | 11,423 | 4.7% | |
New York
|
| |||||||||||||||||
| |||||||||||||||||
 County Results | |||||||||||||||||
| |||||||||||||||||

.jpg)
Incumbent Republican Al D'Amato won re-election to a second term over Democrat Mark Green, the Chief Speechwriter for U.S. Senator Gary Hart and former congressional candidate.
| Party | Candidate | Votes | % | |
|---|---|---|---|---|
| Republican | Al D'Amato (Incumbent) | 2,030,260 | ||
| Conservative (N.Y.) | Al D'Amato | 212,101 | ||
| Right to Life (N.Y.) | Al D'Amato | 135,386 | ||
| total | Al D'Amato | 2,378,197 | 56.9% | |
| Democratic | Mark Green | 1,723,216 | 41.2% | |
| Liberal (N.Y.) | John S. Dyson | 60,099 | 1.4% | |
| New Alliance | Fred Newman | 10,559 | 0.3% | |
| Socialist Workers | Michael Shur | 7,376 | 0.2% | |
| Others | 305,412 | |||
North Carolina
|
| |||||||||||||||||
| |||||||||||||||||
| |||||||||||||||||

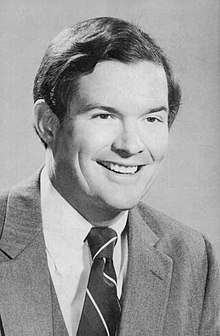
Incumbent Republican Jim Broyhill, who had been appointed in June 1986 to serve out the rest of John Porter East's term, faced off against the popular Democratic former Governor Terry Sanford. There were two separate elections held on the same day: a special election for what little remained of the 99th United States Congress (November 1986-January 1987) and a regular election for a new six-year term (beginning in January 1987).[19] Sanford won both elections.
The primary elections would nominate candidates to the special and the regular election.
Terry Sanford, then the outgoing president of Duke University, first said in September 1985 that he was planning to run for the U.S. Senate the next year but quickly withdrew, as it appeared that the party wanted a "fresh" face, most likely in the person of UNC System President William Friday.[20] Then, Friday declined to run, as did other well-known politicians like former Gov. Jim Hunt.[21] Former North Carolina Secretary of Commerce Lauch Faircloth then made it known that he would run, but he was considered too conservative by many party leaders, who encouraged Sanford to enter the race in order to defeat Faircloth.[20] Sanford agreed to run, which led Faircloth and another candidate, Judge Marvin K. Blount Jr., to withdraw before filing their candidacies. Six years later, Faircloth did run for the Senate against Sanford, but this time as a Republican.
Sen. East declined to run for a second term, citing his health. Longtime U.S. Representative Jim Broyhill entered the race with much of the establishment support, but David Funderburk had the backing of the organization of Senator Jesse Helms.[21] Funderburk charged Broyhill with being insufficiently conservative, but in the end, Broyhill won the nomination handily in the May primary. The next month, Sen. East committed suicide, and Gov. James G. Martin appointed Broyhill to his seat.
| Party | Candidate | Votes | % | |
|---|---|---|---|---|
| Democratic | Terry Sanford | 409,394 | 60.25% | |
| Democratic | John Ingram | 111,557 | 16.42% | |
| Democratic | Fountain Odom | 49,689 | 7.31% | |
| Democratic | William Belk | 33,821 | 4.98% | |
| Democratic | Theodore Kinney | 27,228 | 4.01% | |
| Democratic | Betty Wallace | 17,001 | 2.50% | |
| Democratic | Katherine Harper | 12,998 | 1.91% | |
| Democratic | Walt Atkins | 8,306 | 1.22% | |
| Democratic | Others | 9,493 | 1.40% | |
| Turnout | 679,487 | |||
| Party | Candidate | Votes | % | |
|---|---|---|---|---|
| Republican | Jim Broyhill | 139,570 | 66.52% | |
| Republican | David Funderburk | 63,593 | 30.31% | |
| Republican | Glenn Miller | 6,662 | 3.18% | |
| Turnout | 148,574 | |||
| Party | Candidate | Votes | % | ± | |
|---|---|---|---|---|---|
| Democratic | Terry Sanford | 823,662 | 51.76% | +2.38% | |
| Republican | Jim Broyhill (Incumbent) | 767,668 | 48.24% | -1.72% | |
| Turnout | 1,591,330 | ||||
North Carolina (Special)
|
| |||||||||||||||||
| |||||||||||||||||
| |||||||||||||||||
This was a special election for what little remained of the 99th United States Congress (November 1986-January 1987), being held contemporaneously with a regular election for a new six-year term (beginning in January 1987).[19] Sanford won both elections.
The primary elections would nominate candidates to the special and the regular election.
For background and primary election results, see the above section or United States Senate election in North Carolina, 1986.
| Party | Candidate | Votes | % | |
|---|---|---|---|---|
| Democratic | Terry Sanford | 780,967 | 50.88% | |
| Republican | Jim Broyhill (Incumbent) | 753,881 | 49.12% | |
| Turnout | 1,534,875 | |||
North Dakota
|
| |||||||||||||||||
| |||||||||||||||||
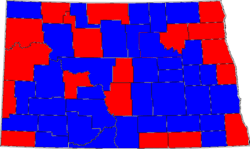 County results | |||||||||||||||||
| |||||||||||||||||

Incumbent Republican U.S. Senator Mark Andrews lost re-election to a second term to Dem-NPL nominee Kent Conrad, State Tax Commissioner. Andrews lost re-election by just over 2,000[5] votes after a rigorous campaign involving personal attacks and other strategies.
| Party | Candidate | Votes | % | |
|---|---|---|---|---|
| Democratic | Kent Conrad | 143,932 | 49.80% | |
| Republican | Mark Andrews (Incumbent) | 141,812 | 49.07% | |
| Independent | Anna B. Bourgois | 3,269 | 1.13% | |
| Majority | ||||
| Democratic gain from Republican | ||||
| Turnout | 289,013 | |||
Ohio
|
| |||||||||||||||||
| |||||||||||||||||
| |||||||||||||||||
Incumbent Democratic U.S Senator John Glenn won re-election to a third term over Republican U.S. Congressman Tom Kindness.
| Party | Candidate | Votes | % | |
|---|---|---|---|---|
| Democratic | John Glenn (Incumbent) | 1,949,208 | 62.5% | |
| Republican | Tom Kindness | 1,171,893 | 37.6% | |
| Independent | Kathleen M. Button | 59 | 0.0% | |
| Independent | William M. Harris | 29 | 0.0% | |
Oklahoma
|
| |||||||||||||||||
| |||||||||||||||||
| |||||||||||||||||
Incumbent Republican Don Nickles won re-election to his second term, over Democratic U.S. Congressman James R. Jones.
| Party | Candidate | Votes | % | |
|---|---|---|---|---|
| Republican | Don Nickles (Incumbent) | 493,436 | 55.2% | |
| Democratic | James R. Jones | 400,230 | 44.8% | |
Oregon
|
| |||||||||||||||||
| |||||||||||||||||
| |||||||||||||||||
Incumbent Bob Packwood ran for re-election. U.S. Congressman Jim Weaver received the Democratic nomination. A populist Democratic congressman from Eugene, Oregon, he was a darling of the environmentalists. Weaver supported the Oregon Wilderness Act of 1984. Packwood was confident despite the popular opponent, because had more money and a better campaign organization.[28] After winning the party nomination, Weaver was the subject of a House Ethics Committee probe into his campaign finances, and withdrew his candidacy. Rick Bauman was selected to replace Weaver on the ballot, and lost handily to Packwood.
| Party | Candidate | Votes | % | |
|---|---|---|---|---|
| Democratic | Jim Weaver | 183,334 | 61.56% | |
| Democratic | Rod Monroe | 44,553 | 14.96% | |
| Democratic | Rick Bauman | 41,939 | 14.08% | |
| Democratic | Steve Anderson | 26,130 | 8.77% | |
| Democratic | miscellaneous | 1,868 | 0.63% | |
| Total votes | 297,824 | 100.00% | ||
| Party | Candidate | Votes | % | |
|---|---|---|---|---|
| Republican | Bob Packwood | 171,985 | 57.62% | |
| Republican | Joe Lutz | 126,315 | 42.32% | |
| Republican | miscellaneous | 166 | 0.06% | |
| Total votes | 298,466 | 100.00% | ||
| Party | Candidate | Votes | % | |
|---|---|---|---|---|
| Republican | Bob Packwood | 656,317 | 62.95% | |
| Democratic | Rick Bauman | 375,735 | 36.04% | |
| Independent (United States) | Write-in | 10,503 | 1.01% | |
| Total votes | 1,042,555 | 100.00% | ||
| Republican hold | ||||
Pennsylvania
|
| |||||||||||||||||
| |||||||||||||||||
 County results | |||||||||||||||||
| |||||||||||||||||
Incumbent Republican Arlen Specter won re-election to a second term over Democratic U.S. Congressman Bob Edgar. Despite the popularity of his Republican counterpart John Heinz, Arlen Specter was viewed somewhat tepidly by the Pennsylvania electorate entering the race, although both men shared similar moderate profiles. Additionally, economic woes had dragged down the popularity of Republican candidates in the industrial states. Democrats sensed the vulnerability of the incumbent, and two men with similar experience in the U.S. House, but contrasting political views, vied for the nomination. Don Bailey, the state's incumbent Auditor General, was viewed as the initial favorite, as he projected a strong blue collar image and had moderate positions that were often relatively close to Specter's. Bob Edgar, a Methodist minister and sitting Congressman, had more liberal viewpoints, as he was connected with the Vietnam War-era peace movement and the anti-corruption movement following the Watergate scandals. However, issues played a very minor role in the primary, which instead showcased the state's geographical divide, with Delaware County-based Edgar narrowly defeating Westmoreland County-based Bailey.[32]
True to his past as a political organizer, Edgar developed a strong grassroots campaign and reached out to alienated left-leaning voters. He attacked Specter as a politician who compromised his moderate political positions when pressured by the conservative administration of Ronald Reagan. Edgar, who had a history of winning tight races in his congressional district, was a financial underdog, as Specter was able to raise nearly three times as much for his campaign warchest. Originally attempting a positive campaign, Specter changed his strategy in response to Edgar's personal attacks and characterized Edgar as soft on defense issues and as a liberal ideologue. Edgar was never able to find a message that resonated with voters in the western portion of the state, and Specter undercut Edgar's support in both candidates' suburban Philadelphia home by presenting himself as representative of the views of the average suburban voter.[32]
| Party | Candidate | Votes | % | |
|---|---|---|---|---|
| Republican | Arlen Specter | 1,906,537 | 56.4% | |
| Democratic | Robert W. Edgar | 1,448,219 | 42.9% | |
| Independent | Lance S. Haver | 23,470 | 0.7% | |
South Carolina
|
| |||||||||||||||||
| |||||||||||||||||
| |||||||||||||||||
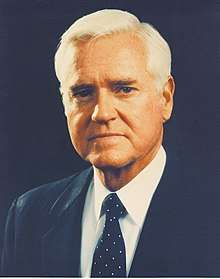
Popular incumbent Democratic Senator Fritz Hollings easily defeated Republican U.S. Attorney Henry McMaster to win his fourth full term.
| Republican Primary | ||
|---|---|---|
| Candidate | Votes | % |
| Henry McMaster | 27,695 | 53.4% |
| Henry Jordan | 24,164 | 46.6% |
The race was not seriously contested and was not a target by the Republicans. With little financial assistance, McMaster was unable to mount a credible challenge to Hollings' re-election in what became a difficult year for Republicans.
| Party | Candidate | Votes | % | ± | |
|---|---|---|---|---|---|
| Democratic | Fritz Hollings | 465,511 | 63.1% | -7.3% | |
| Republican | Henry McMaster | 262,976 | 35.6% | +6.0% | |
| Libertarian | Steven B. Vandervelde | 4,788 | 0.7% | +0.7% | |
| American | Ray Hillyard | 4,588 | 0.6% | +0.6% | |
| No party | Write-Ins | 199 | 0.0% | 0.0% | |
| Majority | 202,535 | 27.5% | -13.3% | ||
| Turnout | 738,062 | 56.6% | -13.9% | ||
| Democratic hold | |||||
South Dakota
|
| |||||||||||||||||
| |||||||||||||||||
 County results | |||||||||||||||||
| |||||||||||||||||

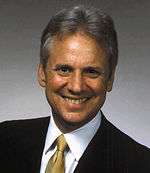
Incumbent Republican James Abdnor ran for re-election to a second term, but was defeated by Democratic Congressman Tom Daschle.[33]
Despite Abdnor winning the primary by a fairly comfortable margin, it hurt him badly. Daschle was uncontested for the Democratic nomination and therefore was able to focus on the general election early, while Abdnor had to fight a challenge from an incumbent governor. Many political analysts say this was one of the factors in Abdnor's general election loss.
| Party | Candidate | Votes | % | |
|---|---|---|---|---|
| Republican | James Abdnor (Incumbent) | 63,414 | 54.51% | |
| Republican | Bill Janklow | 52,924 | 45.49% | |
| Total votes | 116,338 | 100.00% | ||
| Party | Candidate | Votes | % | ± | |
|---|---|---|---|---|---|
| Democratic | Tom Daschle | 152,657 | 51.60% | +12.21% | |
| Republican | James Abdnor (Incumbent) | 143,173 | 48.40% | -9.80% | |
| Majority | 9,484 | 3.21% | -15.60% | ||
| Turnout | 295,830 | ||||
| Democratic gain from Republican | Swing | ||||
Utah
Vermont
|
| |||||||||||||||||
| |||||||||||||||||
| |||||||||||||||||
Incumbent Democrat Patrick Leahy won re-election to a third term over Republican former Governor of Vermont Richard A. Snelling and Liberty Unionist sociologist and perennial candidate Jerry Levy.
| Party | Candidate | Votes | % | |
|---|---|---|---|---|
| Democratic | Patrick Leahy (inc.) | 21,255 | 97.63% | |
| Democratic | Write-ins | 516 | 2.37% | |
| Total votes | 21,771 | 100.00% | ||
| Party | Candidate | Votes | % | |
|---|---|---|---|---|
| Liberty Union | Jerry Levy | 147 | 93.04% | |
| Liberty Union | Write-ins | 11 | 6.96% | |
| Total votes | 158 | 100.00% | ||
| Party | Candidate | Votes | % | |
|---|---|---|---|---|
| Republican | Richard A. Snelling | 21,477 | 75.11% | |
| Republican | Anthony N. Doria | 6,493 | 22.71% | |
| Republican | Write-ins | 625 | 2.19% | |
| Total votes | 28,595 | 100.00% | ||
| Party | Candidate | Votes | % | ± | |
|---|---|---|---|---|---|
| Democratic | Patrick Leahy (Incumbent) | 124,123 | 63.16% | +13.34% | |
| Republican | Richard A. Snelling | 67,798 | 34.50% | -14.00% | |
| Conservative Party (United States) | Anthony N. Doria | 2,963 | 1.51% | ||
| Liberty Union | Jerry Levy | 1,583 | 0.81% | ||
| Write-ins | 65 | 0.02% | |||
| Majority | 56,325 | 28.66% | +27.34% | ||
| Turnout | 196,532 | ||||
| Democratic hold | Swing | ||||
Washington
|
| |||||||||||||||||
| |||||||||||||||||
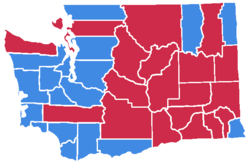 County Results | |||||||||||||||||
| |||||||||||||||||
Incumbent Republican Slade Gorton lost re-election to U.S. Congressman Brock Adams, former U.S. Secretary of Transportation.
| Party | Candidate | Votes | % | |
|---|---|---|---|---|
| Democratic | Brock Adams | 677,471 | 50.66% | |
| Republican | Slade Gorton (Incumbent) | 650,931 | 48.67% | |
| Socialist Workers | Jill Fein | 8,965 | 0.67% | |
Wisconsin
|
| |||||||||||||||||
| |||||||||||||||||
| |||||||||||||||||
Incumbent Republican Bob Kasten won re-election to a second term over Democratic former Deputy Attorney General of Wisconsin Ed Garvey.
| Party | Candidate | Votes | % | |
|---|---|---|---|---|
| Republican | Bob Kasten (Incumbent) | 754,573 | 50.9% | |
| Democratic | Ed Garvey | 702,963 | 47.4% | |
See also
References
- ↑ "Our Campaigns - AL US Senate - D Primary Race - Jun 03, 1986". www.ourcampaigns.com. Retrieved 20 December 2017.
- ↑ "Our Campaigns - AL US Senate - R Primary Race - Jun 03, 1986". www.ourcampaigns.com. Retrieved 20 December 2017.
- ↑ "Our Campaigns - AL US Senate Race - Nov 04, 1986". www.ourcampaigns.com. Retrieved 20 December 2017.
- ↑ http://www.elections.alaska.gov/results/86PRIM/86prim.pdf
- 1 2 3 4 5 6 7 8 9 10 11 12 13 14 15 16 17 Clerk of the U.S. House of Representatives (1987). "Statistics of the Congressional Election of November 4, 1986" (PDF). U.S. Government Printing Office.
- ↑ Nowicki, D. & Muller, B. (March 1, 2007). The Senate calls. The Arizona Republic. Retrieved September 16, 2007.
- ↑ "Our Campaigns - AR US Senate Race - Nov 04, 1986". www.ourcampaigns.com. Retrieved 20 December 2017.
- ↑ "Our Campaigns - CA US Senate Race - Nov 04, 1986". www.ourcampaigns.com. Retrieved 20 December 2017.
- ↑ "Ludington Daily News - Google News Archive Search". news.google.com. Retrieved 20 December 2017.
- ↑ "Our Campaigns - CT US Senate Race - Nov 04, 1986". www.ourcampaigns.com. Retrieved 20 December 2017.
- 1 2 "Archived copy". Archived from the original on 2011-07-18. Retrieved 2011-03-26.
- ↑ "United States Senator". Our Campaigns. December 21, 2005. Retrieved January 1, 2009.
- ↑ "Our Campaigns - IL US Senate Race - Nov 04, 1986". www.ourcampaigns.com. Retrieved 20 December 2017.
- ↑ "Our Campaigns - IN US Senate Race - Nov 04, 1986". www.ourcampaigns.com. Retrieved 20 December 2017.
- 1 2 http://sos.iowa.gov/elections/pdf/results/80s/1986primcanv.pdf
- 1 2 "Maryland State Board of Elections". Elections.state.md.us. August 17, 2001. Retrieved May 18, 2012.
- ↑ "Our Campaigns - NH US Senate Race - Nov 04, 1986". www.ourcampaigns.com. Retrieved 20 December 2017.
- ↑ "Our Campaigns - NY US Senate Race - Nov 04, 1986". www.ourcampaigns.com. Retrieved 20 December 2017.
- 1 2 "Advisory Opinion of the Federal Election Commission" (PDF). Retrieved 20 December 2017.
- 1 2 Bookwatch, D.G. Martin/North Carolina. "D.G. Martin: Trump, Romney and Terry Sanford". Retrieved 20 December 2017.
- 1 2 Times, Special to the New York (20 December 1986). "Democrats' Hopes up in Carolina Senate Race". Retrieved 20 December 2017 – via NYTimes.com.
- ↑ "Our Campaigns - NC US Senate - D Primary Race - May 06, 1986". www.ourcampaigns.com. Retrieved 20 December 2017.
- ↑ "Our Campaigns - NC US Senate - R Primary Race - May 06, 1986". www.ourcampaigns.com. Retrieved 20 December 2017.
- ↑ "Our Campaigns - NC US Senate Race - Nov 04, 1986". www.ourcampaigns.com. Retrieved 20 December 2017.
- ↑ "Our Campaigns - NC US Senate Special Election Race - Nov 04, 1986". www.ourcampaigns.com. Retrieved 20 December 2017.
- ↑ "Our Campaigns - OH US Senate Race - Nov 04, 1986". www.ourcampaigns.com. Retrieved 20 December 2017.
- ↑ "Our Campaigns - NH US Senate Race - Nov 03, 1998". www.ourcampaigns.com. Retrieved 20 December 2017.
- ↑ "Archived copy". Archived from the original on 2010-09-17. Retrieved 2010-04-03.
- ↑ "Oregon US Senate Democratic Primary Race, May 20, 1986". ourcampaigns.com. Retrieved April 9, 2010.
- ↑ "Oregon US Senate Republican Primary Race, May 20, 1986". ourcampaigns.com. Retrieved April 9, 2010.
- ↑ "Oregon US Senate Race, Nov 4, 1986". ourcampaigns.com. Retrieved April 9, 2010.
- 1 2 Kennedy, John J. (2006). Pennsylvania Elections: Statewide Contests from 1950-2004. United Press of America. pp. 65–67. ISBN 9780761832799.
- ↑ "Our Campaigns - VA US Senate Race - Nov 07, 2000". www.ourcampaigns.com. Retrieved 20 December 2017.
- ↑ "South Dakota Secretary of State, Shantel Krebs" (PDF). www.sdsos.gov. Retrieved 20 December 2017.
- 1 2 3 http://vermont-elections.org/elections1/1986PrimaryCanvass.pdf
- ↑ http://www.sos.wa.gov/elections/results_report.aspx?e=27&c=&c2=&t=&t2=&p=&p2=&y=
External links
- State Election Commission (1987). South Carolina Election Commission Annual Report 1986-1987. Columbia, SC. pp. 14, 22.