Tameside Metropolitan Borough Council elections
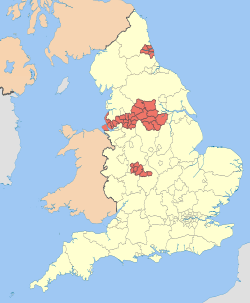
One third of Tameside Metropolitan Borough Council in Greater Manchester, England is elected each year, followed by one year without election. Since the last boundary changes in 2004, 57 councillors have been elected from 19 wards.[1]
Political control
Since 1973 political control of the council has been held by the following parties:[2]
| Party in control | Years |
|---|---|
| Labour | 1973–1976 |
| Conservative | 1976–1979 |
| Labour | 1979–present |
Council elections
- Tameside Metropolitan Borough Council election, 1998
- Tameside Metropolitan Borough Council election, 1999
- Tameside Metropolitan Borough Council election, 2000
- Tameside Metropolitan Borough Council election, 2002
- Tameside Metropolitan Borough Council election, 2003
- Tameside Metropolitan Borough Council election, 2004 (whole Metropolitan Borough Council elected after boundary changes)[3]
- Tameside Metropolitan Borough Council election, 2006
- Tameside Metropolitan Borough Council election, 2007
- Tameside Metropolitan Borough Council election, 2008
- Tameside Metropolitan Borough Council election, 2010
- Tameside Metropolitan Borough Council election, 2011
- Tameside Metropolitan Borough Council election, 2012
- Tameside Metropolitan Borough Council election, 2014
- Tameside Metropolitan Borough Council election, 2015
- Tameside Metropolitan Borough Council election, 2016
- Tameside Metropolitan Borough Council election, 2018
- Tameside Metropolitan Borough Council election, 2019
- Tameside Metropolitan Borough Council election, 2020
By-election results
| Party | Candidate | Votes | % | ± | |
|---|---|---|---|---|---|
| Labour | Walter Downs | 900 | 52.2 | -9.3 | |
| Conservative | Thomas Jones | 346 | 20.1 | -18.4 | |
| BNP | Anthony Jones | 316 | 18.3 | +18.3 | |
| Liberal Democrat | David Barber | 115 | 6.7 | +6.7 | |
| Green | Nigel Rolland | 47 | 2.7 | +2.7 | |
| Majority | 554 | 32.1 | |||
| Turnout | 1,724 | 20.5 | |||
| Labour hold | Swing | ||||
| Party | Candidate | Votes | % | ± | |
|---|---|---|---|---|---|
| Labour | George Roberts | 773 | 45.6 | -2.2 | |
| Conservative | David Buckley | 427 | 25.2 | -8.2 | |
| BNP | Paul Hindley | 283 | 16.7 | +16.7 | |
| Green | Jean Smee | 137 | 8.1 | -10.7 | |
| Liberal Democrat | Peter Ball-Foster | 75 | 4.4 | +4.4 | |
| Majority | 346 | 20.4 | |||
| Turnout | 1,695 | 18.8 | |||
| Labour hold | Swing | ||||
| Party | Candidate | Votes | % | ± | |
|---|---|---|---|---|---|
| Labour | Philip Fitzpatrick | 1,379 | 45.6 | +9.0 | |
| BNP | Rosalind Gauci | 889 | 29.4 | +1.9 | |
| Conservative | John Welsh | 485 | 16.0 | -7.8 | |
| Liberal Democrat | Peter Ball-Foster | 172 | 5.7 | -6.5 | |
| Green | Nigel Rolland | 69 | 2.3 | +2.3 | |
| UKIP | Angela McManus | 33 | 1.1 | +1.1 | |
| Majority | 490 | 16.2 | |||
| Turnout | 3,027 | 32.0 | |||
| Labour hold | Swing | ||||
| Party | Candidate | Votes | % | ± | |
|---|---|---|---|---|---|
| Labour | Denise Ward | 1,258 | 47.8 | +2.3 | |
| Conservative | Floyd Paterson | 660 | 25.1 | -11.3 | |
| BNP | Rosalind Gauci | 358 | 13.6 | +13.6 | |
| UKIP | John Cooke | 193 | 7.3 | +7.3 | |
| Green | Rachell Lucas | 164 | 6.2 | +6. | |
| Majority | 598 | 22.7 | |||
| Turnout | 2,633 | 31.5 | |||
| Labour hold | Swing | ||||
| Party | Candidate | Votes | % | ± | |
|---|---|---|---|---|---|
| Labour | Janet Cooper | 1,275 | 48.96 | ||
| Conservative | Robert Adlard | 1083 | 41.59 | ||
| Green | Melaine Roberts | 99 | 3.80 | ||
| BNP | Anthony Jones | 80 | 3.07 | ||
| UKIP | Kevin Misell | 67 | 2.57 | ||
| Majority | 192 | 7.37 | |||
| Turnout | 2,604 | 33 | |||
| Labour hold | Swing | ||||
| Party | Candidate | Votes | % | ± | |
|---|---|---|---|---|---|
| Labour | David John Mills | 1,064 | 60.3 | +8.9 | |
| Conservative | Matt Stevenson | 577 | 32.7 | +23.6 | |
| Liberal Democrat | Shaun Clive Offerman | 63 | 3.6 | +3.6 | |
| Green | Jean Margaret Smee | 60 | 3.4 | -2.5 | |
| Majority | 487 | 27.6 | |||
| Turnout | 1,764 | 19.8 | |||
| Labour hold | Swing | ||||
| Party | Candidate | Votes | % | ± | |
|---|---|---|---|---|---|
| Labour | Laura Boyle | 986 | 61.5 | ||
| Conservative | Matt Stevenson | 489 | 30.5 | ||
| Green | Annie Train | 98 | 6.1 | ||
| Liberal Democrat | Sahun Offerman | 30 | 1.9 | ||
| Majority | 497 | ||||
| Turnout | 1,603 | 18 | |||
References
- ↑ "Know your councillor". Tameside.gov.uk. Archived from the original on 2012-07-12. Retrieved 2009-09-27.
- ↑ "Tameside". BBC News Online. 2008-04-19. Retrieved 2009-09-27.
- ↑ "Tameside Metropolitan Borough Council". BBC News Online. Retrieved 2009-07-27.
- 1 2 "By-Election Results for Denton South and Stalybridge North Wards". Tameside.gov.uk. Retrieved 2009-09-27.
- ↑ "Labour increase majority in by-election". Tameside Advertiser. 2009-02-06. Retrieved 2009-09-27.
- ↑ "Labour hold on in by-election". Tameside Advertiser. 2009-07-31. Retrieved 2009-09-27.
- ↑ "By-Election Results, Longdendale: Thursday, 30 September 2010". tameside.moderngov.co.uk. Tameside Metropolitan Borough Council. 30 September 2010. Retrieved 3 January 2018.
- ↑ "Election results 26 October 2017". Tameside Metropolitan Borough Council. 26 October 2017. Retrieved 27 December 2017.
- ↑ "Election results for Droylsden East: Droylsden East By-Election - Thursday, 8th March, 2018". Tameside Metropolitan Borough Council. 8 March 2018. Archived from the original on 17 March 2018. Retrieved 17 March 2018.
External links
| Mayor | |
|---|---|
| Bolton | |
| Bury | |
| Manchester | |
| Oldham | |
| Rochdale | |
| Salford | |
| Stockport | |
| Tameside | |
| Trafford | |
| Wigan | |
| County Council |
|
| |
This article is issued from
Wikipedia.
The text is licensed under Creative Commons - Attribution - Sharealike.
Additional terms may apply for the media files.