Newcastle City Council
| Newcastle City Council | |
|---|---|
 | |
 | |
| Type | |
| Type | |
| Leadership | |
Leader of the Council | |
| Structure | |
| Seats | 78 councillors |
 | |
Political groups |
|
| Elections | |
| First past the post | |
Last election | 3 May 2018 |
Next election | 7 May 2020 |
| Meeting place | |
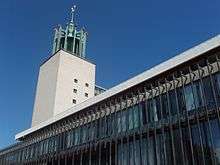 | |
| Newcastle Civic Centre, Barras Bridge, Newcastle upon Tyne | |
| Website | |
|
newcastle | |
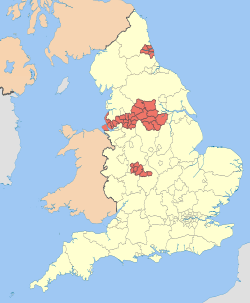
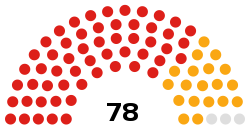
Newcastle City Council is the local government authority for Newcastle upon Tyne, a city in Tyne and Wear, England. The council consists of 78 councillors, three for each of the city's 26 wards.
It is currently controlled by Labour and led by Nick Forbes.[1] The current Lord Mayor is Councillor Linda Wright[2] and the current Sheriff and Deputy Lord Mayor is Councillor David Down.[3]
Political control
Elections are held by thirds, in three years out of four. 2004 saw boundary changes and all seats were up for re-election. Similarly, following boundary changes, all seats were up for re-election in 2018.
The council was under the control of the Labour Party from its reconstitution in 1974 under the Local Government Act 1972, until 2004. The Liberal Democrats controlled the Council from 2004 until 2011, when the Labour Party regained control.
There are currently 56 Labour councillors, 19 Liberal Democrat councillors and 3 Independent councillors.
Leaders
- T Dan Smith (Labour, 1959–1965)
- Frank Butterfield (Labour, 1965–1966)
- Bert Abrahart (Labour, 1966–1967)
- Arthur Grey (Conservative, 1967–1972)
- John Cox (Conservative, 1972–74)
Leaders and control from 1974
| Name | Years | Control | ||
|---|---|---|---|---|
| Tom Collins | 1974–1977 | Labour | ||
| Jeremy Beecham | 1977–1994 | |||
| Tony Flynn | 1994–2004 | |||
| Peter Arnold | 2004–2006 | Liberal Democrats | ||
| John Shipley | 2006–2010 | |||
| David Faulkner | 2010–2011 | |||
| Nick Forbes | 2011 – present | Labour | ||
For a list of past Mayors and Lord Mayors see List of Lord Mayors of Newcastle-upon-Tyne.
Wards
Newcastle has 26 electoral wards[4], however the boundaries are to be subjected to change following an electoral review in 2016.[5]
|
Population by ward
| Ward | Under 16 | % of ward | 16–24 | % of ward | 25–44 | % of ward | 45–64 | % of ward | 65–75 | % of ward | 75+ | % of ward |
|---|---|---|---|---|---|---|---|---|---|---|---|---|
| Benwell and Scotswood | 3011 | 21.9 | 1569 | 11.4 | 3907 | 28.4 | 3055 | 22.2 | 1154 | 8.4 | 1045 | 7.6 |
| Blakelaw | 2529 | 22.6 | 1218 | 10.9 | 3097 | 27.7 | 2568 | 23 | 985 | 8.8 | 782 | 7 |
| Byker | 2385 | 21 | 1266 | 11.2 | 3306 | 29.2 | 2623 | 21.2 | 916 | 8.1 | 844 | 7.4 |
| Castle | 1938 | 19.6 | 985 | 9.9 | 3144 | 28.7 | 2640 | 21.2 | 658 | 6.6 | 537 | 5.4 |
| Dene | 1718 | 18 | 1339 | 14 | 3009 | 31.5 | 2016 | 21.1 | 695 | 7.3 | 776 | 8.1 |
| Denton | 2110 | 18.4 | 1029 | 9.5 | 2863 | 26.4 | 2535 | 21.2 | 1330 | 8.4 | 984 | 9.1 |
| Gosforth East | 1549 | 17.2 | 1112 | 12.4 | 2865 | 31.9 | 1930 | 21.5 | 646 | 7.2 | 882 | 9.8 |
| Gosforth West | 1883 | 19.6 | 893 | 9.2 | 2864 | 29.6 | 2317 | 23.9 | 844 | 8.7 | 871 | 9 |
| Elswick | 2419 | 21.4 | 1808 | 16 | 3246 | 28.7 | 2277 | 20.1 | 846 | 7.5 | 734 | 6.5 |
| Fawdon | 2239 | 21.4 | 1094 | 10.4 | 2916 | 27.8 | 2212 | 21.4 | 1051 | 10 | 949 | 9.1 |
| Fenham | 2294 | 21.1 | 1464 | 13.5 | 2966 | 27.3 | 2145 | 19.7 | 984 | 9.1 | 1016 | 9.4 |
| Heaton North | 1689 | 18 | 1333 | 14.2 | 2675 | 28.5 | 2085 | 22.2 | 856 | 9.1 | 752 | 8 |
| Heaton South | 846 | 10 | 2920 | 34.6 | 2488 | 29.4 | 1164 | 13.8 | 459 | 5.4 | 584 | 6.9 |
| Jesmond North | 938 | 11 | 3023 | 35.4 | 2434 | 28.5 | 1291 | 15.1 | 360 | 4.2 | 494 | 5.8 |
| Jesmond South | 590 | 7.3 | 2916 | 31.1 | 2525 | 31.3 | 1136 | 14.1 | 353 | 4.4 | 570 | 7.1 |
| Kenton | 2413 | 22.8 | 1180 | 11.1 | 3007 | 28.4 | 2199 | 20.8 | 887 | 8.4 | 895 | 8.5 |
| Lemington | 2198 | 20.8 | 1068 | 10.1 | 3236 | 30.6 | 2604 | 24.6 | 861 | 8.1 | 597 | 5.6 |
| Newburn | 1787 | 19.2 | 826 | 8.9 | 2591 | 22.9 | 2327 | 25 | 957 | 10.3 | 803 | 8.6 |
| Ouseburn | 847 | 10.9 | 2516 | 32.3 | 2260 | 29 | 1189 | 15.3 | 475 | 6.1 | 518 | 6.6 |
| Parklands | 1458 | 18.7 | 654 | 8.8 | 1971 | 25.2 | 2079 | 26.6 | 814 | 10.4 | 807 | 10.3 |
| Walker | 2796 | 23.6 | 1272 | 10.7 | 3279 | 27.6 | 2481 | 20.9 | 1129 | 9.5 | 921 | 7.8 |
| Walkergate | 1997 | 20.5 | 878 | 9 | 2811 | 28.8 | 2281 | 23.4 | 995 | 10.2 | 787 | 8.1 |
| Westerhope | 1523 | 15.8 | 915 | 9.5 | 2255 | 23.4 | 2890 | 30 | 1186 | 12.3 | 864 | 9 |
| Westgate | 921 | 12.1 | 2330 | 30.7 | 2391 | 31.5 | 1097 | 14.4 | 473 | 6.2 | 377 | 5 |
| Wingrove | 2251 | 19.6 | 3362 | 29.2 | 3171 | 27.5 | 1579 | 13.7 | 615 | 5.3 | 532 | 4.6 |
| Woolsington | 2384 | 22.2 | 972 | 9.1 | 3234 | 30.1 | 2248 | 20.9 | 1165 | 10.9 | 726 | 6.8 |
| Newcastle total | 46,543 | 18.2 | 39,942 | 15.6 | 74,511 | 29.1 | 54,960 | 21.5 | 21,694 | 8.5 | 18,562 | 7.2 |
References
- ↑ http://www.newcastle.gov.uk/your-council-and-democracy/councillors-and-democracy/councillors/leader-of-the-council
- ↑ "Lord Mayor of Newcastle upon Tyne". Newcastle City Council. 30 May 2017. Retrieved 28 July 2017.
- ↑ "Sheriff and Deputy Lord Mayor". Newcastle City Council. 30 May 2017. Retrieved 28 July 2017.
- ↑ http://www.newcastle.gov.uk/wsapp.nsf/soapweb/PCSearch?opendocument
- ↑ "Electoral Review | Newcastle City Council". Government of the United Kingdom. Retrieved 11 June 2017.