Newton—North Delta
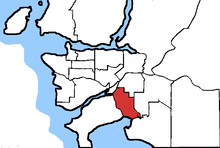 Newton—North Delta in relation to other federal electoral districts in Vancouver | |
| Coordinates: | 49°07′52″N 122°53′10″W / 49.131°N 122.886°WCoordinates: 49°07′52″N 122°53′10″W / 49.131°N 122.886°W |
| District created | 2003 |
| District abolished | 2013 |
| First contested | 2004 |
| Last contested | 2011 |
| District webpage | profile, map |
| Demographics | |
| Population (2011)[1] | 127,954 |
| Electors (2011) | 73,317 |
| Area (km²)[2] | 51.08 |
| Census divisions | Greater Vancouver |
| Census subdivisions | Surrey, Delta |
Newton—North Delta was a federal electoral district in the province of British Columbia, Canada, that had been represented in the House of Commons of Canada from 2004 to 2015, when it was abolished and redistributed to the Delta and Surrey—Newton electoral districts.
Geography
It is located within the Greater Vancouver Regional District, and consists of
- the eastern part of the Corporation of Delta, and
- the western and central parts of the City of Surrey.
Demographics
Newton—North Delta has the highest percentage of people of Sikh ethnic origin (27.6%);[3] of native Punjabi speakers (33.4%);[4] of those that use Punjabi as home language (26.8%);[5] as well as of South Asians overall (42.7%),[6] lagging only Richmond - 50.2% Chinese - in terms of population proportion of a single visible minority group.
In terms of religion, it is the federal riding with the highest percentage of Sikhs (27.6%) and, more generally, the highest percentage of people with a non-Judeo-Christian religion affiliation, 38.0% in particular (Sikh: 27.6%, Muslim: 4.3%, Hindu: 4.1%, etc.).[7][8]
History
The electoral district was created in 2003 from parts of Delta—South Richmond and Surrey Central ridings.
Members of Parliament
The riding has elected the following Members of Parliament:
| Parliament | Years | Member | Party | |
|---|---|---|---|---|
| Newton—North Delta Riding created from Delta—South Richmond and Surrey Central |
||||
| 38th | 2004–2006 | Gurmant Grewal | Conservative | |
| 39th | 2006–2008 | Sukh Dhaliwal | Liberal | |
| 40th | 2008–2011 | |||
| 41st | 2011–2015 | Jinny Sims | New Democratic | |
During the 40th Parliament, Dhaliwal was a member of the Standing Committee on Transport, Infrastructure and Communities.
Election results
| Canadian federal election, 2011 | ||||||||
|---|---|---|---|---|---|---|---|---|
| Party | Candidate | Votes | % | ±% | Expenditures | |||
| New Democratic | Jinny Sims | 15,413 | 33.42 | +7.29 | ||||
| Liberal | Sukh Dhaliwal | 14,510 | 31.46 | -4.96 | ||||
| Conservative | Mani Kaur Fallon | 14,437 | 31.30 | +0.39 | ||||
| Green | Liz Walker | 1,520 | 3.30 | -2.30 | ||||
| Independent | Ravi S. Gill | 123 | 0.27 | – | ||||
| Communist | Sam Hammond | 116 | 0.25 | -0.02 | ||||
| Total valid votes/Expense limit | 46,119 | 100.00 | ||||||
| Total rejected ballots | 294 | 0.63 | +0.07 | |||||
| Turnout | 46,413 | 62.59 | +0.52 | |||||
| New Democratic gain from Liberal | Swing | +5.79 | ||||||
| Canadian federal election, 2008 | ||||||||
|---|---|---|---|---|---|---|---|---|
| Party | Candidate | Votes | % | ±% | Expenditures | |||
| Liberal | Sukh Dhaliwal | 16,481 | 36.42 | +2.17 | $79,459 | |||
| Conservative | Sandeep Pandher | 13,988 | 30.91 | +0.29 | $79,709 | |||
| New Democratic | Teresa Townsley | 11,824 | 26.13 | -5.83 | $41,739 | |||
| Green | Liz Walker | 2,533 | 5.60 | +3.65 | $2,243 | |||
| Independent | James W. Miller-Cousineau | 179 | 0.40 | – | ||||
| Independent | John Shavluk | 126 | 0.28 | – | ||||
| Communist | Harjit Daudharia | 121 | 0.27 | +0.01 | $377 | |||
| Total valid votes/Expense limit | 45,252 | 100.00 | $81,605 | |||||
| Total rejected ballots | 255 | 0.56 | +0.16 | |||||
| Turnout | 45,507 | 62.07 | -1.02 | |||||
| Liberal hold | Swing | +4.00 | ||||||
| Canadian federal election, 2006 | ||||||||
|---|---|---|---|---|---|---|---|---|
| Party | Candidate | Votes | % | ±% | Expenditures | |||
| Liberal | Sukh Dhaliwal | 15,006 | 34.25 | +2.70 | $76,831 | |||
| New Democratic | Nancy Clegg | 14,006 | 31.96 | +2.76 | $50,542 | |||
| Conservative | Phil Eidsvik | 13,416 | 30.62 | -2.20 | $76,831 | |||
| Green | Sunny Athwal | 853 | 1.95 | -4.25 | $12,622 | |||
| Independent | Rob Girn | 319 | 0.73 | – | ||||
| Communist | Harjit Daudharia | 112 | 0.26 | +0.02 | $379 | |||
| Independent | Mike Saifie | 106 | 0.24 | – | ||||
| Total valid votes | 43,818 | 100.00 | ||||||
| Total rejected ballots | 174 | 0.40 | -0.12 | |||||
| Turnout | 43,992 | 63.09 | 0 | |||||
| Liberal gain from Conservative | Swing | +2.45 | ||||||
| Canadian federal election, 2004 | ||||||||
|---|---|---|---|---|---|---|---|---|
| Party | Candidate | Votes | % | ±% | Expenditures | |||
| Conservative | Gurmant Grewal | 13,529 | 32.82 | – | $72,183 | |||
| Liberal | Sukh Dhaliwal | 13,009 | 31.55 | – | $64,449 | |||
| New Democratic | Nancy Clegg | 12,037 | 29.20 | – | $28,384 | |||
| Green | John Hague | 2,535 | 6.20 | – | $3,135 | |||
| Communist | Nazir Rizvi | 98 | 0.24 | – | $389 | |||
| Total valid votes | 41,228 | 100.0 | ||||||
| Total rejected ballots | 216 | 0.52 | ||||||
| Turnout | 41,444 | 63 | ||||||
See also
References
- "(Code 59016) Census Profile". 2011 census. Statistics Canada. 2012. Retrieved 2011-03-06.
Notes
- ↑ Statistics Canada: 2012
- ↑ Statistics Canada: 2012
- ↑ "Religion (13) and Age Groups (8) for Population, for Canada, Provinces, Territories and Federal Electoral Districts (2003 Representation Order), 2001 Census - 20% Sample Data". 2.statcan.gc.ca. Retrieved 2012-11-20.
- ↑ "2011 Census of Canada: Topic-based tabulations | Detailed Mother Tongue (232), Knowledge of Official Languages (5), Age Groups (17A) and Sex (3) for the Population Excluding Institutional Residents of Canada, Provinces, Territories and Federal Electoral Districts (2003 Representation Order), 2011 Census". 2.statcan.gc.ca. Retrieved 2012-11-19.
- ↑ "First Official Language Spoken (7), Detailed Language Spoken Most Often at Home (232), Age Groups (17A) and Sex (3) for the Population Excluding Institutional Residents of Canada, Provinces, Territories and Federal Electoral Districts (2003 Representation Order), 2011 Census". 2.statcan.gc.ca. Retrieved 2012-11-19.
- ↑ "2006 Census of Canada: Topic-based tabulations | Federal Electoral District (FED) Profile, 2006 Census". 2.statcan.gc.ca. Retrieved 2012-11-19.
- ↑ "Religion (13) and Age Groups (8) for Population, for Canada, Provinces, Territories and Federal Electoral Districts (2003 Representation Order), 2001 Census - 20% Sample Data". 2.statcan.gc.ca. Retrieved 2012-11-20.
- ↑ "2001 Census of Canada: Topic-based tabulations". 2.statcan.ca. 2012-07-04. Retrieved 2012-11-30.