Palliser (Saskatchewan electoral district)
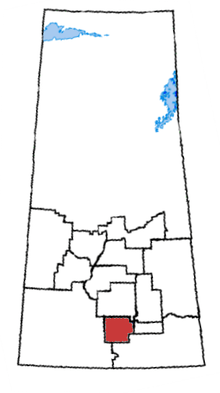 Palliser in relation to other Saskatchewan federal electoral districts | |
| Coordinates: | 50°10′59″N 105°17′13″W / 50.183°N 105.287°WCoordinates: 50°10′59″N 105°17′13″W / 50.183°N 105.287°W |
| Defunct federal electoral district | |
| Legislature | House of Commons |
| District created | 1996 |
| District abolished | 2013 |
| First contested | 1997 |
| Last contested | 2011 |
| District webpage | profile, map |
| Demographics | |
| Population (2011)[1] | 68,544 |
| Electors (2011) | 50,094 |
| Area (km²)[2] | 7,486.76 |
| Census subdivisions | Regina, Moose Jaw |
Palliser was a federal electoral district in Saskatchewan, Canada, that was represented in the House of Commons of Canada from 1997 to 2015.
It was named in honour of John Palliser, a geographer and explorer of the Canadian west.
Geography
It included the city of Moose Jaw, the southwest quadrant of the city of Regina and the rural areas around them.
History
The electoral district was created in 1996 from Moose Jaw—Lake Centre and parts of Regina—Lumsden, Regina—Wascana and Swift Current—Maple Creek—Assiniboia ridings.
The Conservative Party of Canada took back this historically New Democratic Party (NDP) seat in 2004.
Following the Canadian federal electoral redistribution, 2012, the riding was abolished. The Regina portion became part of the new riding of Regina—Lewvan, while Moose Jaw and the rural portion became part of Moose Jaw—Lake Centre—Lanigan. Small parts of the riding were transferred to Cypress Hills—Grasslands and Regina—Qu'Appelle.
Members of Parliament
| Parliament | Years | Member | Party | |
|---|---|---|---|---|
| Palliser Riding created from Moose Jaw—Lake Centre, Regina—Lumsden, Regina—Wascana and Swift Current—Maple Creek—Assiniboia |
||||
| 36th | 1997–2000 | Dick Proctor | New Democratic | |
| 37th | 2000–2004 | |||
| 38th | 2004–2006 | Dave Batters | Conservative | |
| 39th | 2006–2008 | |||
| 40th | 2008–2011 | Ray Boughen | ||
| 41st | 2011–2015 | |||
| Riding dissolved into Moose Jaw—Lake Centre—Lanigan, Cypress Hills—Grasslands, Regina—Lewvan and Regina—Qu'Appelle |
||||
Election results
| Canadian federal election, 2011 | ||||||||
|---|---|---|---|---|---|---|---|---|
| Party | Candidate | Votes | % | ±% | Expenditures | |||
| Conservative | Ray Boughen | 15,850 | 47.00 | +3.01 | $79,591 | |||
| New Democratic | Noah Evanchuk | 15,084 | 44.73 | +10.96 | $68,063 | |||
| Liberal | Russell Collicott | 1,797 | 5.33 | -11.72 | $23,336 | |||
| Green | Larissa Shasko | 995 | 2.95 | -2.23 | $921 | |||
| Total valid votes/Expense limit | 33,726 | 100.00 | $80,114 | |||||
| Total rejected ballots | 93 | 0.27 | -0.13 | |||||
| Turnout | 33,819 | 68.51 | +4.51 | |||||
| Eligible voters | 49,362 | – | – | |||||
| Canadian federal election, 2008 | ||||||||
|---|---|---|---|---|---|---|---|---|
| Party | Candidate | Votes | % | ±% | Expenditures | |||
| Conservative | Ray Boughen | 14,159 | 43.99 | +1.01 | $65,034 | |||
| New Democratic | Don Mitchell | 10,865 | 33.77 | +0.73 | $63,072 | |||
| Liberal | Calvin Johnston | 5,489 | 17.05 | -3.15 | $60,000 | |||
| Green | Larissa Shasko | 1,580 | 5.18 | +1.78 | $213 | |||
| Total valid votes/Expense limit | 32,093 | 100.00 | $77,498 | |||||
| Total rejected ballots | 143 | 0.4 | – | |||||
| Turnout | 32,236 | 64 | -5 | |||||
| Canadian federal election, 2006 | ||||||||
|---|---|---|---|---|---|---|---|---|
| Party | Candidate | Votes | % | ±% | Expenditures | |||
| Conservative | Dave Batters | 14,906 | 42.98 | +7.13 | $71,895 | |||
| New Democratic | Jo-Anne Dusel | 11,400 | 33.04 | -2.43 | $63,803 | |||
| Liberal | John Williams | 7,006 | 20.20 | -4.61 | $35,782 | |||
| Green | Larissa Shasko | 1,182 | 3.40 | +0.91 | $550 | |||
| Canadian Action | Marcia Fogal | 120 | 0.34 | – | – | |||
| Total valid votes/Expense limit | 34,614 | 100.00 | – | |||||
| Total rejected ballots | – | – | ||||||
| Turnout | 34,614 | 69.1 | +4.7 | |||||
| Canadian federal election, 2004 | ||||||||
|---|---|---|---|---|---|---|---|---|
| Party | Candidate | Votes | % | ±% | Expenditures | |||
| Conservative | Dave Batters | 11,909 | 35.85 | -5.59 | $69,479 | |||
| New Democratic | Dick Proctor | 11,785 | 35.47 | -2.68 | $62,385 | |||
| Liberal | John Williams | 8,244 | 24.81 | +4.40 | $41,057 | |||
| Green | Brian Rands | 829 | 2.49 | – | – | |||
| Christian Heritage | Harold Stephan | 451 | 1.35 | – | $720 | |||
| Total valid votes/Expense limit | 33,218 | 100.00 | – | |||||
| Total rejected ballots | 108 | 0.32 | +0.01 | |||||
| Turnout | 33,326 | 64.42 | -0.32 | |||||
Note: Conservative vote is compared to the total of Progressive Conservative and Canadian Alliance vote in 2000.
| Canadian federal election, 2000 | ||||||||
|---|---|---|---|---|---|---|---|---|
| Party | Candidate | Votes | % | ±% | Expenditures | |||
| New Democratic Party | Dick Proctor | 12,136 | 38.15 | -0.06 | $54,888 | |||
| Alliance | Don Findlay | 11,927 | 37.50 | +8.31 | $55,442 | |||
| Liberal | Garry Johnson | 6,492 | 20.41 | -2.66 | $60,150 | |||
| Progressive Conservative | Brent Shirkey | 1,248 | 3.92 | -4.53 | $1,603 | |||
| Total valid votes | 31,803 | 100.00 | ||||||
| Total rejected ballots | 99 | 0.31 | -0.27 | |||||
| Turnout | 31,902 | 62.74 | -4.51 | |||||
Note: Canadian Alliance vote is compared to the Reform vote in 1997.
| Canadian federal election, 1997 | ||||||||
|---|---|---|---|---|---|---|---|---|
| Party | Candidate | Votes | % | ±% | Expenditures | |||
| New Democratic Party | Dick Proctor | 12,553 | 38.21 | $49,066 | ||||
| Reform | Alene Tanner | 9,590 | 29.19 | $29,487 | ||||
| Liberal | Tony Merchant | 7,579 | 23.07 | $50,830 | ||||
| Progressive Conservative | Andy McDougall | 2,777 | 8.45 | $10,066 | ||||
| Natural Law | Jack Heilman | 350 | 1.06 | |||||
| Total valid votes | 32,846 | 100.00 | ||||||
| Total rejected ballots | 193 | 0.58 | ||||||
| Turnout | 33,042 | 67.35 | ||||||
See also
References
- "(Code 47005) Census Profile". 2011 census. Statistics Canada. 2012. Retrieved 2011-03-03.
Notes
- ↑ Statistics Canada: 2012
- ↑ Statistics Canada: 2012
.png)