List of metropolitan areas in Japan
This is a list of metropolitan areas (都市圏 toshiken) in Japan by population as defined by the Statistics Bureau of Japan (SBJ) and the Center for Spatial Information Service of the University of Tokyo. The region containing most of the people in Japan between Tokyo and Fukuoka is often called the Taiheiyō Belt.
Population Census
The Statistics Bureau of Japan (SBJ) defines a metropolitan area as one or more central cities and its associated outlying municipalities. To qualify as an outlying municipality, the municipality must have at least 1.5% of its resident population aged 15 and above commuting to school or work into one of the central cities. To qualify as a central city, a city must either be a designated city of any population or a non-designated city with a city proper population of at least 500,000. Metropolitan areas of designated cities are defined as "major metropolitan areas" (大都市圏) while those of non-designated cities are simply "metropolitan areas" (都市圏). If multiple central cities are close enough such that their outlying cities overlap, they are combined together and a single metropolitan area is defined rather than independently.
2015 Population Census
The metropolitan areas written in bold are the 11 major metropolitan areas of Japan.
- 2015
- MMA: Major Metropolitan Area
- MA: Metropolitan Area
- Source: Statistics Bureau of Japan[1]
2010 Population Census
The metropolitan areas written in bold are the 11 major metropolitan areas of Japan.
- 2010
- MMA: Major Metropolitan Area
- MA: Metropolitan Area
- Source: Statistics Bureau of Japan[2]
Changes from 2005 census The following changes to metropolitan area definitions were made in the 2010 Census report.[3]
- New central cities in Kantō and Keihanshin major metropolitan areas
- Sagamihara in the Kantō MMA and Sakai in the Keihanshin MMA have become designated cities in 2010 and 2006 respectively. These cities are already well within their MMAs and should not greatly alter their formation.
- Niigata and Okayama major metropolitan areas
- Niigata became a designated city in 2007 and Okayama became a designated city in 2009. These cities therefore formed major metropolitan areas in the 2010 census.
- Shizuoka, Hamamatsu major metropolitan area
- Utsunomiya metropolitan area
- Utsunomiya qualified as a central city for the 2010 census, resulting from mergers with neighboring municipalities and subsequent population growth.
2005 Population Census
The metropolitan areas written in bold are the 8 major metropolitan areas of Japan.
- October 1, 2005
- MMA: Major Metropolitan Area
- MA: Metropolitan Area
- Source: Statistics Bureau of Japan[4]
Urban Employment Area
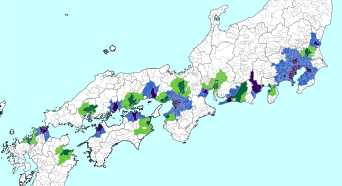

Kyoto MEA, Nagoya MEA
Urban Employment Area is another definition of metropolitan areas, defined by the Center for Spatial Information Service, the University of Tokyo. The Japan's Ministry of Economy, Trade and Industry defined 233 areas for the UEAs of Japan.
- 2010 standards
- MEA: Metropolitan Employment Area
- Source: Ministry of Economy, Trade and Industry of Japan,[5] Center for Spatial Information Science, the University of Tokyo[6]
| Metropolitan area | Central city | Prefecture | Area (km2) |
GDP (bn JPY) | Population | ||||
|---|---|---|---|---|---|---|---|---|---|
| 2010 | 2005 | 1995 | 1980 | 1965 | |||||
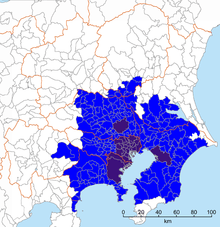
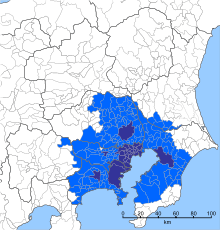
| Tokyo MEA | Special wards of Tokyo, Saitama, Chiba, Tachikawa, Musashino, Yokohama, Kawasaki, Atsugi | Ibaraki, Saitama, Chiba, Tokyo, Kanagawa, Yamanashi | 10,404 | 157,820 | 34,834,167 | 33,652,998 | 31,707,138 | 27,853,640 | 20,156,066 |
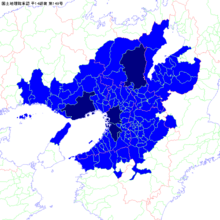
| Osaka MEA | Osaka, Sakai, Higashiōsaka, Kadoma, Moriguchi | Kyoto, Osaka, Hyōgo, Nara, Wakayama | 4,291 | 45,362 | 12,273,041 | 12,208,161 | 12,039,181 | 11,365,385 | 8,721,257 |
| Nagoya MEA | Nagoya, Komaki | Gifu, Aichi, Mie | 2,792 | 22,497 | 5,490,453 | 5,385,383 | 5,151,367 | 4,713,287 | 3,708,670 |
| Kyoto MEA | Kyoto | Shiga, Kyoto | 2,836 | 10,117 | 2,679,094 | 2,653,421 | 2,582,733 | 2,395,626 | 1,897,517 |
| Fukuoka MEA | Fukuoka | Fukuoka | 1,283 | 8,922 | 2,495,552 | 2,409,904 | 2,196,463 | 1,768,587 | 1,165,151 |
| Kobe MEA | Kobe | Hyōgo | 1,245 | 8,427 | 2,431,076 | 2,417,914 | 2,309,076 | 2,130,237 | 1,697,644 |
| Sapporo MEA | Sapporo, Otaru | Ishikari Subprefecture, Shiribeshi Subprefecture in Hokkaido | 3,205 | 7,438 | 2,341,599 | 2,325,653 | 2,198,255 | 1,798,624 | 1,151,946 |
| Sendai MEA | Sendai | Miyagi | 2,077 | 5,414 | 1,574,942 | 1,549,746 | 1,466,989 | 1,202,186 | 850,828 |
| Okayama MEA | Okayama | Okayama | 2,710 | 5,539 | 1,532,146 | 1,523,286 | 1,486,785 | 1,391,802 | 1,112,534 |
| Maebashi MEA | Maebashi, Takasaki, Isesaki | Gunma | 2,653 | 5,252 | 1,453,528 | 1,459,895 | 1,439,840 | 1,327,539 | 1,142,579 |
| Hiroshima MEA | Hiroshima | Hiroshima | 1,811 | 5,414 | 1,411,848 | 1,395,530 | 1,358,060 | 1,197,465 | 838,010 |
| Kitakyushu MEA | Kitakyushu | Fukuoka | 1,222 | 4,889 | 1,370,169 | 1,392,145 | 1,429,463 | 1,459,479 | 1,397,618 |
| Hamamatsu MEA | Hamamatsu | Shizuoka | 2,051 | 4,763 | 1,133,879 | 1,139,189 | 1,086,360 | 972,356 | 818,902 |
| Utsunomiya MEA | Utsunomiya | Tochigi | 3,851 | 4,454 | 1,120,057 | 1,121,696 | 1,093,966 | 973,728 | 817,786 |
| Kumamoto MEA | Kumamoto | Kumamoto | 1,604 | 3,490 | 1,102,398 | 1,089,366 | 1,053,231 | 924,422 | 795,803 |
| Niigata MEA | Niigata | Niigata | 2,138 | 3,805 | 1,071,152 | 1,082,159 | 1,073,394 | 1,002,106 | 875,150 |
| Shizuoka MEA | Shizuoka | Shizuoka | 1,677 | 4,024 | 1,001,597 | 1,008,368 | 1,016,145 | 966,153 | 808,584 |
See also
References
- ↑ Statistics Bureau of Japan, 2015 Census Final Data
- ↑ Statistics Bureau of Japan, 2010 Census Final Data
- ↑ Statistics Bureau of Japan
- ↑ Statistics Bureau of Japan, 2005 Census Final Data
- ↑ "地域経済の将来動向分析に関する調査研究" [Survey on the future trend analysis of the regional economy] (in Japanese). Ministry of Economy, Trade and Industry of Japan. Retrieved 2017-04-15.
- ↑ "Metropolitan Employment Area (MEA) Data". Center for Spatial Information Science, the University of Tokyo. Retrieved 2017-04-15.