List of countries by vehicles per capita
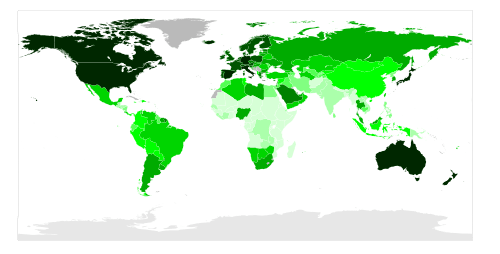
Map of vehicles per capita 2011
This article is a list of countries by the number of road motor vehicles per 1,000 inhabitants. This includes cars, vans, buses, and freight and other trucks; but excludes motorcycles and other two-wheelers.
|
See also
References
- 1 2 3 4 5 6 7 8 9 10 11 12 13 14 15 16 17 18 19 20 21 22 23 24 25 26 27 28 29 30 31 32 33 34 35 36 37 38 39 40 41 42 43 44 45 46 47 48 49 50 51 52 53 54 55 56 57 58 59 60 61 62 63 64 65 66 67 68 69 70 71 72 73 74 75 76 77 78 79 80 81 82 83 84 85 86 87 88 89 90 91 92 93 94 95 96 97 98 99 100 101 102 103 104 105 106 107 "World Bank Data: Motor vehicles (per 1,000 people)". The World Bank. Archived from the original on February 9, 2014. Retrieved 2014-02-09. Archived.
- 1 2 "Vehicle Statistics: Cars Per Capita". Capitol Tires.
- ↑ "2016 New Zealand Vehicle Fleet Annual Statistics" (PDF). New Zealand Ministry of Transport. 2017-09-04.
- ↑ "Passenger cars in the EU - Statistics Explained". Retrieved 2018-09-08.
- ↑ "9309.0 - Motor Vehicle Census, Australia, 31 Jan 2017". Australian Bureau of Statistics. 28 July 2017. Retrieved 4 October 2017.
- ↑ "World Vehicles In Use All Vehicles" (PDF). Retrieved 2016-02-19.
- ↑ "Passenger cars in the EU - Statistics Explained". Retrieved 2018-09-08.
- ↑ "Motor vehicle registrations, by province and territory". Statistics Canada. Retrieved 2017-11-02. (Motorcycles and mopeds subtracted)
- ↑ "Passenger cars in the EU - Statistics Explained". Retrieved 2018-09-08.
- ↑ "Passenger cars in the EU - Statistics Explained". Retrieved 2018-09-08.
- ↑ "Passenger cars in the EU - Statistics Explained". Retrieved 2018-09-08.
- ↑ "Passenger cars in the EU - Statistics Explained". Retrieved 2018-09-08.
- ↑ "自動車保有台数に関する統計情報" (PDF). 日本自動車整備振興会連合会. Retrieved 2017-11-01.
- ↑ "Passenger cars in the EU - Statistics Explained". Retrieved 2018-09-08.
- ↑ "Passenger cars in the EU - Statistics Explained". Retrieved 2018-09-08.
- ↑ "Passenger cars in the EU - Statistics Explained". Retrieved 2018-09-08.
- ↑ "Passenger cars in the EU - Statistics Explained". Retrieved 2018-09-08.
- ↑ "Passenger cars in the EU - Statistics Explained". Retrieved 2018-09-08.
- ↑ "Passenger cars in the EU - Statistics Explained". Retrieved 2018-09-08.
- ↑ "Passenger cars in the EU - Statistics Explained". Retrieved 2018-09-08.
- ↑ "Passenger cars in the EU - Statistics Explained". Retrieved 2018-09-08.
- ↑ "Passenger cars in the EU - Statistics Explained". Retrieved 2018-09-08.
- ↑ https://www.ceicdata.com/en/indicator/iraq/motor-vehicle-registered. Missing or empty
|title=(help) - ↑ "Passenger cars in the EU - Statistics Explained". Retrieved 2018-09-08.
- ↑ "Passenger cars in the EU - Statistics Explained". Retrieved 2018-09-08.
- ↑ "Passenger cars in the EU - Statistics Explained". Retrieved 2018-09-08.
- ↑ "Passenger cars in the EU - Statistics Explained". Retrieved 2018-09-08.
- ↑ "Passenger cars in the EU - Statistics Explained". Retrieved 2018-09-08.
- ↑ "Passenger cars in the EU - Statistics Explained". Retrieved 2018-09-08.
- ↑ "Passenger cars in the EU - Statistics Explained". Retrieved 2018-09-08.
- ↑ "Passenger cars in the EU - Statistics Explained". Retrieved 2018-09-08.
- ↑ "Car Ownership". www.fp7-compass-keytrends.eu.
- ↑ http://www.oecd-ilibrary.org/docserver/download/7516011ec026.pdf?expires=1488091191&id=id&accname=guest&checksum=822A69BD42D544B535A8276B579DBBCD
- ↑ "Passenger cars in the EU - Statistics Explained". Retrieved 2018-09-08.
- ↑ "Passenger cars in the EU - Statistics Explained". Retrieved 2018-09-08.
- ↑ "Passenger cars in the EU - Statistics Explained". Retrieved 2018-09-08.
- 1 2 3 4 5 6 7 8 9 10 11 12 13 14 15 "Motor vehicles (most recent) by country". NationMaster.com. Retrieved April 2012. Check date values in:
|accessdate=(help) - ↑ "Passenger cars in the EU - Statistics Explained". Retrieved 2018-09-08.
- ↑ "כלי רכב מנועיים 2016" (PDF). Israel Central Bureau of Statistics.
- ↑ "כלי רכב מנועיים 2017". Israel Central Bureau of Statistics.
- ↑ "Passenger cars in the EU - Statistics Explained". Retrieved 2018-09-08.
- ↑ https://www.fedstat.ru/indicator/36228
- ↑ "Passenger cars in the EU - Statistics Explained". Retrieved 2018-09-08.
- ↑ "Passenger cars in the EU - Statistics Explained". Retrieved 2018-09-08.
- 1 2 "Motor Vehicle Registration". Ministry of Transportation and Communications, R.O.C.
- ↑ "Montenegrin statistical office, 2017" (PDF). Retrieved 2017-11-13.
- ↑ "Serbian statistical office, 2017" (PDF). Retrieved 2017-11-13.
- ↑ "خودروی غیر استاندارد در کشور نداریم". www.asrekhodro.com.
- ↑ "Passenger cars in the EU - Statistics Explained". Retrieved 2018-09-08.
- ↑ "Motorlu Kara Taşıtları, Haziran 2015" (in Turkish). TÜİK. Retrieved 29 October 2015.
- ↑ "Усть-Каменогорск Всё больше". www.yk.kz.
- ↑ "Frota de veículos, por tipo e com placa, segundo as Grandes Regiões e Unidades da Federação - 2016" (in Portuguese). Denatran. July 2016.
- ↑ https://www.scmp.com/news/china/economy/article/2088876/chinas-more-300-million-vehicles-drive-pollution-congestion
- ↑ "Anuarios Parque de Vehiculos en Circulacion". INE. Retrieved 29 March 2015.
- ↑ จำนวนราษฎรทั่วราชอาณาจักร แยกเป็นกรุงเทพมหานครและจังหวัดต่าง ๆ ตามหลักฐานการทะเบียนราษฎร ณ วันที่ 31 ธันวาคม 2555 (in Thai). สำนักทะเบียนกลาง กรมการปกครอง. 2013-03-11. Retrieved 2013-10-27.
- ↑ "Number of Vehicle Registered in Thailand as of 31 December 2012" (PDF). กรมการขนส่งทางบก. Retrieved 2013-10-27.
- ↑ http://www.autoconsulting.com.ua/article.php?sid=35442
- ↑ http://paap.am/datas/zlawdocs/78eaf07bafa90a97efeb5aa523aba263.pdf
- ↑ "Nauru General Data". Populstat.info. Retrieved 2012-06-02.
- ↑ "Motor vehicles (per 1,000 people)". WorldBank. Retrieved 2014-11-03.
- ↑ "Archived copy". Archived from the original on 2016-02-11. Retrieved 2016-02-11.
- ↑ "Grenada General Data". Populstat.info. Retrieved 2012-06-02.
- ↑ "Anuario de Estadísticas de Transportes 2014" (PDF).
- ↑ "Vehicle Population".
- ↑ Idowu, Sylvester, ed. (15 June 2016). "FRSC: 10.6mn Registered Vehicles to Ply Nigerian Roads in 2016".
- ↑ https://data.gov.in/catalog/stateut-wise-percentage-share-total-registered-motor-vehicles
- ↑ "Uzbekistan General Data". Populstat.info. Retrieved 2012-06-02.
- ↑ SongMoi.vn. "Lượng xe máy tại Việt Nam đã 'vỡ kế hoạch' của năm 2020". Tạp chí báo điện tử Songmoi.vn.
- ↑
- ↑ "Gabon General Data". Populstat.info. Retrieved 2012-06-02.
- ↑ "Equatorial Guinea General Data". Populstat.info. Retrieved 2012-06-02.
- ↑ "North Korea General Data". Populstat.info. Retrieved 2012-06-02.
- ↑
- ↑ "Lesotho General Data". Populstat.info. Retrieved 2012-06-02.
- ↑ "Solomon Islands General Data". Populstat.info. Retrieved 2012-06-02.
| By country |
| ||||||||||||
|---|---|---|---|---|---|---|---|---|---|---|---|---|---|
| Data | |||||||||||||
| History | |||||||||||||
| Manufacturers | |||||||||||||
| Organisations | |||||||||||||
| Related topics |
| ||||||||||||
ref>"Solomon Islands General Data". Populstat.info. Retrieved 2012-06-02.
This article is issued from
Wikipedia.
The text is licensed under Creative Commons - Attribution - Sharealike.
Additional terms may apply for the media files.