Lake San Marcos, California
| Lake San Marcos | |
|---|---|
| census-designated place | |
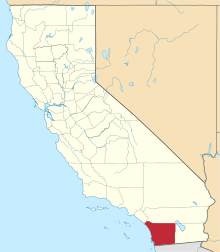
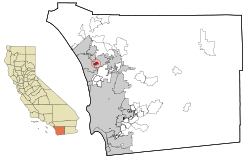 Location in San Diego County and the state of California | |
 Lake San Marcos Location in the United States | |
| Coordinates: 33°7′21″N 117°12′34″W / 33.12250°N 117.20944°WCoordinates: 33°7′21″N 117°12′34″W / 33.12250°N 117.20944°W | |
| Country |
|
| State |
|
| County | San Diego |
| Area[1] | |
| • Total | 1.807 sq mi (4.679 km2) |
| • Land | 1.721 sq mi (4.457 km2) |
| • Water | 0.086 sq mi (0.223 km2) 4.76% |
| Elevation | 525 ft (160 m) |
| Population (2010) | |
| • Total | 4,437 |
| • Density | 2,500/sq mi (950/km2) |
| Time zone | UTC-8 (PST) |
| • Summer (DST) | UTC-7 (PDT) |
| ZIP code | 92069 |
| Area codes | 442/760 |
| FIPS code | 06-39724 |
| GNIS feature ID | 1660879 |
Lake San Marcos is a census-designated place (CDP) in the North County region of the San Diego metropolitan area. It is nominally independent of San Marcos proper, but functionally subservient to the city.
Geography
Lake San Marcos is adjacent to the City of San Marcos. It is a resort-based community surrounding the Lake San Marcos reservoir. It is located at 33°7′21″N 117°12′34″W / 33.12250°N 117.20944°W (33.122562, -117.209411).[2]
According to the United States Census Bureau, the CDP has a total area of 1.8 square miles (4.7 km2). 1.7 square miles (4.4 km2) of it is land and 0.1 square miles (0.26 km2) of it (4.76%) is water. The lake after which the area is named is a large artificial pond created for recreational purposes.
Demographics
| Historical population | |||
|---|---|---|---|
| Census | Pop. | %± | |
| U.S. Decennial Census[3] | |||
The population was 4,437 at the 2010 census, up from 4,138 at the 2000 census. The community attracts a large number of retired and elderly residents.
2010
The 2010 United States Census[4] reported that Lake San Marcos had a population of 4,437. The population density was 2,455.8 people per square mile (948.2/km²). The racial makeup of Lake San Marcos was 3,978 (89.7%) White, 37 (0.8%) African American, 20 (0.5%) Native American, 133 (3.0%) Asian, 3 (0.1%) Pacific Islander, 186 (4.2%) from other races, and 80 (1.8%) from two or more races. Hispanic or Latino of any race were 464 persons (10.5%).
The Census reported that 4,435 people (100% of the population) lived in households, 0 (0%) lived in non-institutionalized group quarters, and 2 (0%) were institutionalized.
There were 2,328 households, out of which 221 (9.5%) had children under the age of 18 living in them, 1,112 (47.8%) were opposite-sex married couples living together, 131 (5.6%) had a female householder with no husband present, 56 (2.4%) had a male householder with no wife present. There were 81 (3.5%) unmarried opposite-sex partnerships, and 16 (0.7%) same-sex married couples or partnerships. 877 households (37.7%) were made up of individuals and 659 (28.3%) had someone living alone who was 65 years of age or older. The average household size was 1.91. There were 1,299 families (55.8% of all households); the average family size was 2.45.
The population was spread out with 366 people (8.2%) under the age of 18, 184 people (4.1%) aged 18 to 24, 597 people (13.5%) aged 25 to 44, 1,212 people (27.3%) aged 45 to 64, and 2,078 people (46.8%) who were 65 years of age or older. The median age was 63.3 years. For every 100 females, there were 79.3 males. For every 100 females age 18 and over, there were 76.7 males.
There were 2,533 housing units at an average density of 1,402.0 per square mile (541.3/km²), of which 1,835 (78.8%) were owner-occupied, and 493 (21.2%) were occupied by renters. The homeowner vacancy rate was 2.3%; the rental vacancy rate was 5.3%. 3,417 people (77.0% of the population) lived in owner-occupied housing units and 1,018 people (22.9%) lived in rental housing units.
2000
As of the census[5] of 2000, there were 4,138 people, 2,269 households, and 1,300 families residing in the CDP. The population density was 2,283.4 inhabitants per square mile (882.7/km²). There were 2,455 housing units at an average density of 1,354.7 per square mile (523.7/km²). The racial makeup of the CDP was 93.86% White, 0.27% African American, 0.14% Native American, 1.74% Asian, 0.12% Pacific Islander, 2.46% from other races, and 1.40% from two or more races. Hispanic or Latino of any race were 5.73% of the population.
There were 2,269 households out of which 5.4% had children under the age of 18 living with them, 52.2% were married couples living together, 3.9% had a female householder with no husband present, and 42.7% were non-families. 38.1% of all households were made up of individuals and 29.4% had someone living alone who was 65 years of age or older. The average household size was 1.81 and the average family size was 2.29.
In the CDP, the population was spread out with 5.9% under the age of 18, 2.3% from 18 to 24, 10.4% from 25 to 44, 21.0% from 45 to 64, and 60.4% who were 65 years of age or older. The median age was 71 years. For every 100 females, there were 77.1 males. For every 100 females age 18 and over, there were 74.9 males.
The median income for a household in the CDP was $50,857, and the median income for a family was $59,496. Males had a median income of $42,250 versus $30,993 for females. The per capita income for the CDP was $35,768. About 2.1% of families and 3.2% of the population were below the poverty line, including none of those under age 18 and 3.3% of those age 65 or over.
Government
While Lake San Marcos is an independent and unincorporated community, it is also greatly dependent upon the city of San Marcos for many public services, including public schools, the fire department, the Vallecitos Water District, and the San Marcos sheriff station. Lake San Marcos is governed by the Lake San Marcos Community Association, a nonprofit organization.
In the California State Legislature, Lake San Marcos is in the 38th Senate District, represented by Republican Joel Anderson, and in the 75th Assembly District, represented by Republican Marie Waldron.[6]
In the United States House of Representatives, Lake San Marcos is in California's 50th congressional district, represented by Republican Duncan D. Hunter.[7]
References
- ↑ "2010 Census U.S. Gazetteer Files – Places – California". United States Census Bureau.
- ↑ "US Gazetteer files: 2010, 2000, and 1990". United States Census Bureau. 2011-02-12. Retrieved 2011-04-23.
- ↑ "Census of Population and Housing". Census.gov. Retrieved June 4, 2016.
- ↑ "2010 Census Interactive Population Search: CA - Lake San Marcos CDP". U.S. Census Bureau. Retrieved July 12, 2014.
- ↑ "American FactFinder". United States Census Bureau. Retrieved 2008-01-31.
- ↑ "Statewide Database". UC Regents. Retrieved November 28, 2014.
- ↑ "California's 50th Congressional District - Representatives & District Map". Civic Impulse, LLC.