Helensville (New Zealand electorate)
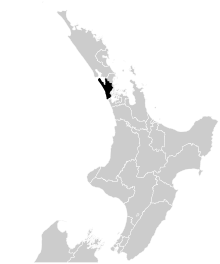
Helensville is a New Zealand parliamentary electorate, returning one Member of Parliament to the House of Representatives. The electorate was first established for the 1978 election and was abolished again in 1984, and has existed again since the 2002 election. The MP for Helensville is Chris Penk of the National Party, who has held the seat since the 2017 general election.
Population centres
The 1977 electoral redistribution was the most overtly political since the Representation Commission had been established through an amendment to the Representation Act in 1886, initiated by Muldoon's National Government.[1] As part of the 1976 census, a large number of people failed to fill out an electoral re-registration card, and census staff had not been given the authority to insist on the card being completed. This had little practical effect for people on the general roll, but it transferred Māori to the general roll if the card was not handed in. Together with a northward shift of New Zealand's population, this resulted in five new electorates having to be created in the upper part of the North Island.[2] The electoral redistribution was very disruptive, and 22 electorates were abolished, while 27 electorates were newly created (including Helensville) or re-established. These changes came into effect for the 1978 election.[3]
In the 1983 electoral redistribution, the Helensville electorate was abolished, and its area went to West Auckland and Rodney.[4] The electorate was re-established in time for the 2002 election in reaction to continued high population growth in and around Auckland. It was made by cutting off the northern flank of the electorate of Waitakere and adding in areas from the electorate of Rodney around its southern boundary.
Helensville covers an area of the rapidly growing northern Auckland urban fringe, drawing Helensville and Kumeu from Rodney District, moving south to take in Paremoremo, Greenhithe and Albany from North Shore City, and finally tacking west to include Whenuapai, Hobsonville and West Harbour from Waitakere City.
History
In the 1978 election, the Helensville electorate was won by Dail Jones, who had been MP for the Waitemata electorate since the 1975 election.[5] After the Helensville electorate was abolished, Jones stood in the West Auckland electorate in the 1984 election but was defeated by the Labour Party candidate, Jack Elder.[6]
Since the Helensville electorate was re-established for the 2002 election, its only MP was the former Prime Minister, John Key, who beat sitting Waitakere MP Brian Neeson to the nomination, and in a tight year for his party, won the electorate by 1,705 votes in a split field when a disgruntled Neeson chose to stand as an independent. Helensville is partly rural, and wealthy beyond the national average, making it a safe National electorate, and Key was returned easily in 2005, 2008 and 2011 with large majorities.
In December 2016, Key announced that he was stepping down as prime minister and would retire from politics before the 2017 general election, citing pressure on his family.[7] The Helensville seat was won in the election by Chris Penk, retaining it for the National Party.
Members of Parliament
Key
National NZ First Labour ACT Green
| Election | Winner | |
|---|---|---|
| 1978 election | Dail Jones | |
| 1981 election | ||
| Electorate abolished in 1984 (see West Auckland and Rodney) | ||
| 2002 election | John Key | |
| 2005 election | ||
| 2008 election | ||
| 2011 election | ||
| 2014 election | ||
| 2017 election | Chris Penk | |
List MPs
Members of Parliament elected from party lists in elections where that person also unsuccessfully contested the Helensville electorate. Unless otherwise stated, all MPs terms began and ended at general elections.
| Election | Winner | |
|---|---|---|
| 2002 election | Dail Jones | |
| 2008 election | Darien Fenton | |
| David Garrett1 | ||
| 2009 | David Clendon2 | |
| 2014 election | Kennedy Graham | |
1 Garrett resigned in September 2010, and his list position was taken by Hilary Calvert
2 Clendon entered Parliament in October 2009 following the resignation of Sue Bradford
Election results
2017 election
| General election, 2017: Helensville[8] | |||||||||
|---|---|---|---|---|---|---|---|---|---|
| Notes: |
Blue background denotes the winner of the electorate vote.
| ||||||||
| Party | Candidate | Votes | % | ±% | Party votes | % | ±% | ||
| National | Chris Penk | 21,704 | 56.12 | −9.05 | 21,958 | 55.83 | −2.56 | ||
| Labour | Kurt Taogaga | 7,096 | 18.35 | +5.66 | 10,012 | 25.45 | +12.95 | ||
| Green | Hayley Holt | 6,758 | 17.47 | +4.75 | 2,971 | 7.55 | −6.00 | ||
| NZ First | Helen Peterson | 2,403 | 6.21 | — | 2,795 | 7.11 | −0.25 | ||
| ACT | Alex Evans | 284 | 7.34 | +2.97 | 319 | 0.81 | +0.07 | ||
| Conservative | 87 | 0.22 | −4.56 | ||||||
| Opportunities | 799 | 2.03 | — | ||||||
| Legalise Cannabis | 112 | 0.28 | −0.17 | ||||||
| Māori | 105 | 0.27 | −0.27 | ||||||
| United Future | 27 | 0.07 | −0.19 | ||||||
| Outdoors | 20 | 0.05 | — | ||||||
| Ban 1080 | 20 | 0.05 | −0.09 | ||||||
| Mana | 13 | 0.03 | — | ||||||
| People's Party | 12 | 0.03 | — | ||||||
| Internet | 9 | 0.02 | — | ||||||
| Democrats | 7 | 0.02 | −0.04 | ||||||
| Informal votes | 264 | 67 | |||||||
| Total Valid votes | 38,676 | 39,333 | |||||||
| National hold | Majority | 14,608 | 37.77 | −14.69 | |||||
2014 election
| General election, 2014: Helensville[9] | |||||||||
|---|---|---|---|---|---|---|---|---|---|
| Notes: |
Blue background denotes the winner of the electorate vote.
| ||||||||
| Party | Candidate | Votes | % | ±% | Party votes | % | ±% | ||
| National | 22,720 | 65.17 | −9.21 | 20,689 | 58.39 | −7.40 | |||
| Green | Kennedy Graham | 4,433 | 12.72 | +5.36 | 4,801 | 13.55 | +4.91 | ||
| Labour | Corie Haddock | 4,425 | 12.69 | −1.45 | 4,430 | 12.50 | −1.85 | ||
| Internet | Laila Harré | 1,315 | 3.77 | +3.77 | |||||
| Conservative | Deborah Dougherty | 963 | 2.76 | −0.07 | 1,692 | 4.78 | +1.27 | ||
| Independent | Penny Bright | 420 | 1.20 | +1.20 | |||||
| ACT | Phelan Pirrie | 302 | 0.87 | +0.36 | 262 | 0.74 | −0.65 | ||
| Independent | Brendan Whyte | 74 | 0.21 | +0.21 | |||||
| NZ First | 2,608 | 7.36 | +2.76 | ||||||
| Internet Mana | 338 | 0.95 | +0.78[lower-alpha 1] | ||||||
| Māori | 192 | 0.54 | +0.02 | ||||||
| Legalise Cannabis | 161 | 0.45 | −0.04 | ||||||
| United Future | 93 | 0.26 | −0.20 | ||||||
| Ban 1080 | 48 | 0.14 | +0.14 | ||||||
| Democrats | 23 | 0.06 | +0.04 | ||||||
| Independent Coalition | 13 | 0.04 | +0.04 | ||||||
| Civilian | 8 | 0.02 | +0.02 | ||||||
| Focus | 3 | 0.01 | +0.01 | ||||||
| Informal votes | 208 | 73 | |||||||
| Total Valid votes | 34,860 | 35,434 | |||||||
| Turnout | 35,507 | 82.29 | +5.65 | ||||||
| National hold | Majority | 18,287 | 52.46 | −7.78 | |||||
2011 election
| General election, 2011: Helensville [10] | |||||||||
|---|---|---|---|---|---|---|---|---|---|
| Notes: |
Blue background denotes the winner of the electorate vote.
| ||||||||
| Party | Candidate | Votes | % | ±% | Party votes | % | ±% | ||
| National | 26,011 | 74.38 | +0.77 | 23,558 | 65.79 | +2.09 | |||
| Labour | Jeremy Greenbrook-Held | 4,945 | 14.14 | -2.97 | 5,138 | 14.35 | -4.11 | ||
| Green | Jeanette Elley | 2,575 | 7.36 | +1.41 | 3,094 | 8.64 | +3.74 | ||
| Conservative | Richard Drayson | 941 | 2.69 | +2.69 | 1,258 | 3.51 | +3.51 | ||
| Legalise Cannabis | Adrian McDermott | 319 | 0.91 | +0.91 | 174 | 0.49 | +0.16 | ||
| ACT | Nick Kearney | 180 | 0.51 | 0-1.72 | 499 | 1.39 | -5.31 | ||
| NZ First | 1,648 | 4.60 | +2.06 | ||||||
| Māori | 186 | 0.52 | +0.03 | ||||||
| United Future | 163 | 0.46 | -0.33 | ||||||
| Mana | 60 | 0.17 | +0.17 | ||||||
| Libertarianz | 19 | 0.05 | -0.004 | ||||||
| Democrats | 8 | 0.02 | +0.001 | ||||||
| Alliance | 4 | 0.01 | -0.04 | ||||||
| Informal votes | 574 | 198 | |||||||
| Total Valid votes | 34,971 | 35,809 | |||||||
| National hold | Majority | 21,066 | 60.24 | +3.74 | |||||
Electorate (as at 11 November 2011): 46,983[11]
2008 election
| General election, 2008: Helensville[12][13] | |||||||||
|---|---|---|---|---|---|---|---|---|---|
| Notes: |
Blue background denotes the winner of the electorate vote.
| ||||||||
| Party | Candidate | Votes | % | ±% | Party votes | % | ±% | ||
| National | 26,771 | 73.61 | +9.51 | 23,559 | 63.69 | +8.60 | |||
| Labour | Darien Fenton | 6,224 | 17.11 | -9.77 | 6,826 | 18.45 | -9.52 | ||
| Green | David Clendon | 2,166 | 5.96 | +5.79 | 1,814 | 4.90 | +0.87 | ||
| ACT | David Garrett | 811 | 2.23 | +1.10 | 2,481 | 6.71 | +4.36 | ||
| United Future | Angela Lovelock | 309 | 0.85 | -0.82 | 289 | 0.78 | -1.69 | ||
| Libertarianz | Peter Osborne | 89 | 0.24 | 21 | 0.06 | +0.01 | |||
| NZ First | 940 | 2.54 | -3.34 | ||||||
| Progressive | 195 | 0.53 | -0.28 | ||||||
| Family Party | 182 | 0.49 | |||||||
| Māori | 182 | 0.49 | +0.08 | ||||||
| Bill and Ben | 170 | 0.46 | |||||||
| Legalise Cannabis | 131 | 0.35 | +0.16 | ||||||
| Kiwi | 105 | 0.28 | |||||||
| Pacific | 45 | 0.12 | |||||||
| Alliance | 19 | 0.05 | +0.02 | ||||||
| Workers Party | 9 | 0.02 | |||||||
| Democrats | 8 | 0.02 | ±0.00 | ||||||
| RAM | 8 | 0.02 | |||||||
| RONZ | 4 | 0.01 | ±0.00 | ||||||
| Informal votes | 251 | 110 | |||||||
| Total Valid votes | 36,370 | 36,988 | |||||||
| Turnout | 37,298 | 82.27 | -0.58 | ||||||
| National hold | Majority | 20,547 | 56.49 | ||||||
2005 election
| General election, 2005: Helensville[13][14][15] | |||||||||
|---|---|---|---|---|---|---|---|---|---|
| Notes: |
Blue background denotes the winner of the electorate vote.
| ||||||||
| Party | Candidate | Votes | % | ±% | Party votes | % | ±% | ||
| National | 22,008 | 64.10 | +29.92 | 19,224 | 55.09 | +29.28 | |||
| Labour | Judy Lawley | 9,230 | 26.88 | -0.24 | 9,761 | 27.97 | -2.86 | ||
| NZ First | Dail Jones | 1,400 | 4.08 | -5.45 | 2,051 | 5.88 | -6.06 | ||
| United Future | Andrea Deeth | 573 | 1.67 | -2.47 | 863 | 2.47 | -5.82 | ||
| ACT | Stephen Langford-Tebby | 389 | 1.13 | 821 | 2.35 | -10.26 | |||
| Māori | Awa Hudson | 359 | 1.05 | 142 | 0.41 | ||||
| Progressive | Julian Aaron | 318 | 0.93 | -0.02 | 218 | 0.81 | -0.08 | ||
| Direct Democracy | Helen Koster | 58 | 0.17 | 11 | 0.03 | ||||
| Green | 1,407 | 4.03 | -1.99 | ||||||
| Destiny | 151 | 0.43 | |||||||
| Legalise Cannabis | 66 | 0.19 | -0.21 | ||||||
| Christian Heritage | 48 | 0.14 | -0.85 | ||||||
| Libertarianz | 16 | 0.05 | |||||||
| Alliance | 9 | 0.03 | -1.00 | ||||||
| Democrats | 8 | 0.02 | |||||||
| Family Rights | 8 | 0.02 | |||||||
| 99 MP | 5 | 0.01 | |||||||
| RONZ | 5 | 0.01 | |||||||
| One NZ | 4 | 0.01 | -0.04 | ||||||
| Informal votes | 253 | 110 | |||||||
| Total Valid votes | 34,335 | 34,896 | |||||||
| Turnout | 35,222 | 82.85 | +3.21 | ||||||
| National hold | Majority | 12,778 | 37.22 | +31.26 | |||||
2002 election
| General election, 2002: Helensville[14][16] | |||||||||
|---|---|---|---|---|---|---|---|---|---|
| Notes: |
Blue background denotes the winner of the electorate vote.
| ||||||||
| Party | Candidate | Votes | % | ±% | Party votes | % | ±% | ||
| National | John Key | 9,775 | 34.18 | 7,524 | 25.81 | ||||
| Labour | Gary Russell | 8,070 | 28.21 | 8,988 | 30.83 | ||||
| Independent | Brian Neeson | 5,644 | 19.73 | ||||||
| NZ First | Dail Jones | 2,725 | 9.53 | 3,481 | 11.94 | ||||
| United Future | Andrea Deeth | 1,184 | 4.14 | 2,416 | 8.29 | ||||
| Alliance | Helen MacKinlay | 581 | 2.03 | 299 | 1.03 | ||||
| Christian Heritage | David Simpkin | 350 | 1.22 | 288 | 0.99 | ||||
| Progressive | Clare Dickson | 273 | 0.95 | 272 | 0.93 | ||||
| ACT | 3,676 | 12.61 | |||||||
| Green | 1,755 | 6.02 | |||||||
| ORNZ | 313 | 1.07 | |||||||
| Legalise Cannabis | 118 | 0.40 | |||||||
| One NZ | 15 | 0.05 | |||||||
| Mana Māori | 10 | 0.03 | |||||||
| NMP | 2 | 0.01 | |||||||
| Informal votes | 327 | 78 | |||||||
| Total Valid votes | 28,602 | 29,157 | |||||||
| Turnout | 29,428 | 79.64 | |||||||
| National win new seat | Majority | 1,705 | 5.96 | ||||||
1981 election
| Party | Candidate | Votes | % | ± | |
|---|---|---|---|---|---|
| National | Dail Jones | 8,242 | 35.85 | -4.58 | |
| Labour | Jack Elder | 8,026 | 34.91 | +0.71 | |
| Social Credit | David Howes | 6,718 | 29.22 | ||
| Majority | 216 | 0.93 | -5.29 | ||
| Turnout | 22,986 | 89.05 | +19.21 | ||
| Registered electors | 25,812 | ||||
1978 election
| Party | Candidate | Votes | % | ± | |
|---|---|---|---|---|---|
| National | Dail Jones | 7,783 | 40.43 | ||
| Labour | Jack Elder | 6,584 | 34.20 | ||
| Social Credit | Chris Lynch | 4,510 | 23.43 | ||
| Values | D A P Worley | 370 | 1.92 | ||
| Majority | 1,199 | 6.22 | |||
| Turnout | 19,247 | 69.84 | |||
| Registered electors | 27,558 | ||||
Table footnotes
Notes
- ↑ McRobie 1989, pp. 8–9, 51, 119.
- ↑ McRobie 1989, p. 119.
- ↑ McRobie 1989, pp. 115–120.
- ↑ McRobie 1989, pp. 118–123.
- ↑ Wilson 1985, p. 208.
- ↑ Wilson 1985, pp. 194, 208.
- ↑ "John Key resigns as Prime Minister of New Zealand, cites family reasons for leaving". NZ Herald – nzherald.co.nz. 5 December 2016. Retrieved 27 September 2017.
- ↑ "Official Count Results -- Helensville (2017)". Electoral Commission. 7 October 2017. Retrieved 12 October 2017.
- ↑ Electoral Commission (10 October 2014). "Official Count Results – Helensville". Retrieved 31 January 2016.
- ↑ Helensville results, 2011
- ↑ "Enrolment statistics". Electoral Commission. 4 November 2011. Retrieved 12 November 2011.
- ↑ Election results 2008 Archived 2008-12-11 at the Wayback Machine.
- 1 2 "Helensville:Electoral Profile". New Zealand Parliament. 26 August 2009. Retrieved 5 October 2009.
- 1 2 "Electorate Profile Helensville" (PDF). New Zealand Parliament. 1 November 2005. Retrieved 5 October 2009.
- ↑ Election result 2005
- ↑ Election results 2002
- 1 2 Norton 1988, pp. 242.
References
- McRobie, Alan (1989). Electoral Atlas of New Zealand. Wellington: GP Books. ISBN 0-477-01384-8.
- Wilson, James Oakley (1985) [First published in 1913]. New Zealand Parliamentary Record, 1840–1984 (4th ed.). Wellington: V.R. Ward, Govt. Printer. OCLC 154283103.
- Norton, Clifford (1988). New Zealand Parliamentary Election Results 1946–1987: Occasional Publications No 1, Department of Political Science. Wellington: Victoria University of Wellington. ISBN 0-475-11200-8.
External links
- Electorate Profile Parliamentary Library
Coordinates: 36°40′47″S 174°26′58″E / 36.6797°S 174.4494°E