Clutha-Southland
Clutha-Southland is a parliamentary constituency returning one member to the New Zealand House of Representatives. The current MP for Clutha Southland is Hamish Walker of the National Party. He has held the seat since the 2017 general election.
Population centres
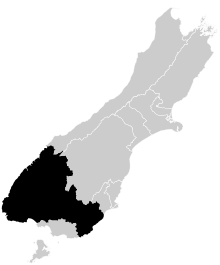
Clutha-Southland was promulgated as one of the original 65 MMP electorates, centred on Southland district and covering an area stretching from Fiordland across the far south of the South Island to the south Otago coast. Its largest population centres are Gore and Balclutha. In 2008, the seat of Otago was abolished and split between the Waitaki and Clutha-Southland electorates, and parts of Central Otago, primarily around Arrowtown, Queenstown and Roxburgh were also transferred to Clutha-Southland.
Clutha-Southland is the successor to the old Wallace, Clutha and Awarua constituencies. Its boundaries had changed at all three redistributions undertaken since its creation, as dwindling populations in both the old Clutha-Southland electorate and in the neighbouring Invercargill electorate have forced both seats northwards to ensure every electorate population stays within certain limits. This trend stopped in the 2013 redistribution, however, with both the Clutha-Southland and Invercargill electorates remaining unchanged in area.[1]
History
Because of its largely rural nature, Clutha-Southland is one of the National Party's safest seats. Bill English, who is the former Prime Minister, held the seat from 1996 to 2014. English announced in January 2014 that he would retire as the electorate MP at the 2014 general election, becoming a list MP only.[2][3]
Todd Barclay won the 2014 election by a significant margin over Labour's Liz Craig,[4] obtaining nearly 64% of the candidate votes.[5] Barclay became at that time the youngest MP in the House of Representatives.[6] In 2017, he announced he would not stand for re-election at the 2017 election, after revealing he had secretly recorded staff in his office without their consent.[7] The seat was won at the election by Hamish Walker, retaining it for the National Party.
Members of Parliament for Clutha-Southland
The electorate has been represented by two members of parliament so far.
| Election | Winner | |
|---|---|---|
| 1996 election | Bill English | |
| 1999 election | ||
| 2002 election | ||
| 2005 election | ||
| 2008 election | ||
| 2011 election | ||
| 2014 election | Todd Barclay | |
| 2017 election | Hamish Walker | |
List MPs
Members of Parliament elected from party lists in elections where that person also unsuccessfully contested the electorate. Unless otherwise stated, all MPs terms began and ended at general elections.
| Election | Winner | |
|---|---|---|
| 2005 | Lesley Soper | |
| 2017 election | Mark Patterson | |
Election results
2017 election
| General election, 2017: Clutha-Southland[8] | |||||||||
|---|---|---|---|---|---|---|---|---|---|
| Notes: |
Blue background denotes the winner of the electorate vote.
| ||||||||
| Party | Candidate | Votes | % | ±% | Party votes | % | ±% | ||
| National | Hamish Walker | 21,819 | 59.89 | -4.18 | 21,915 | 59.26 | -4.12 | ||
| Labour | Cherie Chapman | 7,465 | 20.49 | +0.66 | 8,960 | 24.22 | +9.51 | ||
| NZ First | Mark Patterson | 3,485 | 9.57 | — | 2,900 | 7.84 | +1.60 | ||
| Green | Rachael Goldsmith | 2,650 | 7.27 | +0.15 | 1,654 | 4.47 | -3.26 | ||
| Ban 1080 | Brian Adams | 674 | 1.85 | -0.87 | 144 | 0.39 | -0.39 | ||
| Independent | Joe Stringer | 200 | 0.55 | – | |||||
| Conservative | Lachie Ashton | 141 | 0.39 | -3.78 | 75 | 0.20 | -4.84 | ||
| Opportunities | 894 | 2.42 | — | ||||||
| ACT | 141 | 0.38 | +0.02 | ||||||
| Legalise Cannabis | 118 | 0.32 | -0.22 | ||||||
| Māori | 95 | 0.26 | -0.07 | ||||||
| United Future | 29 | 0.07 | -0.13 | ||||||
| Outdoors | 26 | 0.07 | — | ||||||
| People's Party | 13 | 0.04 | — | ||||||
| Democrats | 10 | 0.03 | -0.08 | ||||||
| Internet | 5 | 0.01 | -0.45[lower-alpha 1] | ||||||
| Mana | 4 | 0.01 | —0.45[lower-alpha 2] | ||||||
| Informal votes | 359 | 171 | |||||||
| Total Valid votes | 36,434 | 36,983 | |||||||
| Turnout | 37,154 | ||||||||
| National hold | Majority | 14,354 | 39.40 | -4.83 | |||||
2014 election
| General election, 2014: Clutha-Southland[9] | |||||||||
|---|---|---|---|---|---|---|---|---|---|
| Notes: |
Blue background denotes the winner of the electorate vote.
| ||||||||
| Party | Candidate | Votes | % | ±% | Party votes | % | ±% | ||
| National | Todd Barclay | 21,561 | 64.06 | -4.76 | 21,694 | 63.37 | +0.48 | ||
| Labour | Liz Craig | 6,675 | 19.83 | +3.06 | 5,036 | 14.71 | -1.50 | ||
| Green | Rachael Goldsmith | 2,398 | 7.13 | -1.35 | 2,647 | 7.73 | -0.91 | ||
| Conservative | Lachie Ashton | 1,403 | 4.17 | +1.63 | 1,726 | 5.04 | +1.93 | ||
| Ban 1080 | James Veint | 915 | 2.71 | — | 268 | 0.78 | — | ||
| ACT | Don Nicolson | 447 | 1.33 | -1.23 | 122 | 0.36 | -1.48 | ||
| Independent Coalition | Karl Barkley | 168 | 0.50 | — | 32 | 0.09 | — | ||
| Democrats | Jason Jobsis | 88 | 0.26 | -0.15 | 36 | 0.11 | -0.13 | ||
| NZ First | 2,135 | 6.23 | +1.35 | ||||||
| Legalise Cannabis | 184 | 0.54 | -0.12 | ||||||
| Internet Mana | 158 | 0.46 | +0.31[lower-alpha 3] | ||||||
| Māori | 113 | 0.33 | -0.10 | ||||||
| United Future | 68 | 0.20 | -0.61 | ||||||
| Civilian | 10 | 0.03 | — | ||||||
| Focus | 0 | 0.00 | — | ||||||
| Informal votes | 370 | 107 | |||||||
| Total Valid votes | 34,025 | 34,336 | |||||||
| Turnout | 34,443 | 78.51 | +4.68 | ||||||
| National hold | Majority | 14,886 | 44.23 | −7.83 | |||||
2011 election
| General election, 2011: Clutha-Southland[10] | |||||||||
|---|---|---|---|---|---|---|---|---|---|
| Notes: |
Blue background denotes the winner of the electorate vote.
| ||||||||
| Party | Candidate | Votes | % | ±% | Party votes | % | ±% | ||
| National | 21,375 | 68.83 | +0.96 | 20,020 | 62.89 | +3.03 | |||
| Labour | Tat Loo | 5,207 | 16.77 | -4.69 | 5,160 | 16.21 | -7.73 | ||
| Green | Rachael Goldsmith | 2,633 | 8.48 | +1.57 | 2,751 | 8.64 | +3.54 | ||
| ACT | Don Nicolson | 796 | 2.56 | +0.79 | 583 | 1.83 | -2.06 | ||
| Conservative | Ross Calverley | 787 | 2.53 | +2.53 | 992 | 3.12 | +3.12 | ||
| Sovereignty Party | Tony Corbett | 130 | 0.42 | +0.42 | |||||
| Democrats | Robert Mills | 128 | 0.41 | +0.41 | 75 | 0.24 | +0.18 | ||
| NZ First | 1,556 | 4.89 | +2.02 | ||||||
| United Future | 259 | 0.81 | +0.06 | ||||||
| Legalise Cannabis | 210 | 0.66 | +0.27 | ||||||
| Māori | 136 | 0.43 | +0.01 | ||||||
| Mana | 48 | 0.15 | +0.15 | ||||||
| Libertarianz | 24 | 0.08 | +0.03 | ||||||
| Alliance | 17 | 0.05 | -0.13 | ||||||
| Informal votes | 810 | 209 | |||||||
| Total Valid votes | 31,056 | 31,831 | |||||||
| National hold | Majority | 16,168 | 52.06 | +5.65 | |||||
Electorate (as at 26 November 2011): 43,395[11]
2008 election
| General election, 2008: Clutha-Southland[12] | |||||||||
|---|---|---|---|---|---|---|---|---|---|
| Notes: |
Blue background denotes the winner of the electorate vote.
| ||||||||
| Party | Candidate | Votes | % | ±% | Party votes | % | ±% | ||
| National | 22,631 | 67.87 | +1.39 | 20,235 | 59.87 | +2.73 | |||
| Labour | Don Pryde | 7,156 | 21.46 | -1.74 | 8,091 | 23.94 | -4.76 | ||
| Green | Tim Gow | 2,304 | 6.91 | +4.23 | 1,726 | 5.11 | +2.74 | ||
| ACT | Roly Henderson | 590 | 1.77 | +0.18 | 1,315 | 3.89 | +1.98 | ||
| Family Party | Paul Tankard | 515 | 1.54 | +1.54 | 193 | 0.57 | +0.57 | ||
| Alliance | Marvin Hubbard | 149 | 0.45 | +0.45 | 63 | 0.19 | +0.11 | ||
| NZ First | 968 | 2.86 | -1.70 | ||||||
| Bill and Ben | 259 | 0.77 | +0.77 | ||||||
| United Future | 254 | 0.75 | -2.64 | ||||||
| Progressive | 226 | 0.67 | -0.09 | ||||||
| Māori | 141 | 0.42 | -0.21 | ||||||
| Legalise Cannabis | 131 | 0.39 | +0.13 | ||||||
| Kiwi | 131 | 0.39 | +0.39 | ||||||
| Democrats | 18 | 0.05 | -0.03 | ||||||
| Workers Party | 18 | 0.05 | +0.05 | ||||||
| Libertarianz | 16 | 0.05 | -0.02 | ||||||
| Pacific | 8 | 0.02 | +0.02 | ||||||
| RAM | 4 | 0.01 | +0.01 | ||||||
| RONZ | 2 | 0.01 | -0.004 | ||||||
| Informal votes | 354 | 142 | |||||||
| Total Valid votes | 33,345 | 33,799 | |||||||
| National hold | Majority | 15,475 | 46.41 | +3.14 | |||||
2005 election
| General election, 2005: Clutha-Southland | |||||||||
|---|---|---|---|---|---|---|---|---|---|
| Notes: |
Blue background denotes the winner of the electorate vote.
| ||||||||
| Party | Candidate | Votes | % | ±% | Party votes | % | ±% | ||
| National | 20,020 | 66.48 | +10.83 | 17,334 | 57.14 | +16.45 | |||
| Labour | David Talbot | 6,988 | 23.20 | 8,705 | 28.70 | -8.62 | |||
| NZ First | Dave Mackie | 999 | 3.32 | -0.33 | 1,386 | 4.57 | -2.20 | ||
| Green | Robert Guyton | 808 | 2.68 | 719 | 2.37 | -1.08 | |||
| United Future | Joy Lietze | 701 | 2.33 | -0.23 | 1,028 | 3.39 | -3.21 | ||
| ACT | John Fraser | 479 | 1.59 | 579 | 1.91 | -3.20 | |||
| Independent | David Webber | 121 | 0.40 | +0.15 | |||||
| Progressive | 230 | 0.76 | -0.26 | ||||||
| Destiny | 99 | 0.33 | |||||||
| Legalise Cannabis | 79 | 0.26 | -0.24 | ||||||
| Māori | 63 | 0.21 | |||||||
| Democrats | 26 | 0.09 | |||||||
| Christian Heritage | 24 | 0.08 | -1.07 | ||||||
| Alliance | 23 | 0.08 | -0.69 | ||||||
| 99 MP | 13 | 0.04 | |||||||
| Family Rights | 9 | 0.03 | |||||||
| Libertarianz | 7 | 0.02 | |||||||
| One NZ | 6 | 0.02 | -0.02 | ||||||
| RONZ | 3 | 0.01 | |||||||
| Direct Democracy | 2 | 0.01 | |||||||
| Informal votes | 211 | 150 | |||||||
| Total Valid votes | 30,116 | 30,335 | |||||||
| National hold | Majority | 13,032 | 43.28 | +19.84 | |||||
2002 election
| General election, 2002: Clutha-Southland | |||||||||
|---|---|---|---|---|---|---|---|---|---|
| Notes: |
Blue background denotes the winner of the electorate vote.
| ||||||||
| Party | Candidate | Votes | % | ±% | Party votes | % | ±% | ||
| National | 16,159 | 55.65 | +4.43 | 11,881 | 40.69 | -1.36 | |||
| Labour | Lesley Soper | 9,351 | 32.21 | +1.98 | 9,290 | 31.82 | +1.85 | ||
| NZ First | Dave Mackie | 1,059 | 3.65 | -0.06 | 1,977 | 6.77 | +3.37 | ||
| United Future | Joy Lietze | 742 | 2.56 | 1,928 | 6.60 | ||||
| Green | Dayle Belcher | 605 | 2.08 | 1,006 | 3.45 | +0.40 | |||
| ACT | Roly Henderson | 396 | 1.36 | 1,491 | 5.11 | -2.27 | |||
| Christian Heritage | Grant Bradfield | 365 | 1.26 | -2.37 | 335 | 1.15 | -2.53 | ||
| Progressive | Roger White* | 168 | 0.58 | -2.86 | 299 | 1.02 | |||
| Alliance | James R Flynn | 117 | 0.40 | 224 | 0.77 | -5.38 | |||
| Independent | David Webber | 73 | 0.25 | -0.08 | |||||
| ORNZ | 602 | 2.06 | |||||||
| Legalise Cannabis | 147 | 0.50 | -0.46 | ||||||
| One NZ | 13 | 0.04 | -0.01 | ||||||
| Mana Māori | 2 | 0.01 | -0.01 | ||||||
| NMP | 1 | 0.00 | 0.00 | ||||||
| Informal votes | 185 | 166 | |||||||
| Total Valid votes | 29,035 | 29,196 | |||||||
| National hold | Majority | 6,808 | 23.44 | +2.45 | |||||
*Percentage change calculation based on percent as Alliance candidate in 1999 election.
1999 election
| General election, 1999: Clutha-Southland[13][14] | |||||||||
|---|---|---|---|---|---|---|---|---|---|
| Notes: |
Blue background denotes the winner of the electorate vote.
| ||||||||
| Party | Candidate | Votes | % | ±% | Party votes | % | ±% | ||
| National | 15,619 | 51.22 | +4.13 | 12,882 | 42.05 | -0.69 | |||
| Labour | Lesley Soper | 9,218 | 30.23 | +11.98 | 9,182 | 29.97 | +10.72 | ||
| NZ First | Dave Mackie | 1,131 | 3.71 | 1,043 | 3.40 | -11.57 | |||
| Christian Heritage | Grant Bradfield | 1,108 | 3.63 | 1,128 | 3.68 | ||||
| Alliance | Roger White | 1049 | 3.44 | 1883 | 6.15 | -1.30 | |||
| ACT | John Morrison | 945 | 3.10 | 2,260 | 7.38 | +1.34 | |||
| Green | Tim Gow | 854 | 2.80 | 935 | 3.05 | ||||
| South Island | Pat McCarrigan | 469 | 1.54 | 421 | 1.37 | ||||
| Independent | David Webber | 102 | 0.33 | ||||||
| Legalise Cannabis | 293 | 0.96 | -0.28 | ||||||
| Future NZ | 243 | 0.79 | |||||||
| United NZ | 112 | 0.37 | -0.21 | ||||||
| Libertarianz | 87 | 0.28 | +0.25 | ||||||
| McGillicuddy Serious | 65 | 0.21 | -0.21 | ||||||
| Animals First | 57 | 0.19 | +0.07 | ||||||
| One NZ | 15 | 0.05 | |||||||
| Natural Law | 8 | 0.03 | -0.05 | ||||||
| Mauri Pacific | 6 | 0.02 | |||||||
| Mana Māori | 5 | 0.02 | +0.01 | ||||||
| People's Choice | 5 | 0.02 | |||||||
| Freedom Movement | 4 | 0.01 | |||||||
| Republican | 3 | 0.01 | |||||||
| NMP | 0 | 0.00 | |||||||
| Informal votes | 481 | 339 | |||||||
| Total Valid votes | 30,495 | 30,637 | |||||||
| National hold | Majority | 6,401 | 20.99 | -7.85 | |||||
1996 election
| General election, 1996: Clutha-Southland[15][16][17] | |||||||||
|---|---|---|---|---|---|---|---|---|---|
| Notes: |
Blue background denotes the winner of the electorate vote.
| ||||||||
| Party | Candidate | Votes | % | ±% | Party votes | % | ±% | ||
| National | Bill English | 14,764 | 47.09 | 13,449 | 42.74 | ||||
| Labour | Lesley Soper | 5,721 | 18.25 | 6,058 | 19.25 | ||||
| NZ First | Alan Wise | 5,075 | 16.19 | 4,709 | 14.97 | ||||
| Alliance | Tracey Hicks | 2,326 | 7.42 | 2,345 | 7.45 | ||||
| ACT | Peter Snow | 2,049 | 6.54 | 1,901 | 6.04 | ||||
| Christian Coalition | Russell Zwies | 1,060 | 3.38 | 2,147 | 6.82 | ||||
| McGillicuddy Serious | Robyn West | 306 | 0.98 | 133 | 0.42 | ||||
| Natural Law | Gilbert Urquhart | 50 | 0.16 | 24 | 0.08 | ||||
| Legalise Cannabis | 390 | 1.24 | |||||||
| United NZ | 181 | 0.58 | |||||||
| Animals First | 37 | 0.12 | |||||||
| Progressive Green | 33 | 0.10 | |||||||
| Green Society | 15 | 0.05 | |||||||
| Conservatives | 14 | 0.04 | |||||||
| Superannuitants & Youth | 11 | 0.03 | |||||||
| Libertarianz | 10 | 0.03 | |||||||
| Advance New Zealand | 2 | 0.01 | |||||||
| Asia Pacific United | 2 | 0.01 | |||||||
| Ethnic Minority Party | 2 | 0.01 | |||||||
| Mana Māori | 2 | 0.01 | |||||||
| Te Tawharau | 0 | 0.00 | |||||||
| Informal votes | 202 | 88 | |||||||
| Total Valid votes | 31,351 | 31,465 | |||||||
| National win new seat | Majority | 9,043 | 28.84 | ||||||
Table footnotes
- ↑ 2017 Internet Party swing is relative to the votes for Internet-Mana in 2014; it shared a party list with Mana Party in the 2014 election
- ↑ 2017 Mana Party swing is relative to the votes for Internet-Mana in 2014; it shared a party list with the Internet Party in the 2014 election
- ↑ 2014 Internet Mana swing is relative to the votes for Mana in 2011; it shared a party list with Internet in the 2014 election.
References
- ↑ Report of the Representation Commission 2014 (PDF). Representation Commission. 4 April 2014. p. 10. ISBN 978-0-477-10414-2. Retrieved 26 September 2014.
- ↑ Bennett, Adam (1 November 2013). "English to give up Clutha-Southland seat". Otago Daily Times. Retrieved 3 November 2013.
- ↑ "Life after Bill". The Southland Times. 10 January 2014. Retrieved 23 February 2014.
- ↑ "Election 2014: Southland decides". The Southland Times. 20 September 2014. Retrieved 26 September 2014.
- ↑ Hayes, Lauren; Railton, Bridget; Jamieson, Debbie (20 September 2014). "Landslide win for Barclay". The Southland Times. Retrieved 26 September 2014.
- ↑ Rutherford, Hamish (29 April 2014). "Who is National's Todd Barclay?". Stuff.co.nz. Retrieved 21 September 2014.
- ↑ "Todd Barclay tapes contained 'sex and drugs' matters – report". Newshub – newshub.co.nz. 27 June 2017. Retrieved 27 September 2017.
- ↑ New Zealand Electoral Commission. "Clutha-Southland – Official Result (2017)". Electionresults.govt.nz. Retrieved 7 October 2017.
- ↑ New Zealand Electoral Commission (10 October 2014). "Clutha-Southland – Official Result (2014)". Electionresults.govt.nz. Retrieved 31 October 2017.
- ↑ New Zealand Electoral Commission (10 December 2011). "Clutha-Southland – Official Result (2011)". Electionresults.govt.nz. Retrieved 31 October 2017.
- ↑ "Enrolment statistics". Electoral Commission. 26 November 2011. Retrieved 28 November 2011.
- ↑ Official Count Results – Clutha-Southland, 2008 General Election. Chief Electoral Office, Wellington. Retrieved 23 September 2010.
- ↑ "Official Count Results (1999) – Electoral Votes for registered parties by electorate". NZ Electoral Commission. Retrieved 31 October 2017.
- ↑ "Official Count Results (1999) – Candidate Vote Details". NZ Electoral Commission. Retrieved 31 October 2017.
- ↑ "Electorate Candidate and Party Votes Recorded at Each Polling Place – Clutha-Southland, 1996" (PDF). Retrieved 11 July 2013.
- ↑ "Part III – Party Lists of Successful Registered Parties" (PDF). Electoral Commission. Archived from the original (PDF) on 8 February 2013. Retrieved 22 June 2013.
- ↑ "Part III – Party Lists of unsuccessful Registered Parties" (PDF). Electoral Commission. Archived from the original (PDF) on 8 February 2013. Retrieved 22 June 2013.
Coordinates: 45°38′00″S 167°55′00″E / 45.6333°S 167.9167°E