Population centres
The 1941 New Zealand census had been postponed due to World War II, so the 1946 electoral redistribution had to take ten years of population growth and movements into account. The North Island gained a further two electorates from the South Island due to faster population growth. The abolition of the country quota through the Electoral Amendment Act, 1945 reduced the number and increased the size of rural electorates. None of the existing electorates remained unchanged, 27 electorates were abolished, eight former electorates were re-established, and 19 electorates were created for the first time, including North Shore.
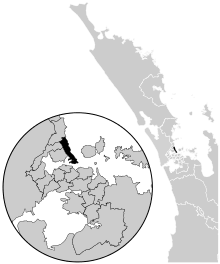
The boundaries of the North Shore electorate were last adjusted for the first election held using the mixed-member proportional (MMP) voting system in 1996, when the number of general electorates decreased from 95 (1993) to 60 (1996), and the electorate expanded to the north into an area previously belonging to East Coast Bays. No boundary adjustments were undertaken in the subsequent redistributions in 2002,[2] 2007,[3] and 2013/14.[4]
North Shore stretches up the eastern coast of North Shore City in Auckland, starting in the south at Devonport and moving northwards to take in Lake Pupuke and the suburbs of Takapuna, Westlake and Campbells Bay. North Shore is predominately New Zealand European, and has an average income high above the national average, boasting some of the most expensive real estate in the country.
History
The seat has been contested at every election in New Zealand since 1946, and except for a single victory by future Labour Attorney-General Martyn Finlay in its first contest, has been safely held by the National Party ever since.
Wayne Mapp held the electorate from 1996 until his retirement in 2011.[5] He was succeeded by Maggie Barry, who won the 2011 and 2014 elections.[6][7]
List MPs
Members of Parliament elected from party lists in elections where that person also unsuccessfully contested the North Shore electorate. Unless otherwise stated, all MPs terms began and ended at general elections.
Election results
2017 election
| General election, 2017: North Shore[8] |
| Notes: |
Blue background denotes the winner of the electorate vote.
Pink background denotes a candidate elected from their party list.
Yellow background denotes an electorate win by a list member, or other incumbent.
A  Y or Y or  N denotes status of any incumbent, win or lose respectively. N denotes status of any incumbent, win or lose respectively. |
| Party |
Candidate |
Votes |
% |
±% |
Party votes |
% |
±% |
|
National |
Y Maggie Barry |
23,564 |
59.74 |
-2.73 |
23,009 |
57.70 |
-3.88 |
|
Labour |
Romy Udanga |
10,848 |
27.50 |
+8.38 |
10,375 |
26.02 |
+11.84 |
|
NZ First |
Josh Hubbard |
2,108 |
5.34 |
— |
2,097 |
5.25 |
−0.57 |
|
Opportunities |
Matt Isbister |
1,639 |
4.15 |
— |
953 |
2.39 |
— |
|
ACT |
Nick Kearney |
621 |
1.57 |
+0.06 |
372 |
0.94 |
−0.47 |
|
Independent |
Miriam Clements |
166 |
0.43 |
— |
|
|
Green |
|
2,638 |
6.61 |
−4.06 |
|
Māori |
|
103 |
0.26 |
−0.19 |
|
Conservative |
|
86 |
0.22 |
−4.12 |
|
Legalise Cannabis |
|
69 |
0.18 |
−0.09 |
|
United Future |
|
22 |
0.06 |
−0.19 |
|
Outdoors |
|
14 |
0.04 |
— |
|
People's Party |
|
13 |
0.04 |
— |
|
Ban 1080 |
|
11 |
0.03 |
±0.00 |
|
Democrats |
|
10 |
0.03 |
−0.06 |
|
Internet |
|
9 |
0.03 |
−0.62 |
|
Mana |
|
7 |
0.02 |
−0.63 |
| Informal votes |
493 |
|
|
83 |
|
|
| Total Valid votes |
39,439 |
|
|
39,871 |
|
|
| Turnout |
40,136 |
80.51[9] |
+1.46 |
|
|
National hold |
Majority |
12,716 |
32.24 |
−11.10 |
|
2014 election
| General election, 2014: North Shore[7] |
| Notes: |
Blue background denotes the winner of the electorate vote.
Pink background denotes a candidate elected from their party list.
Yellow background denotes an electorate win by a list member, or other incumbent.
A Y or N denotes status of any incumbent, win or lose respectively. |
| Party |
Candidate |
Votes |
% |
±% |
Party votes |
% |
±% |
|
National |
Y Maggie Barry |
23,783 |
62.47 |
+0.03 |
23,762 |
61.58 |
-0.58 |
|
Labour |
Claire Szabó |
7,280 |
19.12 |
-1.45 |
5,473 |
14.18 |
-2.05 |
|
Green |
Brett Stansfield |
3,728 |
9.79 |
+2.09 |
4,118 |
10.67 |
-0.18 |
|
Conservative |
Melissa Perkin |
2,199 |
5.78 |
+3.29 |
1,673 |
4.34 |
+2.11 |
|
ACT |
Nick Kearney |
575 |
1.51 |
-2.05 |
545 |
1.41 |
-0.51 |
|
Democrats |
Tim Leitch |
97 |
0.25 |
+0.25 |
34 |
0.09 |
+0.06 |
|
NZ First |
|
2,246 |
5.82 |
+0.96 |
|
Internet Mana |
|
250 |
0.65 |
+0.48[lower-alpha 1] |
|
Māori |
|
174 |
0.45 |
-0.15 |
|
Legalise Cannabis |
|
103 |
0.27 |
-0.06 |
|
United Future |
|
98 |
0.25 |
-0.23 |
|
Ban 1080 |
|
13 |
0.03 |
+0.03 |
|
Civilian |
|
12 |
0.03 |
+0.03 |
|
Independent Coalition |
|
4 |
0.01 |
+0.01 |
|
Focus |
|
2 |
0.01 |
+0.01 |
| Informal votes |
412 |
|
|
78 |
|
|
| Total Valid votes |
38,074 |
|
|
38,585 |
|
|
| Turnout |
38,585 |
78.49 |
+3.00 |
|
|
National hold |
Majority |
16,503 |
43.34 |
+1.47 |
|
2011 election
| General election, 2011: North Shore[6] |
| Notes: |
Blue background denotes the winner of the electorate vote.
Pink background denotes a candidate elected from their party list.
Yellow background denotes an electorate win by a list member, or other incumbent.
A Y or N denotes status of any incumbent, win or lose respectively. |
| Party |
Candidate |
Votes |
% |
±% |
Party votes |
% |
±% |
|
National |
Maggie Barry |
22,709 |
62.44 |
+0.59 |
23,113 |
62.16 |
+4.10 |
|
Labour |
Ben Clark |
7,481 |
20.57 |
-3.44 |
6,036 |
16.23 |
-5.17 |
|
Green |
Pieter Watson |
2,802 |
7.70 |
+1.50 |
4,035 |
10.85 |
+4.24 |
|
ACT |
Don Brash |
1,293 |
3.56 |
-0.41 |
714 |
1.92 |
-5.55 |
|
Conservative |
Craig Jensen |
904 |
2.49 |
+2.49 |
829 |
2.23 |
+2.23 |
|
NZ First |
Andrew Williams |
900 |
2.47 |
+0.89 |
1,806 |
4.86 |
+1.92 |
|
United Future |
Damian Light |
173 |
0.48 |
-0.20 |
179 |
0.48 |
-0.46 |
|
Libertarianz |
Michael Murphy |
108 |
0.30 |
+0.05 |
41 |
0.11 |
+0.03 |
|
Māori |
|
223 |
0.60 |
+0.002 |
|
Legalise Cannabis |
|
123 |
0.33 |
+0.07 |
|
Mana |
|
62 |
0.17 |
+0.17 |
|
Democrats |
|
12 |
0.03 |
+0.01 |
|
Alliance |
|
8 |
0.02 |
-0.04 |
| Informal votes |
592 |
|
|
174 |
|
|
| Total Valid votes |
36,370 |
|
|
36,962 |
|
|
|
National hold |
Majority |
15,228 |
41.87 |
+4.03 |
|
Electorate (as at 26 November 2011): 48,963[10]
2008 election
| General election, 2008: North Shore[11] |
| Notes: |
Blue background denotes the winner of the electorate vote.
Pink background denotes a candidate elected from their party list.
Yellow background denotes an electorate win by a list member, or other incumbent.
A Y or N denotes status of any incumbent, win or lose respectively. |
| Party |
Candidate |
Votes |
% |
±% |
Party votes |
% |
±% |
|
National |
Y Wayne Mapp |
23,824 |
61.85 |
|
22,738 |
58.06 |
|
|
Labour |
Phil Twyford |
9,250 |
24.01 |
|
8,381 |
21.40 |
|
|
Green |
Pieter Watson |
2,389 |
6.20 |
|
2,590 |
6.61 |
|
|
ACT |
John Boscawen |
1,528 |
3.97 |
|
2,927 |
7.47 |
|
|
NZ First |
Joe Gregory |
612 |
1.59 |
|
1,149 |
2.93 |
|
|
Family Party |
Louise Cleary |
514 |
1.33 |
|
176 |
0.45 |
|
|
United Future |
Damian Light |
261 |
0.68 |
|
370 |
0.94 |
|
|
Libertarianz |
Michael Murphy |
94 |
0.24 |
|
33 |
0.08 |
|
|
RAM |
Stephen Cooper |
47 |
0.12 |
|
13 |
0.03 |
|
|
Māori |
|
234 |
0.60 |
|
|
Progressive |
|
165 |
0.42 |
|
|
Bill and Ben |
|
139 |
0.35 |
|
|
Legalise Cannabis |
|
104 |
0.27 |
|
|
Kiwi |
|
83 |
0.21 |
|
|
Alliance |
|
24 |
0.06 |
|
|
Pacific |
|
13 |
0.03 |
|
|
Workers Party |
|
10 |
0.03 |
|
|
Democrats |
|
9 |
0.02 |
|
|
RONZ |
|
4 |
0.01 |
|
| Informal votes |
268 |
|
|
102 |
|
|
| Total Valid votes |
38,519 |
|
|
39,162 |
|
|
|
National hold |
Majority |
14,574 |
37.84 |
|
|
2005 election
| General election, 2005: North Shore[12] |
| Notes: |
Blue background denotes the winner of the electorate vote.
Pink background denotes a candidate elected from their party list.
Yellow background denotes an electorate win by a list member, or other incumbent.
A Y or N denotes status of any incumbent, win or lose respectively. |
| Party |
Candidate |
Votes |
% |
±% |
Party votes |
% |
±% |
|
National |
Y Wayne Mapp |
21,975 |
59.56 |
+15.58 |
20,125 |
53.49 |
+26.06 |
|
Labour |
Phil Twyford |
12,274 |
33.26 |
+4.16 |
11,252 |
29.91 |
-1.36 |
|
United Future |
Ross Tizard |
865 |
2.34 |
-1.54 |
807 |
2.14 |
-4.81 |
|
ACT |
Nick Kearney |
835 |
2.26 |
-6.55 |
1,144 |
3.04 |
-11.09 |
|
Progressive |
Paula Gillon |
544 |
1.47 |
+0.61 |
261 |
0.69 |
-0.36 |
|
Māori |
Raewyn Harrison |
265 |
0.72 |
|
106 |
0.28 |
|
|
Libertarianz |
Michael Murphy |
140 |
0.38 |
|
21 |
0.06 |
|
|
Green |
|
1,940 |
5.16 |
-1.28 |
|
NZ First |
|
1,683 |
4.47 |
-5.70 |
|
Destiny |
|
120 |
0.32 |
|
|
Legalise Cannabis |
|
55 |
0.15 |
-0.17 |
|
Christian Heritage |
|
53 |
0.14 |
-0.70 |
|
One NZ |
|
13 |
0.03 |
-0.02 |
|
99 MP |
|
11 |
0.03 |
|
|
Alliance |
|
10 |
0.03 |
-0.78 |
|
Direct Democracy |
|
10 |
0.03 |
|
|
Family Rights |
|
6 |
0.02 |
|
|
Democrats |
|
5 |
0.01 |
|
|
RONZ |
|
1 |
0.003 |
|
| Informal votes |
430 |
|
|
90 |
|
|
| Total Valid votes |
36,898 |
|
|
37,623 |
|
|
|
National hold |
Majority |
9,701 |
26.30 |
+11.42 |
|
1996 election
| General election, 1996: North Shore[13][14][15] |
| Notes: |
Blue background denotes the winner of the electorate vote.
Pink background denotes a candidate elected from their party list.
Yellow background denotes an electorate win by a list member, or other incumbent.
A Y or N denotes status of any incumbent, win or lose respectively. |
| Party |
Candidate |
Votes |
% |
±% |
Party votes |
% |
±% |
|
National |
Wayne Mapp |
15,763 |
43.48 |
|
15,612 |
42.89 |
|
|
ACT |
Derek Quigley |
5,415 |
14.94 |
|
5,015 |
13.78 |
|
|
Alliance |
Joel Cayford |
4,897 |
13.51 |
-10.86 |
2,125 |
5.84 |
|
|
Labour |
Perry Cameron |
4,375 |
12.07 |
|
7,518 |
20.65 |
|
|
NZ First |
Ann Batten |
4,165 |
11.49 |
|
3,547 |
9.74 |
|
|
Christian Coalition |
Julie Belding |
780 |
2.15 |
|
1,181 |
3.24 |
|
|
Progressive Green |
Cassandra Doherty |
313 |
0.86 |
|
103 |
0.28 |
|
|
McGillicuddy Serious |
Felix Clark |
263 |
0.73 |
|
87 |
0.24 |
|
|
Green Society |
Bradley Heising |
109 |
0.30 |
|
50 |
0.14 |
|
|
Superannuitants & Youth |
Trevor Gilligan |
88 |
0.24 |
|
41 |
0.11 |
|
|
Natural Law |
Gail Pianta |
84 |
0.23 |
|
43 |
0.12 |
|
|
United NZ |
|
476 |
1.31 |
|
|
Legalise Cannabis |
|
456 |
1.25 |
|
|
Ethnic Minority Party |
|
71 |
0.20 |
|
|
Animals First |
|
50 |
0.14 |
|
|
Conservatives |
|
11 |
0.03 |
|
|
Libertarianz |
|
11 |
0.03 |
|
|
Asia Pacific United |
|
4 |
0.01 |
|
|
Mana Māori |
|
3 |
0.01 |
|
|
Advance New Zealand |
|
0 |
0.00 |
|
|
Te Tawharau |
|
0 |
0.00 |
|
| Informal votes |
225 |
|
|
73 |
|
|
| Total Valid votes |
36,252 |
|
|
36,404 |
|
|
|
National gain from United NZ |
Majority |
10,348 |
28.54 |
|
|
- ↑ 2014 Internet Mana swing is relative to the votes for Mana in 2011; it shared a party list with Internet in the 2014 election.
References
- McRobie, Alan (1989). Electoral Atlas of New Zealand. Wellington: GP Books. ISBN 0-477-01384-8.
- Wilson, James Oakley (1985) [First published in 1913]. New Zealand Parliamentary Record, 1840–1984 (4th ed.). Wellington: V.R. Ward, Govt. Printer. OCLC 154283103.
- Norton, Clifford (1988). New Zealand Parliamentary Election Results 1946–1987: Occasional Publications No 1, Department of Political Science. Wellington: Victoria University of Wellington. ISBN 0-475-11200-8.
External links
« historical electorates « Current electorates of New Zealand |
|---|
| North Island | |
|---|
| South Island | |
|---|
| Māori | |
|---|