Geography of Toronto
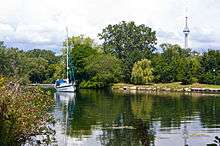
The geography of Toronto, Ontario, covers an area of 630 km2 (243 sq mi) and is bounded by Lake Ontario to the south; Etobicoke Creek, Eglinton Avenue, and Highway 427 to the west; Steeles Avenue to the north; and the Rouge River and the Scarborough–Pickering Townline to the east. In addition to Etobicoke Creek and the Rouge River, the city is trisected by two minor rivers and their tributaries, the Humber River in the west end and the Don River east of downtown. Both flow southward to Lake Ontario at Humber Bay and Toronto Harbour respectively, which are part of the longer Waterfront, as well as Etobicoke Creek and the Rouge River.
The concentration and protection of Toronto's ravines allows for large tracts of densely forested valleys with recreational trails within the city. Approximately 26–28% of Toronto is covered with over 10 million trees,[1] a fairly high percentage within a large city in North America and there are ambitious proposals to double the coverage.
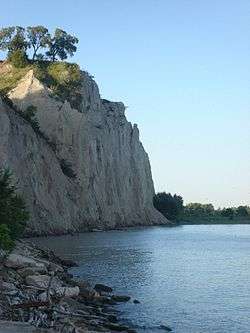
The shoreline of the former Lake Iroquois is a major west−east geological feature, which was formed at the end of the last glacial period. In the west end, Davenport Road follows the ancient shoreline with the steps to Casa Loma rising above and downtown skyscrapers clearly visible to the southeast. It merges with the current Lake Ontario shoreline at the Scarborough Bluffs promontory.
The Toronto Islands are the only group of islands located on the western shores of Lake Ontario and were formed from the erosion of the Scarborough Bluffs. The Toronto Islands were originally a sand spit until a major storm separated them from the mainland during the 19th century.
Toronto's immediate neighbours are Mississauga and Brampton within the Regional Municipality of Peel, Vaughan and Markham within the Regional Municipality of York, and Pickering within the Regional Municipality of Durham. The Greater Toronto Area (GTA) includes the regional municipalities of Halton, Peel, York and Durham.
The GTA is part of a larger, natural ecosystem known as the Greater Toronto Bioregion. This ecosystem is bounded by Lake Ontario, the Niagara Escarpment, and the Oak Ridges Moraine, and includes many watersheds that drain into Lake Ontario. Some parts of Toronto, such as High Park and the lower Humber River, are located in the northernmost parts of the Carolinian forest zone found in North America.
In March 2005, the Government of Ontario unveiled the boundaries of a greenbelt around the Greater Toronto Area, a 7,200 km2 (2,800 sq mi) area stretching from Niagara Falls to Peterborough. The green belt is designed to curb urban sprawl and to preserve valuable natural areas and farmland surrounding the city. However, some types of development including detached single residential, quarries and commercial facilities continue to get approved, exerting pressure and population growth on the Greenbelt. Toronto is among the latest in a line of cities that have implemented growth boundaries of some kind as a method of restricting urban growth, including Ottawa; Portland, Oregon; Frankfurt; Melbourne; Seoul and London.
Climate
| Toronto | ||||||||||||||||||||||||||||||||||||||||||||||||||||||||||||
|---|---|---|---|---|---|---|---|---|---|---|---|---|---|---|---|---|---|---|---|---|---|---|---|---|---|---|---|---|---|---|---|---|---|---|---|---|---|---|---|---|---|---|---|---|---|---|---|---|---|---|---|---|---|---|---|---|---|---|---|---|
| Climate chart (explanation) | ||||||||||||||||||||||||||||||||||||||||||||||||||||||||||||
| ||||||||||||||||||||||||||||||||||||||||||||||||||||||||||||
| ||||||||||||||||||||||||||||||||||||||||||||||||||||||||||||
Toronto's continental climate is moderated by Lake Ontario; its climate is among the mildest in Canada east of the Rocky Mountains, given Toronto's southerly latitude within the country. Downtown Toronto sits in a pocket of the humid continental climate (Köppen climate classification Dfa) zone found at the southwestern end of Lake Ontario covering the southern part of the city — including downtown (but excluding the Toronto Islands), where the annual average temperature exceeds 9 °C (48 °F). Some of Toronto, outside of the former city limits and some suburban areas, fall within the Dfb climate regimen. This difference partly results from the urban heat island effect. Toronto is located in hardiness zone 7a.[2] There is a high degree of variability from year to year and sometimes over a period of days, particularly during the winter months.
Lake Ontario's water temperature varies due to upwelling of colder water or warmer pools of surface water creating very localized thermal contrast; the deeper waters of the lake, far from the shore, remain at a near constant water temperature of 4 °C (39 °F), the effect of which is either cooling or warming (in winter). This creates generally warmer nights through the colder season than would otherwise occur. When offshore winds blow in summer, they warm as they near the lakeshore in the evening; conversely, the cooling effect by the lake is most pronounced on spring afternoons, which can affect Toronto even more than other cities on the Great Lakes due its exposure to onshore winds from the east to south-east, on some days, the temperatures can be as much as 10 °C (18 °F) cooler than areas located far enough away from the Lake Ontario, an effect that wanes by summer when the dominant windflow becomes more southwesterly and the lake surface temperature warms.
Springs and autumns are shorter seasons than summers and winters, and feature varied weather with alternating periods of dry, sunny weather and rain. Many days in these seasons are sunny with pleasant rather than warm or cold temperatures. Nights are generally cool, but frosts are rare. Snow can fall in early spring or late fall but usually melt quickly after contact with the ground. At these changeable times of the year, temperature contrasts (up to 30 °C (54 °F) in extreme cases) can occur within a short time frames due to rapidly changing air masses that sweep across the continent, often accompanied by high winds. Due to these airmass changes, temperatures of 30 °C (86 °F) or above have been recorded as early as April 16 and as late as October 8. Conversely, temperatures of −10 °C (14 °F) or below at night have been recorded as early as November 6 and as late as April 18. Accumulating snowfall has been reported as early as October 1 and as late as May 16. Toronto's weather is affected by the relative position of the polar jet stream and continental storm track, both of which pass over the area with some frequency. The subtropical jet can move well north of the area in the midsummer. There is no "dry season" precipitation falls in all months with regularity (a good part as snow during the winter), but heavier summer rains make higher average amounts as a general rule with occasional dry periods. February and March rank as the driest months on average. Annual average precipitation is 831 mm (32.72 in).
Winter and snowfall
Despite being cold, extended snow free periods occur in most winter seasons and precipitation can fall as rain with temperatures sometimes climbing above 10 °C (50 °F). Average winter snowfall is 121.5 cm (47.8 in) at the weather station in Downtown Toronto[3] and 108.5 cm (42.72 in) at Toronto Pearson International Airport.[4]
The average January maximum/minimum is −1 °C (30 °F)/−7 °C (19 °F) in the city.[3] There are usually a few colder periods where temperatures remain below −10 °C (14 °F) and less frequently below −20 °C (−4 °F) at night (especially in the northern suburbs), with wind chills making it feel like −30 °C (−22 °F).[5]
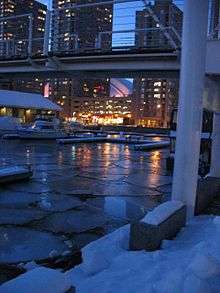
Due to its position on the northwest shore of Lake Ontario, Toronto is not a direct target of heavy, wind−whipped lake-effect snow squalls that hit other Great Lake cities on the south/east shorelines of the lakes, in areas where prevailing winds amplify lake effect. Despite this, there are usually two or more heavy snowfalls each winter which deposit at least 15 cm (5.91 in) accumulation, usually from powerful winter storms known as "Colorado Lows" or other panhandle hooks that pick up moisture en route to the Great Lakes. These storms can produce strong easterly driven winds that fetch additional moisture from Lake Ontario. They frequently come with a volatile mix of snow, ice pellets, freezing rain and sometimes just ordinary rain, all of which can disrupt transportation, and in severe cases, interrupt power supply. A sustained freezing rain event occurred on December 22, 2013 plunging 30% of the city into darkness, some until after Christmas Day.[6]
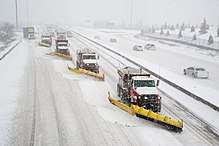
Such storms can also produce large snowfall amounts, higher totals found in areas closer to Lake Ontario, sometimes falling over a series of days or weeks creating havoc. On January 13, 1999, then-Toronto mayor Mel Lastman called in the Canadian Armed Forces to assist with snow removal and clearing streets. Within twelve days, the downtown Toronto weather station at the University of Toronto (Trinity College near Queens Park) recorded an average season's worth of 118.4 cm (46.6 in) of snow, much of it lake effect from Lake Ontario and a monthly record for January, but fell short of the snowiest month overall March 1870, with 158.5 cm (62.4 in), of which 89 cm (35.0 in) fell over a 5-day span. February 2008 set a record a snowfall record for the month with 76.8 cm (30.2 in) falling at the airport. The winter of 2007–08 brought accumulated seasonal snowfall totals of 209.7 cm (82.6 in) downtown and 194.0 cm (76.4 in) at the airport. The heavy winter snows, in combination with record rains during June–July of that year made 2008 the wettest year on the climate record with over 1,070 mm (42.1 in) of total precipitation. The largest single snowstorm on record took place on December 11-12, 1944, when 57.2 cm (22.5 in) accumulated, with 48.3 cm (19.0 in) on December 11 alone.
On the opposite extreme, the winter of 2011–12 had the lowest seasonal snowfall total withonly 41.8 cm (16.5 in).[7] March 2012 was the warmest March on record.[8] The least snowfall in a calendar year was 2006, with only 32.4 cm (12.8 in). The El Niño influenced winter of 2009–10 had 52.4 cm (20.6 in), March 2010 recorded no measurable snow, the first such occurrence in any March since 1946, and was followed by the warmest April ever on record.[9]
Summer
Maximum temperatures typically range from 23 to 31 °C (73 to 88 °F) with moderate to high humidity, proximity to Lake Ontario and the other lakes contribute to summer moisture content but far away sources like the Gulf of Mexico also factor in. The cooling influence of the lake exists but can be very localized to the immediate shoreline or move further inland, but this depends on windspeed and airmass. The influence of the lake also increases humidity & night time minimums in built-up areas. Temperatures over 32 °C (90 °F) occur but usually no longer than over a period of a few days (defined as a heat wave, which occur in most summers but maximums rarely exceed 38 °C (100 °F)). Night temperatures generally hover close to 20 °C (68 °F) in the city but during hotter spells can remain closer to 25 °C (77 °F). Summer heat episodes are usually broken by cooler, drier periods not experienced further south on the continent. But intense heat episodes pose a health risk to some as they often arrive with high humidity and dangerous levels of airborne smog, as a result Environment Canada has begun posting heat warnings in recent years to bring awareness. Thunderstorms are also a regular occurrence and can pop up quickly, especially west and north of the city in areas more prone to the "lake breeze front" or "lake breeze thunderstorms" phenomenon, in which intense, sharply defined squall lines develop quickly on summer afternoons amplified by localized wind patterns between the Great Lakes.[10] These storms sometimes move into the city causing localized flooding resulting from downpours, intense lightning but less often severe winds knocking down trees and powerlines.
Severe weather and records
In addition to snowstorms, ice storms, windstorms, heavy rainfall events associated with tropical storms or very severe thunderstorms, Tornadoes are rare, but do occur. Tornado warnings have been posted for the city on a few occasions in the past few years, however no touchdowns have been confirmed in the city since a weak tornado hit Scarborough in the mid-1990s. A pair of dangerous F2 tornados did touchdown in neighbouring Vaughan on August 20 during the 2009 tornado season.
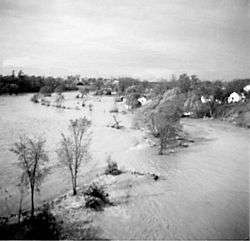
The tropical storm remnant of Hurricane Hazel caused 81 deaths in October 1954 due to flooding that swept homes along river banks into Lake Ontario. A sudden downburst during a strong thunderstorm was believed to have played a contributing factor in the Air France Flight 358 crash in August 2005 and just a few weeks later, record-breaking intense rainfall, the worst since Hazel, deluged north-central sections of the city within a couple of hours resulting in record insurance claims. Some rain gauges recorded 175 mm (7") of rain, over 100 mm (4") in just one hour. Another large rainstorm with intense, record rainfall amounts struck a wide swath of the city during the afternoon rush hour on July 8, 2013 flooding city streets, subway tunnels, basements and knocking out power for over 2 million residents, stranding commuters, some having to be rescued from a submerged train. A daily rainfall record of 126.4 mm (5") was set at Pearson Airport, most falling in an hour and a half. Flood insurance claims are likely to exceed the 2005 storm due to a wider area affected.[11]
During the 1936 North American heat wave, downtown temperatures in Toronto exceeded 40 °C (104 °F) on three consecutive days (July 8 – 10), with nighttime temperatures not falling below 25 °C (77 °F) [12][13]. The city was ill-equipped at that time to handle such a prolonged extreme heat wave, and heat stroke claimed 225 lives in the city,[14] not counting indirect deaths from causes such as drowning.[15] The hottest month recorded, however, was July 1921, when the average maximum temperature downtown was 31.7 °C (89 °F), and a mean temperature of 26 °C (79 °F) still holds as the warmest month. At the airport, the highest monthly maximum average was 31.2 °C (88 °F) in July 1955.
The coldest minimum temperature of −33 °C (−27 °F) was recorded on January 10, 1859. The coldest temperature recorded at Toronto Pearson International Airport was −31.3 °C (−24.3 °F) on January 4, 1981, and the coldest windchill recorded was −44.7 °C (−48 °F) on the same day.[4][5] The coldest month overall was −12.6 °C (9 °F) at the airport in February 2015 and at downtown in February 1875.[16] Winter cold snaps pose a danger as they often come with high winds, leaving the city's homeless population very prone to frostbite and hypothermia.
Upward temperature trend
Based on public records provided by Environment Canada, the average annual temperature has increased 1.4 °C (2.5 °F) at Pearson Airport since the new Millennium if compared to the thirty-year normals from 1971–2000, more of this increase occurred at night: the average minimum temperature has been 1.8 °C (3.2 °F) higher. Average precipitation during the same period was close to the average of the previous period, snowfall totals down only marginally with slightly higher rainfall. September and January have seen the highest average temperature increases. Part of this warming is likely attributed to increased urban growth surrounding the airport.
An older study conducted in the 1990s analysed the heat island effect comparing data from selected regional stations, including both Downtown Toronto and Pearson Airport.[17]
Statistics
| Climate data for Toronto (The Annex), 1981–2010 normals, extremes 1840–present[lower-alpha 1] | |||||||||||||
|---|---|---|---|---|---|---|---|---|---|---|---|---|---|
| Month | Jan | Feb | Mar | Apr | May | Jun | Jul | Aug | Sep | Oct | Nov | Dec | Year |
| Record high °C (°F) | 16.1 (61) |
19.1 (66.4) |
26.7 (80.1) |
32.2 (90) |
34.4 (93.9) |
36.7 (98.1) |
40.6 (105.1) |
38.9 (102) |
37.8 (100) |
30.8 (87.4) |
23.9 (75) |
19.9 (67.8) |
40.6 (105.1) |
| Average high °C (°F) | −0.7 (30.7) |
0.4 (32.7) |
4.7 (40.5) |
11.5 (52.7) |
18.4 (65.1) |
23.8 (74.8) |
26.6 (79.9) |
25.5 (77.9) |
21.0 (69.8) |
14.0 (57.2) |
7.5 (45.5) |
2.1 (35.8) |
12.9 (55.2) |
| Daily mean °C (°F) | −3.7 (25.3) |
−2.6 (27.3) |
1.4 (34.5) |
7.9 (46.2) |
14.1 (57.4) |
19.4 (66.9) |
22.3 (72.1) |
21.5 (70.7) |
17.2 (63) |
10.7 (51.3) |
4.9 (40.8) |
−0.5 (31.1) |
9.4 (48.9) |
| Average low °C (°F) | −6.7 (19.9) |
−5.6 (21.9) |
−1.9 (28.6) |
4.1 (39.4) |
9.9 (49.8) |
14.9 (58.8) |
18.0 (64.4) |
17.4 (63.3) |
13.4 (56.1) |
7.4 (45.3) |
2.3 (36.1) |
−3.1 (26.4) |
5.9 (42.6) |
| Record low °C (°F) | −32.8 (−27) |
−31.7 (−25.1) |
−26.7 (−16.1) |
−15.0 (5) |
−3.9 (25) |
−2.2 (28) |
3.9 (39) |
4.4 (39.9) |
−2.2 (28) |
−8.9 (16) |
−20.6 (−5.1) |
−30.0 (−22) |
−32.8 (−27) |
| Average precipitation mm (inches) | 61.5 (2.421) |
55.4 (2.181) |
53.7 (2.114) |
68.0 (2.677) |
82.0 (3.228) |
70.9 (2.791) |
63.9 (2.516) |
81.1 (3.193) |
84.7 (3.335) |
64.4 (2.535) |
84.1 (3.311) |
61.5 (2.421) |
831.1 (32.72) |
| Average rainfall mm (inches) | 29.1 (1.146) |
29.7 (1.169) |
33.6 (1.323) |
61.1 (2.406) |
82.0 (3.228) |
70.9 (2.791) |
63.9 (2.516) |
81.1 (3.193) |
84.7 (3.335) |
64.3 (2.531) |
75.4 (2.969) |
38.2 (1.504) |
714.0 (28.11) |
| Average snowfall cm (inches) | 37.2 (14.65) |
27.0 (10.63) |
19.8 (7.8) |
5.0 (1.97) |
0.0 (0) |
0.0 (0) |
0.0 (0) |
0.0 (0) |
0.0 (0) |
0.1 (0.04) |
8.3 (3.27) |
24.1 (9.49) |
121.5 (47.83) |
| Average precipitation days (≥ 0.2 mm) | 15.4 | 11.6 | 12.6 | 12.6 | 12.7 | 11.0 | 10.4 | 10.2 | 11.1 | 11.7 | 13.0 | 13.2 | 145.5 |
| Average rainy days (≥ 0.2 mm) | 5.4 | 4.8 | 7.9 | 11.2 | 12.7 | 11.0 | 10.4 | 10.2 | 11.1 | 11.7 | 10.9 | 7.0 | 114.1 |
| Average snowy days (≥ 0.2 cm) | 12.0 | 8.7 | 6.5 | 2.2 | 0.0 | 0.0 | 0.0 | 0.0 | 0.0 | 0.08 | 3.1 | 8.4 | 40.9 |
| Mean monthly sunshine hours | 85.9 | 111.3 | 161.0 | 180.0 | 227.7 | 259.6 | 279.6 | 245.6 | 194.4 | 154.3 | 88.9 | 78.1 | 2,066.3 |
| Percent possible sunshine | 29.7 | 37.7 | 43.6 | 44.8 | 50.0 | 56.3 | 59.8 | 56.7 | 51.7 | 45.1 | 30.5 | 28.0 | 44.5 |
| Source: Environment Canada [22][23][24] | |||||||||||||
| Climate data for Lester B. Pearson International Airport 1981–2010 (Brampton and North Mississauga) | |||||||||||||
|---|---|---|---|---|---|---|---|---|---|---|---|---|---|
| Month | Jan | Feb | Mar | Apr | May | Jun | Jul | Aug | Sep | Oct | Nov | Dec | Year |
| Record high humidex | 19.0 | 14.8 | 29.2 | 37.9 | 42.6 | 45.0 | 50.3 | 46.6 | 48.0 | 39.1 | 28.6 | 23.9 | 50.3 |
| Record high °C (°F) | 17.6 (63.7) |
17.7 (63.9) |
26.0 (78.8) |
31.1 (88) |
34.4 (93.9) |
36.7 (98.1) |
37.6 (99.7) |
38.3 (100.9) |
36.7 (98.1) |
31.6 (88.9) |
25.0 (77) |
20.0 (68) |
38.3 (100.9) |
| Average high °C (°F) | −1.5 (29.3) |
−0.4 (31.3) |
4.6 (40.3) |
12.2 (54) |
18.8 (65.8) |
24.2 (75.6) |
27.1 (80.8) |
26.0 (78.8) |
21.6 (70.9) |
14.3 (57.7) |
7.6 (45.7) |
1.4 (34.5) |
13.0 (55.4) |
| Daily mean °C (°F) | −5.5 (22.1) |
−4.5 (23.9) |
0.1 (32.2) |
7.1 (44.8) |
13.1 (55.6) |
18.6 (65.5) |
21.5 (70.7) |
20.6 (69.1) |
16.2 (61.2) |
9.5 (49.1) |
3.7 (38.7) |
−2.2 (28) |
8.2 (46.8) |
| Average low °C (°F) | −9.4 (15.1) |
−8.7 (16.3) |
−4.5 (23.9) |
1.9 (35.4) |
7.4 (45.3) |
13.0 (55.4) |
15.8 (60.4) |
15.1 (59.2) |
10.8 (51.4) |
4.6 (40.3) |
−0.2 (31.6) |
−5.8 (21.6) |
3.3 (37.9) |
| Record low °C (°F) | −31.3 (−24.3) |
−31.1 (−24) |
−28.9 (−20) |
−17.2 (1) |
−5.6 (21.9) |
0.6 (33.1) |
3.9 (39) |
1.1 (34) |
−3.9 (25) |
−8.3 (17.1) |
−18.3 (−0.9) |
−31.1 (−24) |
−31.3 (−24.3) |
| Record low wind chill | −44.7 | −38.9 | −36.2 | −25.4 | −9.5 | 0.0 | 0.0 | 0.0 | −8.0 | −13.5 | −25.4 | −38.5 | −44.7 |
| Average precipitation mm (inches) | 51.8 (2.039) |
47.7 (1.878) |
49.8 (1.961) |
68.5 (2.697) |
74.3 (2.925) |
71.5 (2.815) |
75.7 (2.98) |
78.1 (3.075) |
74.5 (2.933) |
61.1 (2.406) |
75.1 (2.957) |
57.9 (2.28) |
785.9 (30.941) |
| Average rainfall mm (inches) | 25.1 (0.988) |
24.3 (0.957) |
32.6 (1.283) |
63.0 (2.48) |
74.3 (2.925) |
71.5 (2.815) |
75.7 (2.98) |
78.1 (3.075) |
74.5 (2.933) |
60.6 (2.386) |
68.0 (2.677) |
34.0 (1.339) |
681.6 (26.835) |
| Average snowfall cm (inches) | 29.5 (11.61) |
24.0 (9.45) |
17.7 (6.97) |
4.5 (1.77) |
0.02 (0.008) |
0.0 (0) |
0.0 (0) |
0.0 (0) |
0.0 (0) |
0.4 (0.16) |
7.5 (2.95) |
24.9 (9.8) |
108.5 (42.72) |
| Average precipitation days (≥ 0.2 mm) | 15.1 | 11.6 | 12.4 | 12.5 | 12.5 | 10.8 | 10.4 | 10.2 | 10.5 | 12.1 | 13.2 | 14.8 | 145.9 |
| Average rainy days (≥ 0.2 mm) | 5.4 | 4.6 | 7.4 | 11.3 | 12.5 | 10.8 | 10.4 | 10.2 | 10.5 | 12.0 | 11.0 | 7.1 | 113.2 |
| Average snowy days (≥ 0.2 cm) | 12.1 | 9.4 | 6.8 | 2.4 | 0.03 | 0.0 | 0.0 | 0.0 | 0.0 | 0.3 | 3.4 | 10.0 | 44.4 |
| Average relative humidity (%) (at 15:00) | 72.0 | 68.4 | 61.4 | 54.4 | 53.5 | 54.9 | 53.3 | 55.8 | 58.5 | 62.1 | 69.2 | 72.5 | 61.3 |
| Mean monthly sunshine hours | 79.7 | 112.2 | 159.4 | 204.4 | 228.2 | 249.7 | 294.4 | 274.5 | 215.7 | 163.7 | 94.2 | 86.2 | 2,161.4 |
| Percent possible sunshine | 27.6 | 38.0 | 43.2 | 50.8 | 50.1 | 54.1 | 63.0 | 63.4 | 57.4 | 47.8 | 32.0 | 30.9 | 46.5 |
| Source: Environment Canada[25][26][27][28] | |||||||||||||
| Climate data for Toronto Pearson International Airport (1971–2000) | |||||||||||||
|---|---|---|---|---|---|---|---|---|---|---|---|---|---|
| Month | Jan | Feb | Mar | Apr | May | Jun | Jul | Aug | Sep | Oct | Nov | Dec | Year |
| Average high °C (°F) | −2.1 (28.2) |
−1.1 (30) |
4.1 (39.4) |
11.5 (52.7) |
18.8 (65.8) |
23.7 (74.7) |
26.8 (80.2) |
25.6 (78.1) |
21.0 (69.8) |
13.9 (57) |
7.0 (44.6) |
0.9 (33.6) |
12.5 (54.5) |
| Daily mean °C (°F) | −6.3 (20.7) |
−5.4 (22.3) |
−0.4 (31.3) |
6.3 (43.3) |
12.9 (55.2) |
17.8 (64) |
20.8 (69.4) |
19.9 (67.8) |
15.3 (59.5) |
8.9 (48) |
3.2 (37.8) |
−2.9 (26.8) |
7.5 (45.5) |
| Average low °C (°F) | −10.5 (13.1) |
−9.7 (14.5) |
−5 (23) |
1.0 (33.8) |
6.9 (44.4) |
11.9 (53.4) |
14.8 (58.6) |
14.0 (57.2) |
9.6 (49.3) |
3.9 (39) |
−0.7 (30.7) |
−6.7 (19.9) |
2.5 (36.5) |
| Average precipitation mm (inches) | 52.2 (2.055) |
42.6 (1.677) |
57.1 (2.248) |
68.4 (2.693) |
72.5 (2.854) |
74.2 (2.921) |
74.4 (2.929) |
79.6 (3.134) |
77.5 (3.051) |
64.1 (2.524) |
69.3 (2.728) |
60.9 (2.398) |
792.7 (31.209) |
| Average rainfall mm (inches) | 24.9 (0.98) |
22.3 (0.878) |
36.7 (1.445) |
62.4 (2.457) |
72.4 (2.85) |
74.2 (2.921) |
74.4 (2.929) |
79.6 (3.134) |
77.5 (3.051) |
63.4 (2.496) |
62.0 (2.441) |
34.7 (1.366) |
684.6 (26.953) |
| Average snowfall cm (inches) | 31.1 (12.24) |
22.1 (8.7) |
19.2 (7.56) |
5.7 (2.24) |
0.1 (0.04) |
0 (0) |
0 (0) |
0 (0) |
0 (0) |
0.5 (0.2) |
7.6 (2.99) |
29.2 (11.5) |
115.4 (45.43) |
| Average precipitation days (≥ 0.2 mm) | 14.9 | 11.6 | 13.1 | 12.1 | 11.9 | 11.0 | 10.1 | 10.8 | 10.7 | 11.5 | 13.2 | 14.6 | 145.5 |
| Average rainy days (≥ 0.2 mm) | 5.1 | 4.6 | 8.0 | 10.7 | 11.9 | 11.0 | 10.1 | 10.8 | 10.7 | 11.5 | 10.6 | 6.7 | 111.8 |
| Average snowy days (≥ 0.2 cm) | 12.6 | 9.4 | 7.1 | 2.6 | 0.07 | 0 | 0 | 0 | 0 | 0.40 | 4.0 | 10.3 | 46.5 |
| Average relative humidity (%) | 81.7 | 81.3 | 81.2 | 78.8 | 80.0 | 82.6 | 84.5 | 88.6 | 89.5 | 87.1 | 84.7 | 83.7 | 83.6 |
| Mean monthly sunshine hours | 75 | 114 | 178 | 218 | 244 | 276 | 302 | 264 | 208 | 173 | 94 | 89 | 2,235 |
| Source #1: Environment Canada[29] | |||||||||||||
| Source #2: The Weather Network (sun only).[30] | |||||||||||||
| Climate data for Toronto (The Annex), 1971–2000 | |||||||||||||
|---|---|---|---|---|---|---|---|---|---|---|---|---|---|
| Month | Jan | Feb | Mar | Apr | May | Jun | Jul | Aug | Sep | Oct | Nov | Dec | Year |
| Average high °C (°F) | −1.1 (30) |
−0.2 (31.6) |
4.6 (40.3) |
11.3 (52.3) |
18.5 (65.3) |
23.5 (74.3) |
26.4 (79.5) |
25.3 (77.5) |
20.7 (69.3) |
13.8 (56.8) |
7.4 (45.3) |
1.8 (35.2) |
12.7 (54.9) |
| Daily mean °C (°F) | −4.2 (24.4) |
−3.2 (26.2) |
1.3 (34.3) |
7.6 (45.7) |
14.2 (57.6) |
19.2 (66.6) |
22.2 (72) |
21.3 (70.3) |
17.0 (62.6) |
10.6 (51.1) |
4.8 (40.6) |
−0.9 (30.4) |
9.2 (48.6) |
| Average low °C (°F) | −7.3 (18.9) |
−6.3 (20.7) |
−2 (28) |
3.8 (38.8) |
9.9 (49.8) |
14.8 (58.6) |
17.9 (64.2) |
17.3 (63.1) |
13.2 (55.8) |
7.3 (45.1) |
2.2 (36) |
−3.7 (25.3) |
5.6 (42.1) |
| Average precipitation mm (inches) | 61.2 (2.409) |
50.5 (1.988) |
66.1 (2.602) |
69.6 (2.74) |
73.3 (2.886) |
71.5 (2.815) |
67.5 (2.657) |
79.6 (3.134) |
83.4 (3.283) |
64.7 (2.547) |
75.7 (2.98) |
71.0 (2.795) |
834.0 (32.835) |
| Average rainfall mm (inches) | 29.2 (1.15) |
26.2 (1.031) |
42.0 (1.654) |
63.2 (2.488) |
73.3 (2.886) |
71.5 (2.815) |
67.5 (2.657) |
79.6 (3.134) |
83.4 (3.283) |
64.7 (2.547) |
67.3 (2.65) |
41.9 (1.65) |
709.8 (27.945) |
| Average snowfall cm (inches) | 38.2 (15.04) |
26.6 (10.47) |
22.0 (8.66) |
6.0 (2.36) |
0.0 (0) |
0.0 (0) |
0.0 (0) |
0.0 (0) |
0.0 (0) |
0.1 (0.04) |
8.1 (3.19) |
32.2 (12.68) |
133.1 (52.4) |
| Average precipitation days (≥ 0.2 mm) | 15.3 | 11.7 | 12.7 | 12.1 | 12.2 | 11.1 | 10.3 | 10.5 | 10.6 | 11.4 | 12.7 | 14.5 | 145.1 |
| Average rainy days (≥ 0.2 mm) | 5.2 | 4.6 | 8.0 | 10.9 | 12.2 | 11.1 | 10.3 | 10.5 | 10.6 | 11.4 | 10.6 | 7.4 | 112.8 |
| Average snowy days (≥ 0.2 cm) | 12.0 | 8.7 | 6.4 | 2.2 | 0.0 | 0.0 | 0.0 | 0.0 | 0.0 | 0.07 | 3.2 | 9.5 | 42.0 |
| Mean monthly sunshine hours | 88.3 | 110.3 | 156.3 | 185.4 | 229.1 | 256.2 | 276.2 | 241.3 | 188.0 | 148.4 | 83.6 | 74.7 | 2,037.6 |
| Percent possible sunshine | 30.5 | 37.3 | 42.3 | 46.1 | 50.3 | 55.5 | 59.1 | 55.7 | 50.0 | 43.3 | 28.7 | 26.8 | 43.8 |
| Source: Environment Canada[31] | |||||||||||||
Topography
Toronto has numerous hills and valleys that were carved out during the last Ice Age; The ravines are largely undeveloped, primarily as the result of Hurricane Hazel in 1954.
Both Dufferin Street and Caledonia Road between Davenport Road and Eglinton Avenue run across numerous steep hills and valleys.
Vaughan Road runs parallel to the buried Castle Frank Brook.
The Don River is categorized as an underfit river, given that river is too small for its much wider and deeper valley.
Grenadier Pond in High Park is the largest body of water fully within Toronto's city limits.
See also
Notes
References
- ↑ "Every Tree Counts A Portrait of Toronto's Urban Forest" (PDF). City of Toronto. 2013. p. 8. Archived from the original (PDF) on December 26, 2015. Retrieved February 7, 2016.
- ↑ "Plant Hardiness Data". Natural Resources Canada. January 14, 2015. Retrieved May 18, 2015.
- 1 2 "Toronto, Ontario". Canadian Climate Normals 1971–2000 (in English & French). Environment Canada. Retrieved June 22, 2013.
- 1 2 "Toronto Lester B. Pearson INT'L A". 1981–2010 Canadian Climate Normals. Environment Canada. Retrieved June 3, 2014.
- 1 2 "Canada's Wind Chill Index". Environment Canada. January 4, 2005. Archived from the original on November 27, 2001. Retrieved February 16, 2009.
The wind chill is expressed in temperature-like units, but because it is not the actual air temperature, it is given without the degree sign.
- ↑ "Archived copy". Archived from the original on March 4, 2016. Retrieved December 26, 2013.
- ↑ "Canada Left Out of Winter's Cold". Canada's Top Ten Weather Stories for 2012. Environment Canada. Retrieved February 18, 2015.
- ↑ "Toronto heat wave comes close to hottest March day on record". Toronto Star. Retrieved February 18, 2015.
- ↑ Ontario Weather Review Archived June 11, 2011, at the Wayback Machine.
- ↑ Lake Breeze Weather Archived March 4, 2016, at the Wayback Machine.
- ↑ "TO Flood by he Numbers". CTV News. Archived from the original on July 13, 2013.
- ↑ "Daily Data Report for July 1936 (station in University of Toronto)". National Climate Data and Information Archive. Retrieved June 21, 2012.
- ↑ "Scorching Toronto setting temperature records". CTV News Toronto. Retrieved February 18, 2015.
- ↑ Phillips, David. "Heat Wave". The Canadian Encyclopedia. The Historica-Dominion Institute. Retrieved June 21, 2012.
- ↑ Wencer, David (November 16, 2011). "The 1936 Heat Wave". Heritage Toronto. Retrieved June 21, 2012.
- ↑ Colbert, Sam (March 1, 2015). "It's official: February was Toronto's coldest month ever". Toronto Star. Retrieved March 4, 2015.
- ↑ Impact of urbanization on the climate of Toronto, Ontario, Canada Archived March 20, 2012, at the Wayback Machine.
- ↑ "Monthly Data Report for 1840". Canadian Climate Data. Environment Canada. June 22, 2016. Climate ID: 6158350. Retrieved July 15, 2016.
- ↑ "Monthly Data Report for 2003". Canadian Climate Data. Environment Canada. June 22, 2016. Climate ID: 6158350. Retrieved July 15, 2016.
- ↑ "Monthly Data Report for 2003". Canadian Climate Data. Environment Canada. June 22, 2016. Climate ID: 6158355. Retrieved July 15, 2016.
- ↑ Shum, David; Miller, Adam (February 23, 2017). "Toronto breaks warmest February day ever recorded". Global News.
- ↑ "The Annex". 1981 to 2010 Canadian Climate Normals. Environment Canada. February 13, 2014. Climate ID: 6158350. Retrieved February 24, 2014.
- ↑ "Daily Data Report for October 2007". Canadian Climate Data. Environment Canada. June 22, 2016. Climate ID: 6158355. Retrieved July 15, 2016.
- ↑ "Daily Data Report for February 2017". Canadian Climate Data. Environment Canada. August 9, 2016. Climate ID: 6158355. Retrieved February 24, 2017.
- ↑ "Toronto Lester B. Pearson International Airport". 1981-2010 Canadian Climate Normals. Environment Canada. Retrieved 2013-07-10.
- ↑ "Toronto Lester B. Pearson INT'L A". Canadian Climate Normals 1981–2010. Environment Canada. Retrieved 3 June 2014.
- ↑ "Daily Data Report for February 2017". Environment Canada. Retrieved 29 March 2017.
- ↑ http://climate.weather.gc.ca/climate_data/daily_data_e.html?StationID=5097&timeframe=2&StartYear=1840&EndYear=2018&Day=13&Year=2012&Month=3#
- ↑ "Canadian Climate Normals 1971–2000, Toronto Pearson International Airport". Environment Canada.
- ↑ Climate data for Toronto Lester B. Pearson Int'l, ON, Canada, accessed March 25, 2012.
- ↑ "Toronto, Ontario". Canadian Climate Normals 1971–2000 (in English and French). Environment Canada. Retrieved June 22, 2013.
| Features | |||||||
|---|---|---|---|---|---|---|---|
| History |
| ||||||
| Geography | |||||||
| Economy | |||||||
| Politics |
| ||||||
| Public services | |||||||
| Education |
| ||||||
| Culture |
| ||||||
| Transportation |
| ||||||
| |||||||