Results
| Party |
Votes |
% |
Seats |
+/– |
|---|
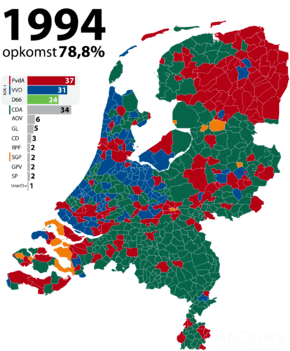
| Labour Party | 2,153,135 | 24.0 | 37 | –12 |
| Christian Democratic Appeal | 1,996,418 | 22.2 | 34 | –20 |
| People's Party for Freedom and Democracy | 1,792,401 | 20.0 | 31 | +9 |
| Democrats 66 | 1,391,202 | 15.5 | 24 | +12 |
| General Elderly Alliance | 326,401 | 3.6 | 6 | New |
| GreenLeft | 311,399 | 3.5 | 5 | –1 |
| Centre Democrats | 220,734 | 2.5 | 3 | +2 |
| Reformatory Political Federation | 158,705 | 1.8 | 3 | +2 |
| Reformed Political Party | 155,251 | 1.7 | 2 | –1 |
| Reformed Political League | 119,158 | 1.3 | 2 | 0 |
| Socialist Party | 118,768 | 1.3 | 2 | +2 |
| Union 55+ | 78,147 | 0.9 | 1 | New |
| Centre Party '86 | 32,327 | 0.4 | 0 | New |
| Natural Law Party | 27,665 | 0.3 | 0 | New |
| Progressive Integration Party | 17,230 | 0.2 | 0 | New |
| The Greens | 13,902 | 0.2 | 0 | 0 |
| New Communist Party of the Netherlands | 11,630 | 0.1 | 0 | New |
| Solidarity Farmers' Party | 9,096 | 0.1 | 0 | New |
| Party for Environment and Justice | 8,716 | 0.1 | 0 | New |
| Solidarity '93 | 7,919 | 0.1 | 0 | New |
| Pacifist Socialist Party '92 | 7,385 | 0.1 | 0 | New |
| The New Party | 6,825 | 0.1 | 0 | New |
| General Democratic Party | 5,196 | 0.1 | 0 | New |
| Patriotic Democratic Appeal | 4,845 | 0.1 | 0 | New |
| Socialist Alternative Politics | 4,347 | 0.1 | 0 | 0 |
| Libertarian Party | 2,754 | 0.0 | 0 | New |
| Invalid/blank votes | 46,331 | – | – | – |
| Total | 9,027,887 | 100 | 150 | 0 |
| Registered voters/turnout | 11,455,924 | 78.8 | – | – |
| Source: Nohlen & Stöver, European Elections Database |
| Popular Vote |
|---|
|
|
|
|
|
| PvdA |
|
23.97% |
| CDA |
|
22.23% |
| VVD |
|
19.96% |
| D66 |
|
15.49% |
| AOV |
|
3.63% |
| GL |
|
3.47% |
| CD |
|
2.46% |
| RPF |
|
1.77% |
| SGP |
|
1.73% |
| GPV |
|
1.33% |
| SP |
|
1.32% |
| Unie 55+ |
|
0.87% |
| Other |
|
1.78% |
|
References
- ↑ Dieter Nohlen & Philip Stöver (2010) Elections in Europe: A data handbook, p1396
ISBN 978-3-8329-5609-7
- ↑ Nohlen & Stöver, p1414
Further reading
- Irwin, Galen A. "The Dutch Parliamentary Election of 1994," Electoral Studies (1995) 14#1 pp. 72-77