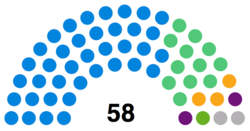
Ward Results
Figures are compared to the last time these seats were contested in any election cycle for the Epping Forest District Council election, this is indicated.
Broadley Common, Epping Forest & Nazeing
Broadley Common, Epping Forest & Nazeing (compared to 2011 election)
| Party |
Candidate |
Votes |
% |
± |
|
Conservative |
Lynn Hughes |
761 |
65.8 |
 18.1 18.1 |
|
UKIP |
Kevin Byford |
256 |
22.1 |
N/A |
|
Green |
Timothy Widdup |
77 |
6.6 |
3.2 |
|
Liberal Democrat |
Enid Robinson |
62 |
5.3 |
0.8 |
| Majority |
505 |
43.7 |
8.2 |
| Turnout |
1,156 |
67% |
 24.0 24.0 |
|
Conservative hold |
Swing |
|
|
Chipping Ongar, Greensted & Marden Ash
Chipping Ongar, Greensted & Marden Ash (compared to 2011 election)
| Party |
Candidate |
Votes |
% |
± |
|
Conservative |
Paul Keska |
1,268 |
51.6 |
22.7 |
|
UKIP |
Llyris Stebbings |
553 |
22.5 |
5.5 |
|
Liberal Democrat |
Barbara Szymanek |
428 |
17.4 |
12.0 |
|
Green |
Stephen Delarre |
207 |
8.4 |
1.9 |
| Majority |
715 |
29.1 |
17.8 |
| Turnout |
2,456 |
72% |
31.0 |
|
Conservative hold |
Swing |
|
|
Epping Hemnall
A by-election was held on the 25th September 2014 following the death of Mayor Ken Avey. Liberal Democrat, Kim Adams won with 43% of the vote compared to 28% for the Conservative party and 24% to UKIP. This election reversed this by-election result with Avey's son, Nigel replacing him, ousting the Liberal Democrat councillor
Epping Lindsey & Thornwood Common
Epping Lindsey & Thornwood Common (compared to 2014 election)
| Party |
Candidate |
Votes |
% |
± |
|
Conservative |
Chris Whitbread |
2,182 |
61.7 |
24.2 |
|
Liberal Democrat |
Ingrid Black |
558 |
15.7 |
1.8 |
|
Labour |
Simon Bullough |
524 |
14.8 |
2.7 |
|
Green |
William Hartington |
272 |
7.7 |
1.0 |
| Majority |
1,624 |
46.0 |
38.1 |
| Turnout |
3,536 |
69% |
31.0 |
|
Conservative hold |
Swing |
|
|
Hastingwood, Matching & Sheering Village
Hastingwood, Matching & Sheering Village (compared to 2012 election)
| Party |
Candidate |
Votes |
% |
± |
|
Independent |
Richard Morgan |
648 |
46.1 |
41.3 |
|
Conservative |
Joanne Share-Bernia |
597 |
42.5 |
N/A |
|
Labour |
Sandra Jenner |
160 |
11.3 |
N/A |
| Majority |
51 |
3.6 |
71.2 |
| Turnout |
1,405 |
74% |
29% |
|
Independent hold |
Swing |
|
|
Lambourne
Lambourne (compared to 2011 election)
| Party |
Candidate |
Votes |
% |
± |
|
Conservative |
Brian Rolfe |
706 |
69.6 |
10.4 |
|
UKIP |
David Mills |
308 |
30.3 |
N/A |
| Majority |
398 |
39.3 |
28.6 |
| Turnout |
1,014 |
68% |
26.0 |
|
Conservative hold |
Swing |
|
|
Lower Nazeing
Lower Nazeing (compared to 2014 election)
| Party |
Candidate |
Votes |
% |
± |
|
Conservative |
Richard Bassett |
1,775 |
81.5 |
12.5 |
|
Labour |
Kelvin Morris |
401 |
18.4 |
4.3 |
| Majority |
1,374 |
63.1 |
11.0 |
| Turnout |
2,176 |
67% |
31.0 |
|
Conservative hold |
Swing |
|
|
Waltham Abbey North East
Waltham Abbey North East (compared to 2012 election)
| Party |
Candidate |
Votes |
% |
± |
|
Conservative |
Ann Mitchell |
1,427 |
100% |
23.6 |
| Majority |
1,427 |
100% |
N/A |
| Turnout |
1,427 |
61% |
27.0 |
|
Conservative hold |
Swing |
|
|
Waltham Abbey Paternoster
Waltham Abbey Paternoster (compared to 2011 election)
| Party |
Candidate |
Votes |
% |
± |
|
Conservative |
Elizabeth Ann Webster |
N/A |
100% |
31.0 |
| Majority |
N/A |
100% |
31.7 |
| Turnout |
N/A |
N/A |
N/A |
|
Conservative hold |
Swing |
|
|