Basildon Borough Council election, 2012
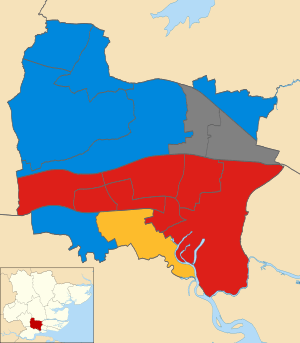
Map of the results of the 2012 Basildon council election. Conservatives in blue, Labour in red and Liberal Democrats in yellow. Wards in grey were not contested in 2012.
The 2012 Basildon Council election was scheduled to take place on 3 May 2012 to elect members of Basildon Borough Council in Essex, England. One third of the council seats was to be elected.
Election result
| Party | Seats | Gains | Losses | Net gain/loss | Seats % | Votes % | Votes | +/− | |
|---|---|---|---|---|---|---|---|---|---|
| Conservative | 29 | 0 | 4 | 25 | 41 | 13002 | -4 | ||
| Liberal Democrat | 2 | 0 | 0 | 2 | 8 | -0.9 | |||
| Labour | 11 | 4 | 0 | 15 | 30 | -2.1 | |||
| UKIP | 0 | 0 | 0 | 0 | 16 | 7.8 | |||
| British Freedom | 0 | 0 | 0 | 0 | 0 | 0 | 87 | 0 | |
| English Democrat | 0 | 0 | 0 | 0 | 0 | 0 | 94 | 0 | |
| National Front | 0 | 0 | 0 | 0 | 0 | 0 | 107 | 0 | |
| Independent | 0 | 0 | 0 | 0 | 0 | 0 | 720 | 0 | |
Billericay East
| Party | Candidate | Votes | % | ± | |
|---|---|---|---|---|---|
| Conservative | Stuart Bryan | 1502 | 58 | -6.6 | |
| UKIP | Susan McCaffery | 409 | 16 | +7.5 | |
| Labour | Patricia Reid | 383 | 15 | +1.1 | |
| Liberal Democrat | Nigel Horn | 316 | 12 | -1 | |
| Rejected ballots | 10 | ||||
| Majority | 1093 | 41.8 | -8.82 | ||
| Turnout | 2610 | 29 | -15.2 | ||
| Conservative hold | Swing | -7.05 | |||
Billericay West
| Party | Candidate | Votes | % | ± | |
|---|---|---|---|---|---|
| Conservative | Daniel Lawrence | 1688 | 57 | -2.3 | |
| Conservative | Philip Turner | 1648 | 0 | 0 | |
| UKIP | Terrence Gandy | 574 | 19 | 2.7 | |
| Labour | Santa Bennet | 380 | 13 | 1.3 | |
| Labour | Andrew Buxton | 257 | 0 | 0 | |
| Liberal Democrat | John James | 321 | 11 | 1 | |
| Rejected ballots | 18 | ||||
| Majority | 1114 | 38.4 | -4.6 | ||
| Turnout | 2701 | 29 | -14.5 | ||
| Conservative hold | Swing | -2.5 | |||
Burstead
| Party | Candidate | Votes | % | ± | |
|---|---|---|---|---|---|
| Conservative | Richard Moore | 1517 | 63 | 0.1 | |
| UKIP | Cherry Young | 396 | 16 | 6.1 | |
| Labour | Elaine McDonald | 359 | 15 | -1.6 | |
| Liberal Democrat | Benjamin Williams | 155 | 6 | -4.6 | |
| Rejected ballots | 13 | ||||
| Majority | 1121 | 46.2 | 0 | ||
| Turnout | 2427 | 28 | -15.6 | ||
| Conservative hold | Swing | -3.1 | |||
Crouch
| Party | Candidate | Votes | % | ± | |
|---|---|---|---|---|---|
| Conservative | Stuart Allen | 888 | 61 | -1 | |
| Labour | Sarah Davies | 299 | 20 | -4 | |
| UKIP | Graham Starling | 279 | 19 | 19 | |
| Rejected ballots | 7 | ||||
| Majority | 589 | 40.2 | -6.5 | ||
| Turnout | 1466 | 23 | -44 | ||
| Conservative hold | Swing | -2.5 | |||
Fryerns
| Party | Candidate | Votes | % | ± | |
|---|---|---|---|---|---|
| Labour | Adele Brown | 1,097 | 55 | +11.8 | |
| Conservative | Tina Arnold | 399 | 20 | -5.5 | |
| UKIP | David Sheppard | 366 | 18 | +6.5 | |
| Liberal Democrat | Arnold Lutton | 137 | 7 | -1.5 | |
| Rejected ballots | 11 | ||||
| Majority | 698 | ||||
| Turnout | 2012 | 21 | -9.1 | ||
| Labour hold | Swing | ||||
Laindon Park
| Party | Candidate | Votes | % | ± | |
|---|---|---|---|---|---|
| Labour | John Scarola | 867 | 41 | 2.4 | |
| Conservative | Frank Tomlin | 691 | 33 | -16.1 | |
| UKIP | Mark Ellis | 388 | 19 | 19 | |
| British Freedom | Tony Harris | 87 | 4 | 4 | |
| Liberal Democrat | Colin Grant | 61 | 3 | -4.5 | |
| Rejected ballots | 6 | ||||
| Majority | 176 | ||||
| Turnout | 2094 | 25 | -7.3 | ||
| Labour gain from Conservative | Swing | ||||
Langdon Hills
| Party | Candidate | Votes | % | ± | |
|---|---|---|---|---|---|
| Conservative | Stephen Hillier | 879 | 43 | -11 | |
| Labour | Jenefer Taylor | 651 | 32 | 14 | |
| UKIP | Andy Ager | 377 | 18 | 12 | |
| Liberal Democrat | Liz Grant | 108 | 5 | -11 | |
| Independent | Matthew Ing | 44 | 2 | 2 | |
| Rejected ballots | 3 | ||||
| Majority | 228 | 11 | -24.8 | ||
| Turnout | 2062 | 30 | -40 | ||
| Conservative hold | Swing | -12.5 | |||
Lee Chapel North
| Party | Candidate | Votes | % | ± | |
|---|---|---|---|---|---|
| Labour | Lynda Gordon | 1048 | 54 | -0.9 | |
| UKIP | Frank Ferguson | 359 | 18 | 18 | |
| Conservative | Craig Rimmer | 343 | 18 | -10.8 | |
| National Front | Thomas Beaney | 107 | 6 | -3.5 | |
| Liberal Democrat | Steve Nice | 85 | 4 | -2.7 | |
| Rejected ballots | 11 | ||||
| Majority | 689 | ||||
| Turnout | 1942 | 22 | -7.2 | ||
| Labour hold | Swing | ||||
Nethermayne
| Party | Candidate | Votes | % | ± | |
|---|---|---|---|---|---|
| Liberal Democrat | Geoff Williams | 899 | 36 | 11.5 | |
| Labour Co-op | Swatantra Nandanwar | 578 | 23 | -7.2 | |
| UKIP | Kerry Smith | 573 | 23 | 2.8 | |
| Conservative | Andrew Schrader | 427 | 17 | -6.1 | |
| X None Of The Above | 36 | 1 | -1.1 | ||
| Rejected ballots | 2517 | ||||
| Majority | 321 | ||||
| Turnout | 2517 | 28 | -6.9 | ||
| Liberal Democrat hold | Swing | ||||
Pitsea North West
| Party | Candidate | Votes | % | ± | |
|---|---|---|---|---|---|
| Labour | Gavin Callaghan | 932 | 49 | 1.7 | |
| Conservative | Andrew Baggott | 564 | 29 | -0.9 | |
| UKIP | Terry McBride | 323 | 17 | 0.3 | |
| Liberal Democrat | Martin Howard | 97 | 5 | -1.1 | |
| Rejected ballots | 7 | ||||
| Majority | 368 | ||||
| Turnout | 1923 | 21 | -4.5 | ||
| Labour gain from Conservative | Swing | ||||
Pitsea South East
| Party | Candidate | Votes | % | ± | |
|---|---|---|---|---|---|
| Labour | Aidan McGurran | 933 | 41 | 2.6 | |
| Conservative | Ann Blake | 876 | 39 | -4.6 | |
| UKIP | Imelda Clancy | 375 | 16 | 2 | |
| Liberal Democrat | Viv Howard | 91 | 4 | 0 | |
| Rejected ballots | 9 | ||||
| Majority | 9 | ||||
| Turnout | 2284 | 27 | -6.3 | ||
| Labour gain from Conservative | Swing | ||||
St. Martin's
| Party | Candidate | Votes | % | ± | |
|---|---|---|---|---|---|
| Labour | Phillip William | 759 | 58 | -0.2 | |
| Conservative | Tony Low | 248 | 19 | -13 | |
| UKIP | Peter Wood | 229 | 17 | 17 | |
| Liberal Democrat | Clare Nice | 80 | 6 | -4.2 | |
| Rejected ballots | 5 | ||||
| Majority | 511 | ||||
| Turnout | 1322 | 22 | -7.5 | ||
| Labour hold | Swing | ||||
Vange
| Party | Candidate | Votes | % | ± | |
|---|---|---|---|---|---|
| Labour | Byron Taylor | 919 | 59 | 6.7 | |
| Conservative | Luke MacKenzie | 320 | 20 | -6.6 | |
| UKIP | Becky Ager | 274 | 18 | 1.8 | |
| Liberal Democrat | Phillip Jenkins | 51 | 3 | -1.9 | |
| Rejected ballots | 11 | ||||
| Majority | 599 | ||||
| Turnout | 1564 | 23 | -7.6 | ||
| Labour gain from Conservative | Swing | ||||
Wickford North
| Party | Candidate | Votes | % | ± | |
|---|---|---|---|---|---|
| Conservative | Carole Morris | 1012 | 42 | -12.1 | |
| Independent | Dave Harrison | 676 | 28 | 3 | |
| Labour | Albert Ede | 409 | 17 | 0.4 | |
| UKIP | Trevor Malsbury | 199 | 8 | 8 | |
| English Democrat | Stephen Smith | 94 | 4 | 4 | |
| Rejected ballots | 9 | ||||
| Majority | 336 | ||||
| Turnout | 2399 | 25 | -12.3 | ||
| Conservative hold | Swing | ||||
Sources
http://www.basildon.gov.uk/CHttpHandler.ashx?id=3946&p=0 Statement of Persons Nominated
This article is issued from
Wikipedia.
The text is licensed under Creative Commons - Attribution - Sharealike.
Additional terms may apply for the media files.