Basildon District Council election, 2002
The 2002 Basildon District Council election took place on 2 May 2002 to elect members of Basildon District Council in Essex, England. The whole council was up for election with boundary changes since the last election in 2000.[1] The council stayed under no overall control.[2]
Background
A review of the boundaries on Basildon council made changes for this election leading to the whole council being elected.[3] Several new wards were created for the election including Crouch, Pitsea South East and St Martin's.[3]
Before the election both the Labour and Conservative parties had 19 seats, while the Liberal Democrats had 4 seats and Labour led a minority administration.[3] Several councillors stood down at the election including the Labour leader of the council John Potter.[3] Candidates standing in the election included the first member of the British National Party to do so, Matthew Single in Vange ward.[4]
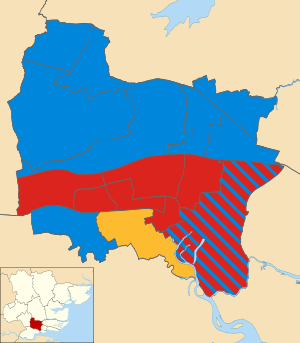
Election result
The results saw the Conservatives become the largest party on the council with 21 seats, but fail to win a majority.[5] They gained 1 seat each from Labour and the Liberal Democrats, who were left with 18 and 3 seats respectively.[5] However the expectation was that an alliance between Labour and the Liberal Democrats would continue to run the council as the outgoing Labour chairman could use his casting vote to keep Labour in power.[5] Meanwhile, the British National Party failed to win a seat after coming fifth in Vange ward.[5]
Following the election the alliance between Labour and the Liberal Democrats was confirmed in control of the council, with Labour councillor Nigel Smith, husband of Member of Parliament for Basildon Angela Smith, becoming the new leader of the council.[6]
| Party | Seats | Gains | Losses | Net gain/loss | Seats % | Votes % | Votes | +/− | |
|---|---|---|---|---|---|---|---|---|---|
| Conservative | 21 | +2 | 50.0 | 48.0 | 41,157 | ||||
| Labour | 18 | -1 | 42.9 | 34.4 | 29,475 | ||||
| Liberal Democrat | 3 | -1 | 7.1 | 16.6 | 14,251 | ||||
| Independent | 0 | 0 | 0 | 0.7 | 599 | ||||
| BNP | 0 | 0 | 0 | 0.2 | 189 | ||||
| Socialist Alliance | 0 | 0 | 0 | 0.1 | 93 | ||||
Ward results
| Party | Candidate | Votes | % | ± | |
|---|---|---|---|---|---|
| Conservative | Anthony Archer | 1,786 | 22.0 | ||
| Conservative | Stuart Sullivan | 1,745 | 21.5 | ||
| Conservative | David Dadds | 1,702 | 21.0 | ||
| Liberal Democrat | Gilda Bellard | 623 | 7.7 | ||
| Liberal Democrat | Dorothy Edwards | 597 | 7.4 | ||
| Liberal Democrat | John James | 573 | 7.1 | ||
| Labour | Anthony Bennett | 387 | 4.8 | ||
| Labour | Conor O'Brien | 363 | 4.5 | ||
| Labour | Kevin Wood | 341 | 4.2 | ||
| Turnout | 8,117 | ||||
| Party | Candidate | Votes | % | ± | |
|---|---|---|---|---|---|
| Conservative | Anthony Hedley | 1,965 | 25.1 | ||
| Conservative | Philip Turner | 1,869 | 23.8 | ||
| Conservative | Stephen Horgan | 1,844 | 23.5 | ||
| Liberal Democrat | Francis Bellard | 556 | 7.1 | ||
| Liberal Democrat | Craig Hands | 496 | 6.3 | ||
| Liberal Democrat | Jonathan Myall | 373 | 4.8 | ||
| Labour | Aidan McGurran | 253 | 3.2 | ||
| Labour | Fiona Smith | 253 | 3.2 | ||
| Labour | Mohamed Javed | 229 | 2.9 | ||
| Turnout | 7,838 | ||||
| Party | Candidate | Votes | % | ± | |
|---|---|---|---|---|---|
| Conservative | Geoffrey Buckenham | 1,627 | 20.9 | ||
| Conservative | Desmond Lake | 1,521 | 19.6 | ||
| Conservative | Kevin Blake | 1,469 | 18.9 | ||
| Liberal Democrat | Belinda Jackson | 779 | 10.0 | ||
| Liberal Democrat | James Edwards | 762 | 9.8 | ||
| Liberal Democrat | Geoffrey Taylor | 757 | 9.7 | ||
| Labour | Margaret Mary | 294 | 3.8 | ||
| Labour | Viney Reid | 286 | 3.7 | ||
| Labour | Patricia Reid | 272 | 3.5 | ||
| Turnout | 7,767 | ||||
| Party | Candidate | Votes | % | ± | |
|---|---|---|---|---|---|
| Conservative | Terri Sargent | 1,073 | 34.9 | ||
| Conservative | Stuart Allen | 1,023 | 33.3 | ||
| Labour | Wendy Aitken | 406 | 13.2 | ||
| Labour | Eva Borlase | 322 | 10.5 | ||
| Liberal Democrat | Arthur Ferriss | 248 | 8.1 | ||
| Turnout | 3,072 | ||||
| Party | Candidate | Votes | % | ± | |
|---|---|---|---|---|---|
| Labour | Janet Payn | 1,470 | 22.1 | ||
| Labour | Paul Kirkman | 1,452 | 21.8 | ||
| Labour | Julia Woods | 1,344 | 20.2 | ||
| Conservative | Deborah Allen | 596 | 9.0 | ||
| Conservative | Kenneth Evens | 560 | 8.4 | ||
| Conservative | Harold Liebner | 501 | 7.5 | ||
| Liberal Democrat | John Lutton | 279 | 4.2 | ||
| Liberal Democrat | Stephen Nice | 224 | 3.4 | ||
| Liberal Democrat | Tracey Williams | 222 | 3.3 | ||
| Turnout | 6,648 | ||||
| Party | Candidate | Votes | % | ± | |
|---|---|---|---|---|---|
| Labour | Barbara Croft | 1,148 | 20.6 | ||
| Labour | William Archibald | 1,077 | 19.3 | ||
| Labour | Anthony Borlase | 1,006 | 18.1 | ||
| Conservative | John Schofield | 766 | 13.8 | ||
| Conservative | Stephen Hills | 715 | 12.8 | ||
| Conservative | Francis Tomlin | 691 | 12.2 | ||
| Independent | Alfred Viccary | 165 | 3.0 | ||
| Turnout | 5,568 | ||||
| Party | Candidate | Votes | % | ± | |
|---|---|---|---|---|---|
| Conservative | Sandra Hillier | 923 | 27.2 | ||
| Conservative | Stephen Hillier | 871 | 25.7 | ||
| Independent | Derrick Fellowes | 434 | 12.8 | ||
| Labour | Lynda Gordon | 392 | 11.6 | ||
| Labour | Emily Evans | 363 | 10.7 | ||
| Liberal Democrat | Linda Williams | 239 | 7.0 | ||
| Liberal Democrat | Susan Dickinson | 171 | 5.0 | ||
| Turnout | 3,393 | ||||
| Party | Candidate | Votes | % | ± | |
|---|---|---|---|---|---|
| Labour | Nigel Smith | 1,165 | 20.3 | ||
| Labour | Maureen Larkin | 1,159 | 20.2 | ||
| Labour | Richard Rackham | 1,086 | 18.9 | ||
| Conservative | Sharon Cleasby | 530 | 9.2 | ||
| Conservative | Richard Hyland | 518 | 9.0 | ||
| Conservative | Sharon Reid | 515 | 9.0 | ||
| Liberal Democrat | Linda Martin | 241 | 4.2 | ||
| Liberal Democrat | Michael James | 229 | 4.0 | ||
| Liberal Democrat | Martin Neale | 214 | 3.7 | ||
| Socialist Alliance | Richard Duane | 93 | 1.6 | ||
| Turnout | 5,750 | ||||
| Party | Candidate | Votes | % | ± | |
|---|---|---|---|---|---|
| Liberal Democrat | Geoffrey Williams | 1,268 | 15.1 | ||
| Liberal Democrat | Joseph White | 1,245 | 14.9 | ||
| Liberal Democrat | Benjamin Williams | 1,199 | 14.2 | ||
| Labour | Michael Plant | 945 | 11.3 | ||
| Labour | Andrew Manning | 930 | 11.1 | ||
| Labour | Peter Wedlock | 841 | 10.0 | ||
| Conservative | Henry Tucker | 676 | 8.1 | ||
| Conservative | David Walsh | 642 | 7.7 | ||
| Conservative | Christine Walsh | 636 | 7.6 | ||
| Turnout | 8,382 | ||||
| Party | Candidate | Votes | % | ± | |
|---|---|---|---|---|---|
| Labour | Keith Bobbin | 997 | 21.2 | ||
| Labour | Allan Davies | 893 | 19.0 | ||
| Labour | Philip Rackley | 856 | 18.2 | ||
| Conservative | Roy Clarke | 543 | 11.5 | ||
| Conservative | Mark Levey | 491 | 10.4 | ||
| Conservative | Roy Watkinson | 456 | 9.7 | ||
| Liberal Democrat | Martin Howard | 238 | 5.1 | ||
| Liberal Democrat | Vivien Howard | 229 | 4.9 | ||
| Turnout | 4,703 | ||||
| Party | Candidate | Votes | % | ± | |
|---|---|---|---|---|---|
| Labour | Patrick Evans | 1,142 | 18.2 | ||
| Conservative | Jacqueline Blake | 1,120 | 17.8 | ||
| Labour | Dean Golding | 1,077 | 17.2 | ||
| Conservative | Malcolm Geddes | 1,001 | 15.9 | ||
| Conservative | Edward Phelan | 995 | 15.8 | ||
| Labour | Andrew Powderly | 944 | 15.0 | ||
| Turnout | 6,279 | ||||
| Party | Candidate | Votes | % | ± | |
|---|---|---|---|---|---|
| Labour | Richard Llewellyn | 771 | 30.4 | ||
| Labour | Colin Payn | 758 | 29.8 | ||
| Conservative | Gwen Ball | 329 | 13.0 | ||
| Conservative | Carol Mowe | 278 | 10.9 | ||
| Liberal Democrat | Michael Dickinson | 213 | 8.4 | ||
| Liberal Democrat | Annie Humphries | 191 | 7.5 | ||
| Turnout | 2,540 | ||||
| Party | Candidate | Votes | % | ± | |
|---|---|---|---|---|---|
| Labour | David Abrahall | 772 | 28.0 | ||
| Labour | Swatantra Nandanwar | 665 | 24.1 | ||
| Conservative | Garry Johnson | 403 | 14.6 | ||
| Conservative | Philip Johnson | 380 | 13.8 | ||
| BNP | Matthew Single | 189 | 6.9 | ||
| Liberal Democrat | Peter Hulse | 178 | 6.5 | ||
| Liberal Democrat | Seth Williams | 167 | 6.1 | ||
| Turnout | 2,754 | ||||
| Party | Candidate | Votes | % | ± | |
|---|---|---|---|---|---|
| Conservative | Malcolm Buckley | 1,165 | 33.4 | ||
| Conservative | Sylvia Buckley | 1,099 | 31.5 | ||
| Labour | Derek Burn | 356 | 10.2 | ||
| Labour | Albert Ede | 316 | 9.0 | ||
| Liberal Democrat | Kenneth Ward | 309 | 8.8 | ||
| Liberal Democrat | Arnald Thorpe | 248 | 7.1 | ||
| Turnout | 3,493 | ||||
| Party | Candidate | Votes | % | ± | |
|---|---|---|---|---|---|
| Conservative | Anthony Ball | 1,658 | 22.9 | ||
| Conservative | Carole Morris | 1,562 | 21.6 | ||
| Conservative | Michael Mowe | 1,522 | 21.0 | ||
| Labour | Jacqueline Brown | 639 | 8.8 | ||
| Labour | Christopher Wilson | 543 | 7.5 | ||
| Labour | Linda Howard | 489 | 6.8 | ||
| Liberal Democrat | Michael Maguire | 454 | 6.3 | ||
| Liberal Democrat | Ian Robertson | 368 | 5.1 | ||
| Turnout | 7,235 | ||||
| Party | Candidate | Votes | % | ± | |
|---|---|---|---|---|---|
| Conservative | Donald Morris | 731 | 32.9 | ||
| Conservative | Christopher Jackman | 660 | 29.7 | ||
| Labour | Leroy Stephenson | 237 | 10.7 | ||
| Labour | Clive Thomas | 236 | 10.6 | ||
| Liberal Democrat | Michael Woods | 208 | 9.3 | ||
| Liberal Democrat | Fane Cummings | 153 | 6.9 | ||
| Turnout | 2,225 | ||||
References
- ↑ "Basildon". BBC News Online. Retrieved 25 June 2011.
- 1 2 "Local Elections in England: 2 May 2002" (PDF). House of Commons Library. Archived (PDF) from the original on 5 June 2011. Retrieved 26 June 2011.
- 1 2 3 4 "Basildon: Parties battle for knife-edge control". Southend Standard. 9 April 2002. Retrieved 26 June 2011.
- ↑ "Basildon: BNP man mounts shock challenge". Southend Standard. 9 April 2002. Retrieved 26 June 2011.
- 1 2 3 4 "Basildon: Tories fail to snatch power". Southend Standard. 3 May 2002. Retrieved 26 June 2011.
- ↑ "Basildon: Nigel is appointed leader". Southend Standard. 17 May 2002. Retrieved 26 June 2011.
- 1 2 3 4 5 6 7 8 9 10 11 12 13 14 15 16 17 "Basildon". Local Elections Archive Project. Archived from the original on 25 July 2011. Retrieved 25 June 2011.