Colchester Borough Council election, 2004
|
| |||||||||||||||||||||||||||||||||||||||||||||||||||||||||||
| |||||||||||||||||||||||||||||||||||||||||||||||||||||||||||
20 seats (out of 60 seats) 31 seats needed for a majority | |||||||||||||||||||||||||||||||||||||||||||||||||||||||||||
|---|---|---|---|---|---|---|---|---|---|---|---|---|---|---|---|---|---|---|---|---|---|---|---|---|---|---|---|---|---|---|---|---|---|---|---|---|---|---|---|---|---|---|---|---|---|---|---|---|---|---|---|---|---|---|---|---|---|---|---|
| |||||||||||||||||||||||||||||||||||||||||||||||||||||||||||
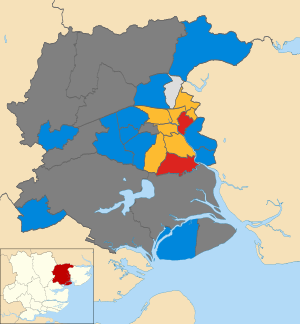
The 2004 Colchester Borough Council election took place on 10 June 2004 to elect members of Colchester Borough Council in Essex, England. This was the same day as the other 2004 United Kingdom local elections and as the 2004 European Parliament Elections. One third of the seats were up for election and the council stayed under no overall control.[1]
After the election, the composition of the council was
- Conservative 28
- Liberal Democrats 23
- Labour 6
- Independent 3[2]
Election result
The Conservatives gained 4 seats to become the largest party on the council with 28 seats, 3 short of a majority.[2][3] They overtook the Liberal Democrats who held 23 seats, Labour with 6 seats and 3 independents.[2] Overall turnout at the election was 34.4%.[4]
As a result, the Conservatives took all the seats on the council cabinet for the first time since that style of government was introduced in Colchester, with the Conservative group leader John Jowers becoming the new leader of the council.[3]
| Party | Seats | Gains | Losses | Net gain/loss | Seats % | Votes % | Votes | +/− | |
|---|---|---|---|---|---|---|---|---|---|
| Conservative | 11 | 4 | 0 | +4 | 55 | 40.9 | 13,908 | +0.3 | |
| Liberal Democrat | 6 | 0 | 2 | -2 | 30 | 34.2 | 11,619 | +2.2 | |
| Labour | 2 | 1 | 0 | +1 | 10 | 18.2 | 6,197 | -1.8 | |
| Independent | 1 | 0 | 3 | -4 | 5 | 6.7 | 2,266 | +1.0 | |
Ward results
Berechurch
| Party | Candidate | Votes | % | ± | |
|---|---|---|---|---|---|
| Liberal Democrat | Craig Sutton | 757 | 45.7 | -6.4 | |
| Labour | Dave Harris | 504 | 30.5 | +2.3 | |
| Conservative | Pauline Hazell | 394 | 23.8 | +4.7 | |
| Majority | 253 | 15.3 | -8.6 | ||
| Turnout | 1,655 | 28.8 | +4.3 | ||
| Liberal Democrat hold | Swing | ||||
Castle
| Party | Candidate | Votes | % | ± | |
|---|---|---|---|---|---|
| Liberal Democrat | William Spyvee | 1,185 | 57.9 | +3.5 | |
| Conservative | Pauline Lucas | 566 | 27.7 | +3.4 | |
| Labour | Malcolm Cannon | 296 | 14.5 | +1.8 | |
| Majority | 619 | 30.2 | +0.1 | ||
| Turnout | 2,047 | 35.4 | +6.8 | ||
| Liberal Democrat hold | Swing | ||||
Dedham & Langham
| Party | Candidate | Votes | % | ± | |
|---|---|---|---|---|---|
| Conservative | John Garnett | 991 | 79.0 | +5.3 | |
| Liberal Democrat | Carolyn Catney | 180 | 14.3 | -4.9 | |
| Labour | Ian Yates | 84 | 6.7 | -0.4 | |
| Majority | 811 | 64.6 | +10.1 | ||
| Turnout | 1,255 | 53.7 | +8.7[lower-alpha 1] | ||
| Conservative hold | Swing | ||||
East Donyland
| Party | Candidate | Votes | % | ± | |
|---|---|---|---|---|---|
| Labour | Andrew Raison | 428 | 43.9 | +0.7 | |
| Conservative | Patricia Sanderson | 296 | 30.3 | -6.9 | |
| Independent | Peter Byham | 159 | 16.3 | +16.3 | |
| Liberal Democrat | Barry Woodward | 93 | 9.5 | -10.1 | |
| Majority | 132 | 13.5 | +7.5 | ||
| Turnout | 976 | 48.9 | +12.9[lower-alpha 1] | ||
| Labour hold | Swing | ||||
Harbour
| Party | Candidate | Votes | % | ± | |
|---|---|---|---|---|---|
| Liberal Democrat | Justin Knight | 594 | 51.2 | -1.4 | |
| Conservative | Susan Harper | 292 | 25.2 | +10.8 | |
| Labour | David Canning | 275 | 23.7 | -9.4 | |
| Majority | 302 | 26.0 | — | ||
| Turnout | 1,161 | 27.2 | -1.8[lower-alpha 1] | ||
| Liberal Democrat hold | Swing | ||||
Highwoods
| Party | Candidate | Votes | % | ± | |
|---|---|---|---|---|---|
| Independent | Beverley Oxford[lower-alpha 2] | 807 | 42.5 | +16.2 | |
| Liberal Democrat | Paul Booker | 507 | 26.7 | -4.9 | |
| Conservative | Shahid Husain | 423 | 22.3 | -10.0 | |
| Labour | Hugh Thomas | 163 | 8.6 | -0.8 | |
| Majority | 300 | 15.8 | |||
| Turnout | 1,900 | 30.3 | +8.3 | ||
| Independent hold | Swing | ||||
Lexden
| Party | Candidate | Votes | % | ± | |
|---|---|---|---|---|---|
| Conservative | Donald Henshall | 1,194 | 62.3 | ||
| Liberal Democrat | Helen Bayliss | 569 | 29.7 | ||
| Labour | Alan Trudgian | 154 | 8.0 | ||
| Majority | 625 | 32.6 | |||
| Turnout | 1,917 | 44.7 | +0.7[lower-alpha 1] | ||
| Conservative hold | Swing | ||||
Marks Tey
| Party | Candidate | Votes | % | ± | |
|---|---|---|---|---|---|
| Conservative | Richard Gower | 517 | 61.5 | -3.2 | |
| Liberal Democrat | Martin Verran | 134 | 16.0 | +0.7 | |
| Labour | John Wood | 106 | 12.6 | -7.4 | |
| Independent | Patrick Mead | 83 | 9.9 | +9.9 | |
| Majority | 383 | 45.6 | +0.9 | ||
| Turnout | 840 | 41.0 | +10.0[lower-alpha 1] | ||
| Conservative hold | Swing | ||||
Mile End
| Party | Candidate | Votes | % | ± | |
|---|---|---|---|---|---|
| Conservative | Brian Jarvis | 681 | 46.1 | +11.0 | |
| Liberal Democrat | Peter Mecklenburg | 631 | 42.7 | -1.6 | |
| Labour | Janet Smith | 166 | 11.2 | -1.7 | |
| Majority | 50 | 3.4 | |||
| Turnout | 1,478 | 28.3 | +2.0 | ||
| Conservative hold | Swing | ||||
New Town
| Party | Candidate | Votes | % | ± | |
|---|---|---|---|---|---|
| Liberal Democrat | Peter Higgins | 972 | 55.3 | +0.3 | |
| Conservative | Glenn Bath | 483 | 27.5 | +4.2 | |
| Labour | David Hough | 302 | 17.2 | -2.9 | |
| Majority | 489 | 27.8 | -3.9 | ||
| Turnout | 1,757 | 28.2 | +5.3 | ||
| Liberal Democrat hold | Swing | ||||
Prettygate
| Party | Candidate | Votes | % | ± | |
|---|---|---|---|---|---|
| Conservative | Ron Levy | 1,304 | 49.0 | +5.7 | |
| Liberal Democrat | John Gray | 1,151 | 43.2 | -5.1 | |
| Labour | Luke Dopson | 208 | 7.8 | -0.6 | |
| Majority | 153 | 5.7 | |||
| Turnout | 2,663 | 44.8 | +8.6 | ||
| Conservative gain from Liberal Democrat | Swing | ||||
St. Andrew's
| Party | Candidate | Votes | % | ± | |
|---|---|---|---|---|---|
| Labour | Tina Dopson | 823 | 52.8 | -9.4 | |
| Liberal Democrat | Ralph Johnston | 378 | 24.3 | +3.7 | |
| Conservative | Anne Allan | 357 | 22.9 | +8.8 | |
| Majority | 445 | 28.6 | -19.1 | ||
| Turnout | 1,558 | 22.3 | +2.6 | ||
| Labour gain from Independent | Swing | ||||
St. Anne's
| Party | Candidate | Votes | % | ± | |
|---|---|---|---|---|---|
| Liberal Democrat | Helen Chuah | 998 | 54.7 | -3.6 | |
| Conservative | Angus Allan | 464 | 25.5 | +6.1 | |
| Labour | Robert Fisher | 361 | 19.8 | -0.4 | |
| Majority | 534 | 29.3 | -8.9 | ||
| Turnout | 1,823 | 28.3 | +5.6 | ||
| Liberal Democrat hold | Swing | ||||
St. John's
| Party | Candidate | Votes | % | ± | |
|---|---|---|---|---|---|
| Liberal Democrat | Paul Smith | 929 | 55.4 | -12.4 | |
| Conservative | Derek Smith | 587 | 35.0 | +10.9 | |
| Labour | Mike Warner | 160 | 9.5 | +1.4 | |
| Majority | 342 | 20.4 | — | ||
| Turnout | 1,676 | 40.2 | +4.2[lower-alpha 1] | ||
| Liberal Democrat hold | Swing | ||||
Shrub End
| Party | Candidate | Votes | % | ± | |
|---|---|---|---|---|---|
| Conservative | Roger Buston | 777 | 38.4 | +4.6 | |
| Liberal Democrat | Barry James | 737 | 36.4 | +10.4 | |
| Labour | Kim Naish | 512 | 25.3 | -12.7 | |
| Majority | 40 | 2.0 | |||
| Turnout | 2,026 | 34.0 | +9.5 | ||
| Conservative hold | Swing | ||||
Stanway
| Party | Candidate | Votes | % | ± | |
|---|---|---|---|---|---|
| Conservative | Andrew Ellis | 1,027 | 47.7 | +12.9 | |
| Liberal Democrat | Gwendoline Ilott | 839 | 39.0 | -13.3 | |
| Labour | John Spademan | 285 | 13.2 | +0.5 | |
| Majority | 188 | 8.7 | -8.9 | ||
| Turnout | 2,151 | 35.3 | +6.5 | ||
| Conservative gain from Liberal Democrat | Swing | ||||
Tiptree
| Party | Candidate | Votes | % | ± | |
|---|---|---|---|---|---|
| Conservative | Richard Martin | 925 | 41.0 | +6.0 | |
| Independent | John Elliott | 741 | 32.8 | -1.9 | |
| Labour | Alan Mogridge | 590 | 26.2 | -0.4 | |
| Majority | 184 | 8.2 | +7.9 | ||
| Turnout | 2,256 | 37.9 | +11.5 | ||
| Conservative gain from Independent | Swing | ||||
West Mersea
| Party | Candidate | Votes | % | ± | |
|---|---|---|---|---|---|
| Conservative | John Bouckley | 1,581 | 71.0 | +8.0 | |
| Labour | Audrey Spencer | 329 | 14.8 | -5.6 | |
| Liberal Democrat | Ronald Baker | 316 | 14.2 | +0.0 | |
| Majority | 1,252 | 56.2 | +13.6 | ||
| Turnout | 2,226 | 38.6 | +8.5 | ||
| Conservative hold | Swing | ||||
Wivenhoe Cross
| Party | Candidate | Votes | % | ± | |
|---|---|---|---|---|---|
| Conservative | Eugene Kraft | 420 | 46.4 | -7.0 | |
| Liberal Democrat | John Galpin | 356 | 39.3 | +22.1 | |
| Labour | Aulay MacKenzie | 129 | 14.3 | -15.1 | |
| Majority | 64 | 7.1 | |||
| Turnout | 905 | 27.2 | +10.4 | ||
| Conservative hold | Swing | ||||
Wivenhoe Quay
| Party | Candidate | Votes | % | ± | |
|---|---|---|---|---|---|
| Conservative | Ann Quarry | 629 | 36.6 | +7.9 | |
| Independent | Robert Newman | 476 | 27.7 | New | |
| Labour | Thomas Prosser | 322 | 18.7 | -5.8 | |
| Liberal Democrat | Jeremy Jacobs | 293 | 17.0 | New | |
| Majority | 153 | 8.9 | +2.0 | ||
| Turnout | 1,720 | 43.7 | +8.1 | ||
| Conservative gain from Independent | Swing | ||||
By-elections between 2004 and 2006
A by-election took place on 21 October 2004 in Berechurch after the resignation of Liberal Democrat councillor Susan Brooks.[6] Labour's David Harris took the seat from the Liberal Democrats by a majority of 345.[6]
| Party | Candidate | Votes | % | ± | |
|---|---|---|---|---|---|
| Labour | Dave Harris | 838 | 51.5 | +21.0 | |
| Liberal Democrat | Martin Verran | 493 | 30.3 | -15.4 | |
| Conservative | Andrew Bright | 296 | 18.2 | -5.6 | |
| Majority | 345 | 21.2 | |||
| Turnout | 1,627 | 30.0 | |||
| Labour gain from Liberal Democrat | Swing | ||||
References
- 1 2 "BBC News Vote 2004 Colchester Council". BBC News. BBC. Retrieved 5 June 2013.
- 1 2 3 4 "Colchester : Conservatives become leading party". Essex County Publications. NewsBank. 12 June 2004.
- 1 2 "Colchester : Council names all-Tory cabinet". Essex County Publications. NewsBank. 16 June 2004.
- 1 2 3 4 5 6 7 8 9 10 11 12 13 14 15 16 17 18 19 20 21 "Summary of the number of votes cast and % turnout". Colchester Borough Council. Retrieved 5 June 2013.
- 1 2 3 4 5 6 7 8 9 10 11 12 13 14 15 16 17 18 19 20 21 "Colchester Borough Council Elections 10 June 2004 - Results". Colchester Borough Council. Retrieved 5 June 2014.
- 1 2 Dines, Graham (22 October 2004). "Mixed results for the Lib Dems". East Anglian Daily Times. Retrieved 27 May 2014.
- ↑ "Labour wins byelection in army town". London: guardian.co.uk. 2004-10-22. Retrieved 2010-03-17.
- ↑ "Local Authority Byelection Results". Retrieved 27 May 2014.