Edmonton—Sherwood Park
|
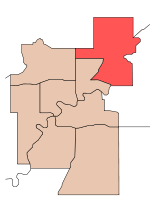
Edmonton–Sherwood Park in relation to other federal electoral districts in Edmonton | |
| Defunct federal electoral district | |
| Legislature | House of Commons |
| District created | 2003 |
| District abolished | 2013 |
| First contested | 2004 |
| Last contested | 2011 |
| District webpage | profile, map |
| Demographics | |
| Population (2011)[1] | 136,897 |
| Electors (2011) | 89,520 |
| Area (km²)[2] | 306.06 |
| Census divisions | Division No. 11 |
| Census subdivisions | Edmonton, Sherwood Park, Strathcona County, Fort Saskatchewan |
Edmonton—Sherwood Park was a federal electoral district in Alberta, Canada, that was represented in the House of Commons of Canada from 2004 to 2015. It was a suburban riding in Edmonton.
History
The electoral district was created in 2003 from Elk Island, Edmonton Centre-East and a small part of the Edmonton North riding.
Members of Parliament
This riding elected the following Member of Parliament:
| Parliament | Years | Member | Party | |
|---|---|---|---|---|
| Riding created from Elk Island, Edmonton Centre-East and Edmonton North |
||||
| 38th | 2004–2006 | Ken Epp | Conservative | |
| 39th | 2006–2008 | |||
| 40th | 2008–2011 | Tim Uppal | ||
| 41st | 2011–2015 | |||
| Riding dissolved into Sherwood Park—Fort Saskatchewan and Edmonton Manning |
||||
Election results
| Canadian federal election, 2011 | ||||||||
|---|---|---|---|---|---|---|---|---|
| Party | Candidate | Votes | % | ±% | Expenditures | |||
| Conservative | Tim Uppal | 24,623 | 44.66 | +8.82 | $92,544 | |||
| Independent | James Ford | 16,263 | 29.50 | -2.95 | $43,356 | |||
| New Democratic | Mike Scott | 7,971 | 14.46 | +1.57 | $61 | |||
| Liberal | Rick Szostak | 4,131 | 7.49 | -3.85 | $21,455 | |||
| Green | Chris Vallee | 1,926 | 3.49 | -3.99 | $1,475 | |||
| Western Block | Paul St. Laurent | 222 | 0.40 | * | $1,689 | |||
| Total valid votes/Expense limit | 55,136 | 100.00 | – | |||||
| Total rejected ballots | 148 | 0.27 | -0.01 | |||||
| Turnout | 55,284 | 59.14 | +4.05 | |||||
| Eligible voters | 93,478 | – | – | |||||
| Canadian federal election, 2008 | ||||||||
|---|---|---|---|---|---|---|---|---|
| Party | Candidate | Votes | % | ±% | Expenditures | |||
| Conservative | Tim Uppal | 17,628 | 35.84 | -28.13 | $85,943 | |||
| Independent | James Ford | 15,960 | 32.45 | – | $34,907 | |||
| New Democratic | Brian LaBelle | 6,339 | 12.89 | -1.42 | $110 | |||
| Liberal | Rick Szostak | 5,575 | 11.34 | -3.02 | $24,297 | |||
| Green | Nina Erfani | 3,678 | 7.48 | +0.13 | $3,171 | |||
| Total valid votes/Expense limit | 49,180 | 100.00 | $90,906 | |||||
| Total rejected ballots | 139 | 0.28 | ||||||
| Turnout | 49,319 | 55.09 | ||||||
| Canadian federal election, 2006 | ||||||||
|---|---|---|---|---|---|---|---|---|
| Party | Candidate | Votes | % | ±% | ||||
| Conservative | Ken Epp | 34,740 | 63.97 | +6.11 | ||||
| Liberal | Ron Symic | 7,801 | 14.36 | -10.12 | ||||
| New Democratic | Laurie Lang | 7,773 | 14.31 | +3.36 | ||||
| Green | Lynn T. Lau | 3,992 | 7.35 | +0.67 | ||||
| Total valid votes | 54,306 | 100.00 | ||||||
| Canadian federal election, 2004 | ||||||||
|---|---|---|---|---|---|---|---|---|
| Party | Candidate | Votes | % | ±% | Expenditures | |||
| Conservative | Ken Epp | 27,222 | 57.86 | – | $38,874 | |||
| Liberal | Maureen Towns | 11,519 | 24.48 | – | $51,197 | |||
| New Democratic | Chris Harwood | 5,155 | 10.95 | – | $2,821 | |||
| Green | Margaret Marean | 3,146 | 6.68 | – | $428 | |||
| Total valid votes | 47,042 | 100.00 | ||||||
| Total rejected ballots | 94 | 0.20 | ||||||
| Turnout | 47,136 | 60.15 | ||||||
See also
References
- "(Code 48016) Census Profile". 2011 census. Statistics Canada. 2012. Retrieved 2011-03-06.
- Riding history for Edmonton—Sherwood Park from the Library of Parliament
- Expenditures - 2008
- Expenditures - 2004
Notes
- ↑ Statistics Canada: 2012
- ↑ Statistics Canada: 2012
.png)
.png)
This article is issued from
Wikipedia.
The text is licensed under Creative Commons - Attribution - Sharealike.
Additional terms may apply for the media files.