Geography
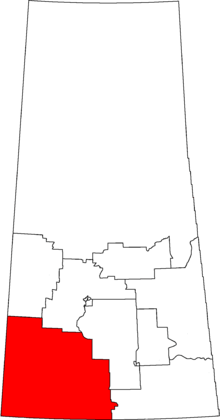
The district is in the southwestern corner of the Province of Saskatchewan.
Members of Parliament
This riding has elected the following members of the House of Commons:
Election results
| Canadian federal election, 2015 |
| Party |
Candidate |
Votes | % | ±% | Expenditures |
|
Conservative | David Anderson | 25,050 | 69.19 | -1.38 | $53,440.65 |
|
Liberal | Marvin Wiens | 5,381 | 14.86 | +9.02 | $50,766.23 |
|
New Democratic | Trevor Peterson | 4,783 | 13.21 | -7.59 | $43,201.40 |
|
Green | Bill Caton | 993 | 2.74 | -0.04 | $1,007.60 |
| Total valid votes/Expense limit |
36,207 | 100.0 | | $235,061.03 |
| Total rejected ballots |
99 | 0.27 | -0.03 |
| Turnout |
36,306 | 71.99 | +4.89 |
| Eligible voters |
50,426 |
|
Conservative hold |
Swing |
-5.22
|
| Source: Elections Canada[3][4] |
| Canadian federal election, 2011 |
| Party |
Candidate |
Votes | % | ±% | Expenditures |
|
Conservative | David L. Anderson | 20,555 | 69.8 | +5.4 | $39,752 |
|
New Democratic | Trevor Peterson | 6,248 | 21.2 | +5.4 | $9,855 |
|
Liberal | Duane Filson | 1,838 | 6.2 | -7.1 | $27,813 |
|
Green | Helmi Scott | 788 | 2.7 | -3.9 | $517 |
| Total valid votes/Expense limit |
29,429 | 100.0 | | $94,253 |
| Total rejected ballots |
79 | 0.3 | 0.0 |
| Turnout |
29,508 | 67.1 | +4 |
| Eligible voters |
43,997 | – | – |
|
Conservative hold |
Swing |
+6.25
|
| Canadian federal election, 2008 |
| Party |
Candidate |
Votes | % | ±% | Expenditures |
|
Conservative | David L. Anderson | 17,922 | 64.4 | -2.1 | $51,570 |
|
New Democratic | Scott Wilson | 4,394 | 15.8 | -1.1 | $5,879 |
|
Liberal | Duane Filson | 3,691 | 13.3 | +0.4 | $23,849 |
|
Green | Bill Clary | 1,840 | 6.6 | +2.8 | $4,012 |
| Total valid votes/Expense limit |
27,847 | 100.0 | | $91,352 |
| Total rejected ballots |
81 | 0.3 | 0.0 |
| Turnout |
27,928 | 63 | -3 |
|
Conservative hold |
Swing |
+1.0
|
| Canadian federal election, 2006 |
| Party |
Candidate |
Votes | % | ±% | Expenditures |
|
Conservative | David L. Anderson | 20,035 | 66.5 | +5.8 | $42,285 |
|
New Democratic | Mike Eason | 5,076 | 16.8 | +0.3 | $12,076 |
|
Liberal | Bill Caton | 3,885 | 12.9 | -5.8 | $3,553 |
|
Green | Amanda Knorr | 1,141 | 3.8 | -0.4 | – |
| Total valid votes |
30,137 | 100.0 | | – |
| Total rejected ballots |
85 | 0.3 | -0.1 |
| Turnout |
30,222 | 66.5 | +3 |
|
Conservative hold |
Swing |
+5.8
|
| Canadian federal election, 2004 |
| Party |
Candidate |
Votes | % | ±% | Expenditures |
|
Conservative | David L. Anderson | 18,010 | 60.6 | -9.9 | $35,176 |
|
Liberal | Bill Caton | 5,547 | 18.7 | +6.1 | $29,831 |
|
New Democratic | Jeff Potts | 4,901 | 16.5 | –0.4 | $17,512 |
|
Green | Bev Currie | 1,243 | 4.2 | | $805 |
| Total valid votes |
29,701 | 100 | | – |
| Total rejected ballots |
117 | 0.4 | +0.1 |
| Turnout |
29,818 | 63 | -2 |
|
Conservative hold |
Swing |
-8.0
|
| Canadian federal election, 2000 |
| Party |
Candidate |
Votes | % | ±% | Expenditures |
|
Alliance | David L. Anderson | 18,593 | 61.6 | +12.5 | $33,948 |
|
New Democratic | Keith Murch | 5,101 | 16.9 | -2.5 | $14,293 |
|
Liberal | Marlin Bryce Belt | 3,791 | 12.6 | -8.7 | $722 |
|
Progressive Conservative | Bill Caton | 2,676 | 8.9 | -1.3 | $7,462 |
| Total valid votes |
30,161 | 100 | | – |
| Total rejected ballots |
90 | 0.3 | 0.0 |
| Turnout |
30,251 | 65 | -2.4 |
|
Alliance hold |
Swing |
+10.6
|
| Canadian federal election, 1997 |
| Party |
Candidate |
Votes | % | ±% | Expenditures |
|
Reform | Lee Morrison | 16,439 | 49.1 | – | $36,935 |
|
Liberal | Ron Gleim | 7,130 | 21.3 | – | $52,705 |
|
New Democratic | Dean Smith | 6,490 | 19.4 | – | $36,138 |
|
Progressive Conservative | Marcel Fournier | 3,421 | 10.2 | – | $9,917 |
| Total valid votes |
33,480 | 100 | | – |
| Total rejected ballots |
105 | 0.3 |
| Turnout |
33,585 | 67.4 |
.png)