Colchester Borough Council election, 2003
|
| |||||||||||||||||||||||||||||||||||||||||||||||||||||||||||
| |||||||||||||||||||||||||||||||||||||||||||||||||||||||||||
20 seats (out of 60 seats) 31 seats seats needed for a majority | |||||||||||||||||||||||||||||||||||||||||||||||||||||||||||
|---|---|---|---|---|---|---|---|---|---|---|---|---|---|---|---|---|---|---|---|---|---|---|---|---|---|---|---|---|---|---|---|---|---|---|---|---|---|---|---|---|---|---|---|---|---|---|---|---|---|---|---|---|---|---|---|---|---|---|---|
| |||||||||||||||||||||||||||||||||||||||||||||||||||||||||||
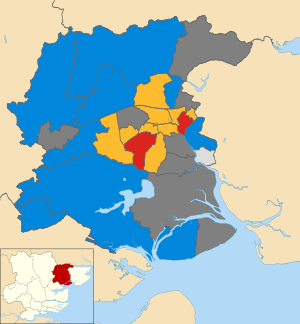
The 2003 Colchester Borough Council election took place on 1 May 2003 to elect members of Colchester Borough Council in Essex, England. This was the same day as the other 2003 United Kingdom local elections. One third of the seats were up for election and the council stayed under no overall control.[1]
Background
Before the election the Conservatives were the largest party with 24 seats, the Liberal Democrats had 23 seats, Labour had 4 seats, there were 8 independents and 1 seat was vacant after the sitting Labour councillor moved to Scotland.[2] The council was run by a cabinet comprising 3 Conservatives, 3 Liberal Democrats and 1 Labour members.[3]
21 seats were being contested, with 2 seats available in Wivenhoe Cross due to the vacancy.[2] The remaining 20 seats all had the sitting councillors defending their seats and included the Labour group leader Tim Young in St Andrew's and the Conservative mayor Nigel Chapman in Fordham and Stour.[2] Meanwhile, in High Woods, Ian Ringer, defended the seat as an independent after leaving the Liberal Democrats earlier in 2003.[2]
Election result
Prior to the election, 3 Liberal Democrat councillors from Highwoods ward defected and sat as Independents, reducing the Liberal Democrat group to 23 councillors.
Following the election Bob Newman left the Labour group to sit as an independent, reducing Labour to 4 councillors.[3][4] Labour then went into opposition after refusing to work with the Conservatives and a new cabinet was formed with 4 Conservative and 4 Liberal Democrat members.[3]
| Party | Seats | Gains | Losses | Net gain/loss | Seats % | Votes % | Votes | +/− | |
|---|---|---|---|---|---|---|---|---|---|
| Conservative | 10 | 3 | 3 | 0 | 47.6 | 40.6 | 11,108 | +1.1% | |
| Liberal Democrat | 8 | 2 | 0 | +2 | 38.1 | 32.0 | 8,740 | -4.4% | |
| Labour | 2 | 1 | 1 | 0 | 9.5 | 20.0 | 5,467 | +0.9% | |
| Independent | 1 | 0 | 2 | -2 | 4.8 | 5.7 | 1,563 | +2.0% | |
| Green | 0 | 0 | 0 | 0 | 0 | 1.4 | 370 | +0.2% | |
| Socialist Alliance | 0 | 0 | 0 | 0 | 0 | 0.4 | 96 | +0.3% | |
Ward results
Shown below are ward results according to the council's election results archive.[6][7][8]
Three of the single-seat wards (Dedham & Langham, East Donyland, Marks Tey) were not up for election this year. Neither were three of the two-seat wards (Harbour, Lexden, St John's).
Berechurch
| Party | Candidate | Votes | % | ± | |
|---|---|---|---|---|---|
| Liberal Democrat | Susan Brooks | 746 | 52.1 | +2.0 | |
| Labour | Julia Thomas | 404 | 28.2 | -7.1 | |
| Conservative | Sarah McLean | 274 | 19.2 | +5.1 | |
| Majority | 342 | 23.88 | |||
| Turnout | 1,432 | 24.5 | -6.5 | ||
| Liberal Democrat hold | Swing | ||||
Birch & Winstree
| Party | Candidate | Votes | % | ± | |
|---|---|---|---|---|---|
| Conservative | Peter Crowe | 966 | 71.8 | +9.5 | |
| Liberal Democrat | Barry Woodward | 190 | 14.1 | -6.2 | |
| Labour | Audrey Spencer | 183 | 13.6 | -3.8 | |
| Majority | 776 | 57.7 | |||
| Turnout | 1,345 | 31.0 | -8.0 | ||
| Conservative hold | Swing | ||||
Castle
| Party | Candidate | Votes | % | ± | |
|---|---|---|---|---|---|
| Liberal Democrat | Kenneth Jones | 903 | 54.4 | -2.0 | |
| Conservative | Pauline Lucas | 404 | 24.3 | +4.8 | |
| Labour | Malcolm Cannon | 210 | 12.7 | -1.4 | |
| Green | Walter Schwarz | 132 | 8.0 | -2.0 | |
| Majority | 499 | 30.1 | |||
| Turnout | 1,660 | 28.6 | -3.4 | ||
| Liberal Democrat hold | Swing | ||||
Christ Church
| Party | Candidate | Votes | % | ± | |
|---|---|---|---|---|---|
| Liberal Democrat | Martin Hunt | 662 | 48.0 | +6.1 | |
| Conservative | Roger Buston | 587 | 42.6 | +1.8 | |
| Labour | David Canning | 124 | 9.0 | -8.3 | |
| Majority | 75 | 5.4 | — | ||
| Turnout | 1,379 | 43.4 | +3.4 | ||
| Liberal Democrat gain from Conservative | Swing | ||||
Copford & West Stanway
| Party | Candidate | Votes | % | ± | |
|---|---|---|---|---|---|
| Conservative | Elizabeth Jewell Blundell | 353 | 70.46 | -4.69 | |
| Independent | Patrick James Mead | 70 | 13.97 | +13.97 | |
| Labour | Anna Geraldine Trudgian | 40 | 7.98 | +7.98 | |
| Liberal Democrat | Anthony Scott-Boutell | 37 | 7.39 | -17.07 | |
| Majority | 283 | 56.49 | +5.81 | ||
| Turnout | 501 | 34.0 | -1.0 | ||
| Conservative hold | Swing | ||||
Fordham & Stour
| Party | Candidate | Votes | % | ± | |
|---|---|---|---|---|---|
| Conservative | Nigel Chapman | 797 | 71.9 | +9.9 | |
| Liberal Democrat | Wilma Sutton | 161 | 14.5 | -7.5 | |
| Labour | Gary Griffiths | 144 | 13.0 | -3.0 | |
| Majority | 636 | 57.4 | |||
| Turnout | 1,108 | 27.6 | -5.4 | ||
| Conservative hold | Swing | ||||
Great Tey
| Party | Candidate | Votes | % | ± | |
|---|---|---|---|---|---|
| Conservative | Peter Chillingworth | 645 | 68.6 | +2.9 | |
| Liberal Democrat | Carolyn Catney | 196 | 20.9 | -13.4 | |
| Labour | Alan Trudigan | 108 | 11.49 | New | |
| Majority | 449 | 47.8 | +16.3 | ||
| Turnout | 940 | 42.7 | +2.7 | ||
| Conservative hold | Swing | ||||
Highwoods
| Party | Candidate | Votes | % | ± | |
|---|---|---|---|---|---|
| Conservative | Maris Fuller | 417 | 32.3 | ||
| Liberal Democrat | Alan Hayman | 408 | 31.6 | ||
| Independent | Ian Ringer[lower-alpha 1] | 339 | 26.3 | New | |
| Labour | Edmund Chinnery | 121 | 9.4 | ||
| Majority | 9 | 0.7 | |||
| Turnout | 1,290 | 22.0 | |||
| Conservative gain from Independent | Swing | ||||
Mile End
| Party | Candidate | Votes | % | ± | |
|---|---|---|---|---|---|
| Liberal Democrat | Anne Turrell | 589 | 44.3 | +13.6 | |
| Conservative | Shahid Husain | 400 | 30.1 | -3.6 | |
| Labour | Janet Smith | 171 | 12.9 | -11.8 | |
| Independent | Jane Chinnery | 124 | 9.3 | New | |
| Green | Mary Bryan | 40 | 3.0 | New | |
| Majority | 189 | 14.2 | |||
| Turnout | 1,331 | 26.3 | +0.3 | ||
| Liberal Democrat hold | Swing | ||||
New Town
| Party | Candidate | Votes | % | ± | |
|---|---|---|---|---|---|
| Liberal Democrat | Margaret Fisher | 767 | 55.9 | -1.1 | |
| Conservative | Glenn Bath | 325 | 23.7 | +8.0 | |
| Labour | Jane Green | 281 | 20.5 | -6.8 | |
| Majority | 442 | 31.7 | |||
| Turnout | 1,395 | 22.9 | -3.1 | ||
| Liberal Democrat hold | Swing | ||||
Prettygate
| Party | Candidate | Votes | % | ± | |
|---|---|---|---|---|---|
| Liberal Democrat | Sandra Gray | 1,044 | 48.3 | +4.9 | |
| Conservative | Ronald Levy | 935 | 43.3 | +0.7 | |
| Labour | Luke Dopson | 182 | 8.4 | -5.5 | |
| Majority | 109 | 5.0 | |||
| Turnout | 2,161 | 36.2 | -0.8 | ||
| Liberal Democrat gain from Conservative | Swing | ||||
St. Andrew's
| Party | Candidate | Votes | % | ± | |
|---|---|---|---|---|---|
| Labour | Tim Young | 813 | 62.2 | +6.1 | |
| Liberal Democrat | Jennifer Berriman | 270 | 20.6 | -0.7 | |
| Conservative | Anne Allan | 184 | 14.1 | -1.6 | |
| Socialist Alliance | Jeremy Jepps | 41 | 3.1 | -3.9 | |
| Majority | 543 | 41.4 | — | ||
| Turnout | 1,313 | 19.7 | -0.3 | ||
| Labour hold | Swing | ||||
St. Anne's
| Party | Candidate | Votes | % | ± | |
|---|---|---|---|---|---|
| Liberal Democrat | Barrie Cook | 853 | 58.4 | +3.1 | |
| Labour | Peter Brine | 295 | 20.2 | -6.1 | |
| Conservative | Angus Allan | 283 | 19.4 | +0.9 | |
| Socialist Alliance | David Isaacson | 31 | 2.1 | New | |
| Majority | 558 | 38.2 | — | ||
| Turnout | 1,461 | 22.7 | -2.3 | ||
| Liberal Democrat hold | Swing | ||||
Shrub End
| Party | Candidate | Votes | % | ± | |
|---|---|---|---|---|---|
| Labour | Richard Bourne | 596 | 38.0 | +4.6 | |
| Conservative | Alan Scattergood | 530 | 33.8 | -3.1 | |
| Liberal Democrat | Barbara Williamson | 408 | 26.0 | -3.7 | |
| Socialist Alliance | John Coombes | 24 | 1.5 | N/A | |
| Majority | 66 | 4.2 | +4.0 | ||
| Turnout | 1,568 | 24.5 | -0.5 | ||
| Labour gain from Conservative | Swing | 3.9 | |||
Stanway
| Party | Candidate | Votes | % | ± | |
|---|---|---|---|---|---|
| Liberal Democrat | Lesley Scott-Boutell | 918 | 52.3 | +1.1 | |
| Conservative | John Reeves | 610 | 34.8 | +0.4 | |
| Labour | John Spademan | 222 | 12.7 | +0.4 | |
| Majority | 308 | 17.6 | — | ||
| Turnout | 1755 | 28.8 | -5.2 | ||
| Liberal Democrat hold | Swing | ||||
Tiptree
| Party | Candidate | Votes | % | ± | |
|---|---|---|---|---|---|
| Conservative | Margaret Crowe | 546 | 35.0 | +17.2 | |
| Independent | Anne Burgess | 542 | 34.7 | -0.9 | |
| Labour | Alan Mogridge | 415 | 26.6 | +1.2 | |
| Green | Stella Barnes | 56 | 3.6 | -4.6 | |
| Majority | |||||
| Turnout | 1,561 | 26.4 | -2.6 | ||
| Conservative gain from Independent | Swing | ||||
West Bergholt & Eight Ash Green
| Party | Candidate | Votes | % | ± | |
|---|---|---|---|---|---|
| Conservative | Jill Tod | 774 | 66.4 | +19.2 | |
| Liberal Democrat | Una Jones | 238 | 20.4 | +0.3 | |
| Labour | Ian Yates | 149 | 12.8 | -5.1 | |
| Majority | 536 | 46.0 | |||
| Turnout | 1,166 | 30.3 | -2.7 | ||
| Conservative hold | Swing | ||||
West Mersea
| Party | Candidate | Votes | % | ± | |
|---|---|---|---|---|---|
| Conservative | Margaret Anne Kimberley | 1107 | 63.0 | ||
| Labour | Bry Whittle Mogridge | 359 | 20.43 | ||
| Liberal Democrat | Ronald Charles Laurance Baker | 249 | 14.17 | ||
| Majority | 748 | 42.57 | |||
| Turnout | 1757 | 30.1 | -0.9 | ||
| Conservative hold | Swing | ||||
Wivenhoe Cross
| Party | Candidate | Votes | % | ± | |
|---|---|---|---|---|---|
| Conservative | David Adams | 313 | 53.4 | +17.3 | |
| Conservative | Eugene Kraft | 264 | |||
| Labour | Aulay MacKenzie | 172 | 29.4 | -14.6 | |
| Labour | Paul Bishop | 142 | |||
| Liberal Democrat | Barry James | 101 | 17.2 | -2.7 | |
| Turnout | 544 | 16.8 | -0.2 | ||
| Conservative hold | Swing | ||||
| Conservative gain from Labour | Swing | ||||
Wivenhoe Quay
| Party | Candidate | Votes | % | ± | |
|---|---|---|---|---|---|
| Independent | Richard Davies | 488 | 35.6 | +4.1 | |
| Conservative | Kenneth Rogers | 394 | 28.7 | +5.8 | |
| Labour | Stephen Ford | 336 | 24.5 | -8.4 | |
| Green | Christopher Fox | 142 | 10.4 | -2.4 | |
| Majority | 94 | 6.9 | — | ||
| Turnout | 1,371 | 35.6 | -2.4 | ||
| Independent hold | Swing | ||||
- ↑ The Independent candidate in Highwoods ward was elected as a Liberal Democrat in 2002.
By-elections between 2003 and 2004
A by-election took place on 22 April 2004 after the death of the independent councillor Richard Davies.[9]
| Party | Candidate | Votes | % | ± | |
|---|---|---|---|---|---|
| Labour | Stephen Ford | 626 | 34.4 | +9.7 | |
| Conservative | Anne Quarrie | 614 | 33.7 | +4.7 | |
| Liberal Democrat | Jeremy Jacobs | 581 | 31.9 | +31.9 | |
| Majority | 12 | 0.7 | |||
| Turnout | 1,821 | 44.0 | |||
| Labour gain from Independent | Swing | ||||
References
- ↑ "Colchester : Hung council on election night". Essex County Publications. NewsBank. 2 May 2003.
- 1 2 3 4 "Essex: Politicians set to slug it out". Essex County Publications. NewsBank. 2 April 2003.
- 1 2 3 "Colchester : No Labour place on council cabinet". Essex County Publications. NewsBank. 7 May 2003.
- ↑ "Wivenhoe: Councillor Newman leaves Labour". Essex County Publications. NewsBank. 7 May 2003.
- ↑ "BBC News Vote 2003 Local Elections". BBC News. BBC. Retrieved 20 May 2013.
- 1 2 "Colchester Borough Council Elections 1 May 2003 - Results". Colchester Borough Council. Retrieved 20 May 2013.
- ↑ "Colchester election results 2003". East Anglian Daily Times. 6 May 2003. Retrieved 26 May 2014.
- ↑ "Summary of the number of votes cast and turnout". Colchester Borough Council. Retrieved 26 May 2014.
- ↑ "Wivenhoe: Man defends election call that cost £1, 400". Essex County Publications. NewsBank. 17 March 2004.
- ↑ "Local Authority Byelection Results". Retrieved 27 May 2014.
| Metropolitan boroughs |
|
|---|---|
| Unitary authorities |
|
| District councils (England) |
|
| Scottish councils |
|
| National Assembly elections | |