Cangxi County
| Cangxi County 苍溪县 | |
|---|---|
| County | |
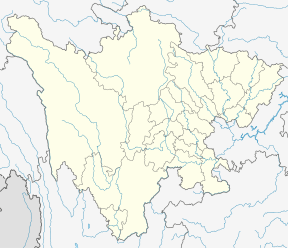 Cangxi Location in Sichuan | |
| Coordinates: 31°55′13″N 106°02′35″E / 31.9203°N 106.043°ECoordinates: 31°55′13″N 106°02′35″E / 31.9203°N 106.043°E | |
| Country | People's Republic of China |
| Province | Sichuan |
| Prefecture-level city | Guangyuan |
| Township-level divisions |
22 towns 17 townships |
| County seat | Lingjiang (陵江镇) |
| Elevation | 390 m (1,280 ft) |
| Population | |
| • Total | 780,000 |
| Time zone | UTC+8 (China Standard) |
| Website |
www |
Cangxi County (simplified Chinese: 苍溪县; traditional Chinese: 蒼溪縣; pinyin: Cāngxī Xiàn) is a county of northeastern Sichuan Province, China, located along the upper reaches of the Jialing River. It is under the administration of Guangyuan City.
Climate
| Climate data for Cangxi (1981−2010) | |||||||||||||
|---|---|---|---|---|---|---|---|---|---|---|---|---|---|
| Month | Jan | Feb | Mar | Apr | May | Jun | Jul | Aug | Sep | Oct | Nov | Dec | Year |
| Record high °C (°F) | 19.3 (66.7) |
23.9 (75) |
29.8 (85.6) |
34.0 (93.2) |
36.4 (97.5) |
37.4 (99.3) |
39.8 (103.6) |
40.8 (105.4) |
37.8 (100) |
31.0 (87.8) |
26.8 (80.2) |
20.0 (68) |
40.8 (105.4) |
| Average high °C (°F) | 9.4 (48.9) |
11.9 (53.4) |
16.6 (61.9) |
22.3 (72.1) |
26.8 (80.2) |
28.9 (84) |
31.0 (87.8) |
31.1 (88) |
26.1 (79) |
21.0 (69.8) |
16.1 (61) |
10.4 (50.7) |
21 (69.7) |
| Daily mean °C (°F) | 5.8 (42.4) |
8.1 (46.6) |
11.9 (53.4) |
17.0 (62.6) |
21.5 (70.7) |
24.2 (75.6) |
26.3 (79.3) |
26.0 (78.8) |
21.8 (71.2) |
16.9 (62.4) |
12.1 (53.8) |
7.1 (44.8) |
16.6 (61.8) |
| Average low °C (°F) | 3.1 (37.6) |
5.2 (41.4) |
8.4 (47.1) |
13.0 (55.4) |
17.4 (63.3) |
20.5 (68.9) |
22.8 (73) |
22.4 (72.3) |
18.8 (65.8) |
14.2 (57.6) |
9.3 (48.7) |
4.6 (40.3) |
13.3 (56) |
| Record low °C (°F) | −3.3 (26.1) |
−1.2 (29.8) |
−1.4 (29.5) |
3.6 (38.5) |
8.7 (47.7) |
13.5 (56.3) |
16.9 (62.4) |
15.8 (60.4) |
12.5 (54.5) |
2.7 (36.9) |
0.4 (32.7) |
−4.2 (24.4) |
−4.2 (24.4) |
| Average precipitation mm (inches) | 11.9 (0.469) |
14.9 (0.587) |
26.4 (1.039) |
58.9 (2.319) |
115.4 (4.543) |
141.5 (5.571) |
212.6 (8.37) |
183.8 (7.236) |
150.4 (5.921) |
60.0 (2.362) |
27.3 (1.075) |
10.6 (0.417) |
1,013.7 (39.909) |
| Average relative humidity (%) | 75 | 74 | 72 | 71 | 70 | 77 | 80 | 78 | 81 | 81 | 78 | 77 | 76 |
| Source: China Meteorological Data Service Center | |||||||||||||
External links
This article is issued from
Wikipedia.
The text is licensed under Creative Commons - Attribution - Sharealike.
Additional terms may apply for the media files.