Jinchuan County
| Jinchuan County 金川县 • ཆུ་ཆེན་རྫོང་། | |
|---|---|
| County | |
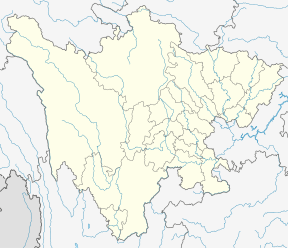 Jinchuan Location in Sichuan | |
| Coordinates: 31°28′34″N 102°03′50″E / 31.476°N 102.064°ECoordinates: 31°28′34″N 102°03′50″E / 31.476°N 102.064°E | |
| Country | People's Republic of China |
| Province | Sichuan |
| Autonomous prefecture | Ngawa Tibetan and Qiang Autonomous Prefecture |
| Time zone | UTC+8 (China Standard) |
| Jinchuan County | |||||||||||
| Chinese name | |||||||||||
|---|---|---|---|---|---|---|---|---|---|---|---|
| Simplified Chinese | 金川县 | ||||||||||
| Traditional Chinese | 金川縣 | ||||||||||
| |||||||||||
| Tibetan name | |||||||||||
| Tibetan | ཆུ་ཆེན་རྫོང་། | ||||||||||
| |||||||||||
Jinchuan County (Tibetan: Chuchen) is a county in the northwest of Sichuan Province, China. It is under the administration of the Ngawa Tibetan and Qiang Autonomous Prefecture. The seat of county is Jinchuan Town (Rabden). Jinchuan is known in China for its violent 18th century uprisings that were suppressed by the Qing dynasty.
Climate
| Climate data for Jinchuan (1981−2010) | |||||||||||||
|---|---|---|---|---|---|---|---|---|---|---|---|---|---|
| Month | Jan | Feb | Mar | Apr | May | Jun | Jul | Aug | Sep | Oct | Nov | Dec | Year |
| Record high °C (°F) | 20.7 (69.3) |
27.8 (82) |
30.9 (87.6) |
35.0 (95) |
38.7 (101.7) |
36.6 (97.9) |
38.1 (100.6) |
38.0 (100.4) |
35.9 (96.6) |
33.3 (91.9) |
24.8 (76.6) |
18.5 (65.3) |
38.7 (101.7) |
| Average high °C (°F) | 11.8 (53.2) |
15.8 (60.4) |
20.1 (68.2) |
23.4 (74.1) |
25.7 (78.3) |
26.6 (79.9) |
28.3 (82.9) |
28.3 (82.9) |
25.0 (77) |
21.2 (70.2) |
16.6 (61.9) |
12.0 (53.6) |
21.2 (70.2) |
| Daily mean °C (°F) | 2.6 (36.7) |
6.7 (44.1) |
10.8 (51.4) |
14.1 (57.4) |
16.7 (62.1) |
18.5 (65.3) |
19.9 (67.8) |
19.7 (67.5) |
16.8 (62.2) |
12.8 (55) |
7.1 (44.8) |
2.6 (36.7) |
12.4 (54.3) |
| Average low °C (°F) | −3.5 (25.7) |
0.0 (32) |
4.1 (39.4) |
7.4 (45.3) |
10.6 (51.1) |
13.6 (56.5) |
15.0 (59) |
14.8 (58.6) |
12.5 (54.5) |
8.2 (46.8) |
1.4 (34.5) |
−3.3 (26.1) |
6.7 (44.1) |
| Record low °C (°F) | −9.7 (14.5) |
−6.9 (19.6) |
−5.7 (21.7) |
0.3 (32.5) |
2.1 (35.8) |
5.9 (42.6) |
8.0 (46.4) |
7.2 (45) |
5.2 (41.4) |
−1.2 (29.8) |
−6.1 (21) |
−10.7 (12.7) |
−10.7 (12.7) |
| Average precipitation mm (inches) | 1.7 (0.067) |
6.0 (0.236) |
16.7 (0.657) |
44.2 (1.74) |
94.6 (3.724) |
145.9 (5.744) |
120.3 (4.736) |
102.1 (4.02) |
119.6 (4.709) |
52.4 (2.063) |
8.6 (0.339) |
1.3 (0.051) |
713.4 (28.086) |
| Average relative humidity (%) | 49 | 45 | 47 | 53 | 61 | 72 | 73 | 72 | 76 | 73 | 63 | 55 | 62 |
| Source: China Meteorological Data Service Center | |||||||||||||
This article is issued from
Wikipedia.
The text is licensed under Creative Commons - Attribution - Sharealike.
Additional terms may apply for the media files.