California's 4th congressional district
| California's 4th congressional district | |
|---|---|
.tif.png) California's 4th congressional district - since January 3, 2013. | |
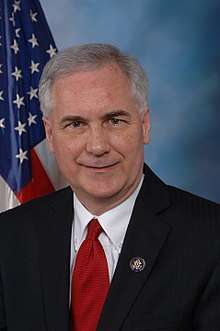
| Current Representative | Tom McClintock (R–Elk Grove) |
| Population (2015) | 722,313 [1] |
| Ethnicity | |
| Cook PVI | R+10[3] |
California's 4th congressional district is a congressional district in the U.S. state of California.
Tom McClintock, a Republican, has represented the district since January 2009.
Currently, the 4th district encompasses the Sierra from Truckee to the Sequoia National Forest. It consists of Alpine, Amador, Calaveras, El Dorado, Mariposa, and Tuolumne counties plus portions of Fresno, Madera, Nevada, and Placer counties.[4]
Prior to redistricting by the California Citizens Redistricting Commission of 2011, the 4th district encompassed the northeast corner of the state, stretching from the eastern suburbs of Sacramento north to the Oregon border. It consisted of El Dorado, Lassen, Modoc, Nevada, Placer, Plumas, and Sierra counties plus portions of Butte and Sacramento counties.
Competitiveness
George W. Bush won the district in 2004 with 61.3% of the vote. John McCain carried the district in 2008 with 53.98% of the vote while Barack Obama received 43.83%.
As of 2006, Republicans had 48 percent of voter registrations, Democrats had 30 percent, and Libertarians had roughly 5 percent.[5]
A Democratic congressional candidate nearly won the district in 2008, losing by only half a percentage point and less than 1,600 votes, indicating that the district was much more competitive than it appeared to be. But in the more recent [6] 2012 and 2014 elections the Republican candidate won over 60% of the vote indicating the District remains solidly Republican.
New district boundaries for the 2012 elections shifted the population center to the south and east. Registered Democrats and Independents/Decline to State voters in the new district area outnumber registered Republicans by 12%. However Republicans, Independents/Decline to State and small third parties outnumber Democrats well over a 2 to 1 ratio. There are 183,800 Republicans, 117,300 Democrats and 97,200 other.[7]
Election results from statewide races
| Election results from statewide races | ||
|---|---|---|
| Year | Office | Results |
| 1992 | President | Bush (R) 40.7 - 33.9% |
| Senator | Herschensohn (R) 50.0 - 39.7% | |
| Senator | Feinstein (D) 46.0 - 45.2% | |
| 1994 | Governor | Wilson (R) 66.4 - 29.0% |
| Senator | ||
| 1996 | President | Dole (R) 51.3 - 37.8% |
| 1998 | Governor | |
| Senator | ||
| 2000 | President[8] | Bush (R) 58.1 - 36.9% |
| Senator[9] | Campbell (R) 51.1 - 41.8% | |
| 2002 | Governor[10] | Simon (R) 58.5 - 30.6% |
| 2003 | Recall[11][12] | |
| Schwarzenegger (R) 60.6 - 17.6% | ||
| 2004 | President[13] | Bush (R) 61.3 - 37.4% |
| Senator[14] | Jones (R) 55.6 - 40.1% | |
| 2006 | Governor[15] | Schwarzenegger (R) 72.2 - 22.8% |
| Senator[16] | Mountjoy (R) 50.2 - 44.3% | |
| 2008 | President[17] | McCain (R) 54.0 - 43.8% |
| 2010 | Governor[18] | Whitman (R) 55.3 - 39.3% |
| Senator[19] | Fiorina (R) 59.5 - 33.7% | |
| 2012 | President | Romney (R) 57.9 - 39.5% |
| Senator | Emken (R) 58.5 - 41.5% | |
| 2014 | Governor | Kashkari (R) 55.1 - 44.9% |
| 2016 | President | Trump (R) 54.0 - 39.3% |
| Senator | Harris (D) 63.3 - 36.7% | |
List of representatives
| Representative | Party | Dates | Notes | Counties |
|---|---|---|---|---|
| District created | March 4, 1873 | |||
 |
Republican | March 4, 1873 – March 3, 1875 | redistricted from the 1st district lost re-election |
Fresno, Inyo, Kern, Los Angeles, Mariposa, Merced, Mono, Monterey, San Bernardino, San Diego, San Luis Obispo, San Mateo, Santa Barbara, Santa Clara, Santa Cruz, Stanislaus, Tulare, Ventura |
 |
Democratic | March 4, 1875 – March 3, 1877 | Retired | |
 |
Republican | March 4, 1877 – February 7, 1878 | Wigginton contested election | |
|
Democratic | February 7, 1878 – March 3, 1879 | Retired | |
|
Republican | March 4, 1879 – March 3, 1883 | Retired | |
.jpg) |
Democratic | March 4, 1883 – March 3, 1885 | Retired | San Francisco |
 |
Republican | March 4, 1885 – March 3, 1891 | Retired | |
.jpg) |
Republican | March 4, 1891 – March 3, 1893 | Retired | |
 |
Democratic | March 4, 1893 – March 3, 1899 | Lost re-election | |
 |
Republican | March 4, 1899 – March 3, 1903 | Lost re-election | |
.jpg) |
Democratic-Union Labor | March 4, 1903 – March 3, 1905 | Lost re-election | |
|
Republican | March 4, 1905 – December 18, 1924 | Died | |
| Vacant | December 18, 1924 – February 17, 1925 | |||
 |
Republican | February 17, 1925 – January 3, 1937 | Lost re-election | |
.jpg) |
Progressive | January 3, 1937 – January 3, 1939 | Lost re-election | |
| Democratic | January 3, 1939 – January 3, 1941 | |||
.jpg) |
Republican | January 3, 1941 – January 3, 1945 | Lost re-election | |
|
Democratic | January 3, 1945 – January 3, 1953 | Lost re-election | |
 |
Republican | January 3, 1953 – January 3, 1963 | Redistricted to the 6th district | |
 |
Democratic | January 3, 1963 – January 3, 1967 | Retired | Colusa, Glenn, Lake, Solano, Sutter, Yolo, Yuba |
| January 3, 1967 – January 3, 1973 | Colusa, Glenn, Lake, Sacramento (outside the city), Solano, Sutter, Yolo, Yuba | |||
| January 3, 1973 – January 3, 1975 | Colusa, Glenn, Solano, southwestern Sacramento, Sutter, Yolo, Yuba | |||
| January 3, 1975 – January 3, 1979 | Colusa, western Sacramento, Solano, Sutter, Yolo | |||
 |
Democratic | January 3, 1979 – January 3, 1983 | ||
| January 3, 1983 – January 3, 1993 | Redistricted to the 3rd district | Sacramento (outside the city), Solano, Yolo | ||
 |
Republican | January 3, 1993 – January 3, 2003 | Redistricted from the 14th district | Alpine, Amador, Calaveras, El Dorado, Mono, Placer, northeastern Sacramento, Tuolumne |
| January 3, 2003 – January 3, 2009 | Retired | Eastern Butte, El Dorado, Lassen, Modoc, Nevada, Placer, Plumas, Sacramento (Orangevale), Sierra | ||
 |
Republican | January 3, 2009 – January 3, 2013 | ||
| January 3, 2013 – present | Eastern central California including Lake Tahoe, Roseville, and Yosemite National Park | |||
Election results for representatives
|
1872 • 1874 • 1876 • 1878 • 1880 • 1882 • 1884 • 1886 • 1888 • 1890 • 1892 • 1894 • 1896 • 1898 • 1900 • 1902 • 1904 • 1906 • 1908 • 1910 • 1912 • 1914 • 1916 • 1918 • 1920 • 1922 • 1924 • 1926 • 1928 • 1930 • 1932 • 1934 • 1936 • 1938 • 1940 • 1942 • 1944 • 1946 • 1948 • 1950 • 1952 • 1954 • 1956 • 1958 • 1960 • 1962 • 1964 • 1966 • 1968 • 1970 • 1972 • 1974 • 1976 • 1978 • 1980 • 1982 • 1984 • 1986 • 1988 • 1990 • 1992 • 1994 • 1996 • 1998 • 2000 • 2002 • 2004 • 2006 • 2008 • 2010 • 2012 • 2014 • 2016 |
1872
| Party | Candidate | Votes | % | |
|---|---|---|---|---|
| Republican | Sherman Otis Houghton (inc.) | 10,391 | 53.5 | |
| Democratic | Edward J. Kewen | 9,012 | 46.5 | |
| Total votes | 19,403 | 100.0 | ||
| Turnout | ||||
| Republican hold | ||||
1874
| Party | Candidate | Votes | % | |||
|---|---|---|---|---|---|---|
| Democratic | Peter D. Wigginton | 15,649 | 48.8 | |||
| Republican | Sherman Otis Houghton (inc.) | 11,090 | 34.6 | |||
| Independent | J. S. Thompson | 5,343 | 16.7 | |||
| Total votes | 32,082 | 100.0 | ||||
| Turnout | ||||||
| Democratic gain from Republican | ||||||
1876
| Party | Candidate | Votes | % | |||
|---|---|---|---|---|---|---|
| Republican | Romualdo Pacheco | 19,104 | 50.0 | |||
| Democratic | Peter D. Wigginton (inc.) | 19,103 | 50.0 | |||
| Total votes | 38,207 | 100.0 | ||||
| Turnout | ||||||
| Republican gain from Democratic | ||||||
1878
| Party | Candidate | Votes | % | |
|---|---|---|---|---|
| Republican | Romualdo Pacheco | 15,391 | 40.5 | |
| Democratic | Wallace A. Leach | 12,109 | 31.8 | |
| Workingman's | James J. Ayres [20] | 10,527 | 27.7 | |
| Total votes | 38,027 | 100.0 | ||
| Turnout | ||||
| Republican hold | ||||
1880
| Party | Candidate | Votes | % | |
|---|---|---|---|---|
| Republican | Romualdo Pacheco (inc.) | 17,768 | 45.8 | |
| Democratic | Wallace A. Leach | 17,577 | 45.3 | |
| Greenback | J. F. Godfrey | 3,435 | 8.9 | |
| Total votes | 38,780 | 100.0 | ||
| Turnout | ||||
| Republican hold | ||||
1882
| Party | Candidate | Votes | % | |||
|---|---|---|---|---|---|---|
| Democratic | Pleasant B. Tully | 23,105 | 54.4 | |||
| Republican | George Lemuel Woods | 18,387 | 43.3 | |||
| Populist | M. V. Wright | 650 | 1.5 | |||
| Prohibition | Isaac Kinley | 355 | 0.8 | |||
| Total votes | 42,497 | 100.0 | ||||
| Turnout | ||||||
| Democratic gain from Republican | ||||||
1884
| Party | Candidate | Votes | % | |||
|---|---|---|---|---|---|---|
| Republican | William W. Morrow | 15,083 | 58.8 | |||
| Democratic | R. P. Hastings | 10,422 | 40.6 | |||
| Populist | H. S. Fitch | 123 | 0.5 | |||
| Prohibition | George Babcock | 15 | 0.1 | |||
| Total votes | 25,643 | 100.0 | ||||
| Turnout | ||||||
| Republican gain from Democratic | ||||||
1886
| Party | Candidate | Votes | % | |
|---|---|---|---|---|
| Republican | William W. Morrow (inc.) | 11,413 | 48.6 | |
| Democratic | Frank McCoppin | 9,854 | 42.0 | |
| Independent | Charles Allen Sumner | 2,104 | 9.0 | |
| Prohibition | Robert Thompson | 84 | 0.4 | |
| Total votes | 23,455 | 100.0 | ||
| Turnout | ||||
| Republican hold | ||||
1888
| Party | Candidate | Votes | % | |
|---|---|---|---|---|
| Republican | William W. Morrow (inc.) | 14,217 | 50.8 | |
| Democratic | Robert Ferral | 13,624 | 48.6 | |
| Socialist | Frank M. Pixley | 173 | 0.6 | |
| Total votes | 28,014 | 100.0 | ||
| Turnout | ||||
| Republican hold | ||||
1890
| Party | Candidate | Votes | % | |
|---|---|---|---|---|
| Republican | John Tyler Cutting | 13,196 | 49.2 | |
| Democratic | Robert Ferral | 12,091 | 45.1 | |
| Socialist | Thomas V. Cator | 1,492 | 5.6 | |
| Prohibition | Joseph Rowell | 50 | 0.2 | |
| Total votes | 26,829 | 100.0 | ||
| Turnout | ||||
| Republican hold | ||||
1892
| Party | Candidate | Votes | % | |||
|---|---|---|---|---|---|---|
| Democratic | James G. Maguire | 14,997 | 49.2 | |||
| Republican | Charles O. Alexander | 13,226 | 43.4 | |||
| Populist | Edgar P. Burman | 1,980 | 6.5 | |||
| Prohibition | Henry Collins | 296 | 1.0 | |||
| Total votes | 30,499 | 100.0 | ||||
| Turnout | ||||||
| Democratic gain from Republican | ||||||
1894
| Party | Candidate | Votes | % | |
|---|---|---|---|---|
| Democratic | James G. Maguire (inc.) | 14,748 | 48.3 | |
| Republican | Thomas B. Shannon | 9,785 | 32.0 | |
| Populist | B. K. Collier | 5,627 | 18.4 | |
| Prohibition | Joseph Rowell | 388 | 1.3 | |
| Total votes | 30,548 | 100.0 | ||
| Turnout | ||||
| Democratic hold | ||||
1896
| Party | Candidate | Votes | % | |
|---|---|---|---|---|
| Democratic | James G. Maguire (inc.) | 19,074 | 61.0 | |
| Republican | Thomas B. O'Brien | 10,940 | 35.0 | |
| Socialist Labor | E. T. Kingsley | 968 | 3.0 | |
| Prohibition | Joseph Rowell | 299 | 1.0 | |
| Total votes | 31,281 | 100.0 | ||
| Turnout | ||||
| Democratic hold | ||||
1898
| Party | Candidate | Votes | % | |||
|---|---|---|---|---|---|---|
| Republican | Julius Kahn | 13,695 | 50.0 | |||
| Democratic | James H. Barry | 12,084 | 44.1 | |||
| Socialist Labor | W. J. Martin | 1,006 | 3.7 | |||
| Independent | Joseph P. Kelly | 594 | 2.2 | |||
| Total votes | 27,379 | 100.0 | ||||
| Turnout | ||||||
| Republican gain from Democratic | ||||||
1900
| Party | Candidate | Votes | % | |
|---|---|---|---|---|
| Republican | Julius Kahn (incumbent) | 17,111 | 55.2 | |
| Democratic | R. Porter Ashe | 11,742 | 37.8 | |
| Independent | C. C. O'Donnell | 1,116 | 3.6 | |
| Socialist | G. B. Benham | 969 | 3.1 | |
| Prohibition | Joseph Rowell | 84 | 0.3 | |
| Total votes | 31,022 | 100.0 | ||
| Turnout | ||||
| Republican hold | ||||
1902
| Party | Candidate | Votes | % | |||
|---|---|---|---|---|---|---|
| Democratic | Edward J. Livernash | 16,146 | 49.2 | |||
| Republican | Julius Kahn (incumbent) | 16,005 | 48.7 | |||
| Socialist | William Costley | 616 | 1.9 | |||
| Prohibition | Joseph Rowell | 69 | 0.2 | |||
| Total votes | 16,836 | 100.0 | ||||
| Turnout | ||||||
| Democratic gain from Republican | ||||||
1904
| Party | Candidate | Votes | % | |||
|---|---|---|---|---|---|---|
| Republican | Julius Kahn | 20,012 | 57.0 | |||
| Democratic | Edward J. Livernash (inc.) | 12,812 | 36.4 | |||
| Socialist | William Costley | 2,267 | 6.4 | |||
| Total votes | 35,091 | 100.0 | ||||
| Turnout | ||||||
| Republican gain from Democratic | ||||||
1906
| Party | Candidate | Votes | % | |
|---|---|---|---|---|
| Republican | Julius Kahn (incumbent) | 5,678 | 62.4 | |
| Democratic | David S. Hirshberg | 3,016 | 33.2 | |
| Socialist | Oliver Everett | 399 | 4.4 | |
| Total votes | 9,093 | 100.0 | ||
| Turnout | ||||
| Republican hold | ||||
1908
| Party | Candidate | Votes | % | |
|---|---|---|---|---|
| Republican | Julius Kahn (incumbent) | 9,202 | 52.7 | |
| Democratic | James G. Maguire | 7,497 | 42.9 | |
| Socialist | K. J. Doyle | 699 | 4.0 | |
| Prohibition | William N. Meserve | 60 | 0.3 | |
| Total votes | 17,458 | 100.0 | ||
| Turnout | ||||
| Republican hold | ||||
1910
| Party | Candidate | Votes | % | |
|---|---|---|---|---|
| Republican | Julius Kahn (incumbent) | 10,188 | 56.5 | |
| Democratic | Walter MacArthur | 6,636 | 36.8 | |
| Socialist | Austin Lewis | 1,178 | 6.5 | |
| Prohibition | E. F. Dinsmore | 35 | 0.2 | |
| Total votes | 18,037 | 100.0 | ||
| Turnout | ||||
| Republican hold | ||||
1912
| Party | Candidate | Votes | % | |
|---|---|---|---|---|
| Republican | Julius Kahn (incumbent) | 25,515 | 56.1 | |
| Democratic | Bert Schlesinger | 14,884 | 32.7 | |
| Socialist | Norman W. Pendleton | 5,090 | 11.2 | |
| Total votes | 45,489 | 100.0 | ||
| Turnout | ||||
| Republican hold | ||||
1914
| Party | Candidate | Votes | % | |
|---|---|---|---|---|
| Republican | Julius Kahn (incumbent) | 41,044 | 69.1 | |
| Democratic | Henry Colombat | 13,550 | 22.8 | |
| Socialist | Allen K. Gifford | 3,928 | 6.6 | |
| Prohibition | J. C. Westenberg | 895 | 1.5 | |
| Total votes | 59,417 | 100.0 | ||
| Turnout | ||||
| Republican hold | ||||
1916
| Party | Candidate | Votes | % | |
|---|---|---|---|---|
| Republican | Julius Kahn (incumbent) | 51,968 | 77.2 | |
| Democratic | J. M. Fernald | 10,579 | 15.7 | |
| Socialist | Allen K. Gifford | 3,775 | 5.6 | |
| Prohibition | Henry W. Hutchinson | 981 | 1.5 | |
| Total votes | 67,303 | 100.0 | ||
| Turnout | ||||
| Republican hold | ||||
1918
| Party | Candidate | Votes | % | |
|---|---|---|---|---|
| Republican | Julius Kahn (incumbent) | 38,278 | 86.6 | |
| Socialist | Hugo Ernst | 5,913 | 13.4 | |
| Total votes | 43,191 | 100.0 | ||
| Turnout | ||||
| Republican hold | ||||
1920
| Party | Candidate | Votes | % | |
|---|---|---|---|---|
| Republican | Julius Kahn (incumbent) | 50,841 | 84.6 | |
| Socialist | Hugo Ernst | 9,289 | 15.4 | |
| Total votes | 60,130 | 100.0 | ||
| Turnout | ||||
| Republican hold | ||||
1922
| Party | Candidate | Votes | % | |
|---|---|---|---|---|
| Republican | Julius Kahn (incumbent) | 46,527 | 83 | |
| Socialist | Hugo Ernst | 9,547 | 17 | |
| Total votes | 56,074 | 100 | ||
| Turnout | ||||
| Republican hold | ||||
1924
| Party | Candidate | Votes | % | |
|---|---|---|---|---|
| Republican | Julius Kahn (incumbent) | 44,048 | 81 | |
| Socialist | William McDevitt | 10,360 | 19 | |
| Total votes | 54,408 | 100 | ||
| Turnout | ||||
| Republican hold | ||||
1926
| Party | Candidate | Votes | % | |
|---|---|---|---|---|
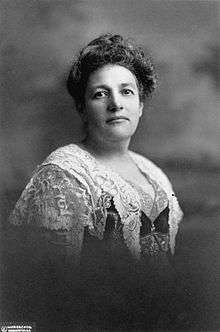
| Republican | Florence Prag Kahn (inc.) | 37,353 | 63.4 | |
| Democratic | Chauncey F. Tramutulo | 18,210 | 32.5 | |
| Socialist | Harry W. Hutton | 2,960 | 5.1 | |
| Total votes | 58,523 | 100.0 | ||
| Turnout | ||||
| Republican hold | ||||
1928
| Party | Candidate | Votes | % | |
|---|---|---|---|---|
| Republican | Florence Prag Kahn (inc.) | 50,206 | 76 | |
| Independent | Harry W. Hutton | 16,838 | 24 | |
| Total votes | 67,044 | 100 | ||
| Turnout | ||||
| Republican hold | ||||
1930
| Party | Candidate | Votes | % | |
|---|---|---|---|---|
| Republican | Florence Prag Kahn (inc.) | 47,397 | 100.0 | |
| Turnout | ||||
| Republican hold | ||||
1932
| Party | Candidate | Votes | % | |
|---|---|---|---|---|
| Republican | Florence Prag Kahn (inc.) | 67,425 | 85.3 | |
| Socialist | Milen C. Dempster | 11,603 | 14.7 | |
| Total votes | 79,028 | 100.0 | ||
| Turnout | ||||
| Republican hold | ||||
1934
| Party | Candidate | Votes | % | |
|---|---|---|---|---|
| Republican | Florence Prag Kahn (inc.) | 50,491 | 48.0 | |
| Democratic | Chauncey Tramutolo | 46,871 | 44.5 | |
| Progressive | Raymond A. Burr | 3,636 | 3.5 | |
| Socialist | Samuel S. White | 2,414 | 2.3 | |
| Communist | Minnie Carson | 1,810 | 1.7 | |
| Total votes | 105,222 | 100.0 | ||
| Turnout | ||||
| Republican hold | ||||
1936
| Party | Candidate | Votes | % | |||
|---|---|---|---|---|---|---|
| Progressive | Franck R. Havenner | 64,063 | 58.5 | |||
| Republican | Florence Prag Kahn (inc.) | 43,805 | 40.0 | |||
| Communist | Anita Whitney | 1,711 | 1.5 | |||
| Total votes | 109,579 | 100.0 | ||||
| Turnout | ||||||
| Progressive gain from Republican | ||||||
1938
| Party | Candidate | Votes | % | |
|---|---|---|---|---|
| Democratic | Franck R. Havenner (inc.) | 64,452 | 61.2 | |
| Republican | Kennett B. Dawson | 40,842 | 38.8 | |
| Total votes | 105,294 | 100.0 | ||
| Turnout | ||||
| Democratic hold | ||||
1940
| Party | Candidate | Votes | % | |||
|---|---|---|---|---|---|---|
| Republican | Thomas Rolph | 75,369 | 54.6 | |||
| Democratic | Franck R. Havenner (inc.) | 61,341 | 44.4 | |||
| Communist | Archie Brown | 1,322 | 1.0 | |||
| Total votes | 138,032 | 100.0 | ||||
| Turnout | ||||||
| Republican gain from Democratic | ||||||
1942
| Party | Candidate | Votes | % | |
|---|---|---|---|---|
| Republican | Thomas Rolph (incumbent) | 62,735 | 98.3 | |
| Communist | Archie Brown (write-in) | 1,116 | 1.7 | |
| Total votes | 63,851 | 100.0 | ||
| Turnout | ||||
| Republican hold | ||||
1944
| Party | Candidate | Votes | % | |||
|---|---|---|---|---|---|---|
| Democratic | Franck R. Havenner | 73,582 | 50.1 | |||
| Republican | Thomas Rolph (incumbent) | 73,367 | 49.9 | |||
| Total votes | 146,949 | 100.0 | ||||
| Turnout | ||||||
| Democratic gain from Republican | ||||||
1946
| Party | Candidate | Votes | % | |
|---|---|---|---|---|
| Democratic | Franck R. Havenner (inc.) | 60,655 | 52.9 | |
| Republican | Truman R. Young | 54,113 | 47.1 | |
| Total votes | 114,768 | 100.0 | ||
| Turnout | ||||
| Democratic hold | ||||
1948
| Party | Candidate | Votes | % | |
|---|---|---|---|---|
| Democratic | Franck R. Havenner (inc.) | 73,704 | 51.0 | |
| Republican | William S. Mailliard | 68,875 | 47.7 | |
| Progressive | Francis J. McTernan, Jr. | 1,949 | 1.3 | |
| Total votes | 144,528 | 100.0 | ||
| Turnout | ||||
| Democratic hold | ||||
1950
| Party | Candidate | Votes | % | |
|---|---|---|---|---|
| Democratic | Franck R. Havenner (inc.) | 83,078 | 67.2 | |
| Republican | Raymond D. Smith | 40,569 | 32.8 | |
| Total votes | 123,647 | 100.0 | ||
| Turnout | ||||
| Democratic hold | ||||
1952
| Party | Candidate | Votes | % | |||
|---|---|---|---|---|---|---|
| Republican | William S. Mailliard | 102,359 | 55 | |||
| Democratic | Franck R. Havenner (inc.) | 83,748 | 45 | |||
| Total votes | 186,107 | 100 | ||||
| Turnout | ||||||
| Republican gain from Democratic | ||||||
1954
| Party | Candidate | Votes | % | |
|---|---|---|---|---|
| Republican | William S. Mailliard (inc.) | 88,439 | 61.2 | |
| Democratic | Philip A. O'Rourke | 52,980 | 36.7 | |
| Progressive | George R. Andersen | 2,987 | 2.1 | |
| Total votes | 144,406 | 100.0 | ||
| Turnout | ||||
| Republican hold | ||||
1956
| Party | Candidate | Votes | % | |
|---|---|---|---|---|
| Republican | William S. Mailliard (inc.) | 109,188 | 61.9 | |
| Democratic | James L. Quigley | 67,132 | 38.1 | |
| Total votes | 176,320 | 100.0 | ||
| Turnout | ||||
| Republican hold | ||||
1958
| Party | Candidate | Votes | % | |
|---|---|---|---|---|
| Republican | William S. Mailliard (inc.) | 98,574 | 63.9 | |
| Democratic | George D. Collins, Jr. | 65,798 | 36.1 | |
| Total votes | 164,372 | 100.0 | ||
| Turnout | ||||
| Republican hold | ||||
1960
| Party | Candidate | Votes | % | |
|---|---|---|---|---|
| Republican | William S. Mailliard (inc.) | 118,249 | 65.3 | |
| Democratic | Phillips S. Davies | 62,814 | 34.7 | |
| Total votes | 181,063 | 100.0 | ||
| Turnout | ||||
| Republican hold | ||||
1962
| Party | Candidate | Votes | % | ||
|---|---|---|---|---|---|
| Democratic | Robert L. Leggett | 55,563 | 56.5 | ||
| Republican | L. V. Honsinger | 42,762 | 43.5 | ||
| Total votes | 98,325 | 100.0 | |||
| Turnout | |||||
| Democratic win (new seat) | |||||
1964
| Party | Candidate | Votes | % | |
|---|---|---|---|---|
| Democratic | Robert L. Leggett (incumbent) | 84,949 | 71.9 | |
| Republican | Ivan Norris | 33,160 | 28.1 | |
| Total votes | 118,109 | 100.0 | ||
| Turnout | ||||
| Democratic hold | ||||
1966
| Party | Candidate | Votes | % | |
|---|---|---|---|---|
| Democratic | Robert L. Leggett (incumbent) | 67,942 | 60 | |
| Republican | Tom McHatton | 46,337 | 40 | |
| Total votes | 114,279 | 100.0 | ||
| Turnout | ||||
| Democratic hold | ||||
1968
| Party | Candidate | Votes | % | |
|---|---|---|---|---|
| Democratic | Robert L. Leggett (incumbent) | 88,067 | 55.5 | |
| Republican | James Shumway | 65,942 | 41.6 | |
| American Independent | Gene Clark | 4,545 | 2.9 | |
| Total votes | 158,554 | 100.0 | ||
| Turnout | ||||
| Democratic hold | ||||
1970
| Party | Candidate | Votes | % | |
|---|---|---|---|---|
| Democratic | Robert L. Leggett (incumbent) | 103,485 | 68 | |
| Republican | Andrew Gyorke | 48,783 | 32 | |
| Total votes | 152,268 | 100 | ||
| Turnout | ||||
| Democratic hold | ||||
1972
| Party | Candidate | Votes | % | |
|---|---|---|---|---|
| Democratic | Robert L. Leggett (incumbent) | 114,673 | 67.4 | |
| Republican | Benjamin Chang | 55,367 | 32.6 | |
| Total votes | 170,040 | 100.0 | ||
| Turnout | ||||
| Democratic hold | ||||
1974
| Party | Candidate | Votes | % | |
|---|---|---|---|---|
| Democratic | Robert L. Leggett (incumbent) | 100,934 | 100.0 | |
| Turnout | ||||
| Democratic hold | ||||
1976
| Party | Candidate | Votes | % | |
|---|---|---|---|---|
| Democratic | Robert L. Leggett (incumbent) | 75,844 | 50.2 | |
| Republican | Rex Hime | 75,193 | 49.8 | |
| Total votes | 151,037 | 100.0 | ||
| Turnout | ||||
| Democratic hold | ||||
1978
| Party | Candidate | Votes | % | |
|---|---|---|---|---|
| Democratic | Vic Fazio | 87,764 | 55.4 | |
| Republican | Rex Hime | 70,733 | 44.6 | |
| Total votes | 158,497 | 100.0 | ||
| Turnout | ||||
| Democratic hold | ||||
1980
| Party | Candidate | Votes | % | |
|---|---|---|---|---|
| Democratic | Vic Fazio (incumbent) | 133,853 | 65.3 | |
| Republican | Albert Dehr | 60,935 | 29.7 | |
| Libertarian | Robert J. Burnside | 10,267 | 5.0 | |
| Total votes | 205,055 | 100.0 | ||
| Turnout | ||||
| Democratic hold | ||||
1982
| Party | Candidate | Votes | % | |
|---|---|---|---|---|
| Democratic | Vic Fazio (incumbent) | 118,476 | 63.9 | |
| Republican | Roger B. Canfield | 67,047 | 36.1 | |
| Total votes | 185,523 | 100.0 | ||
| Turnout | ||||
| Democratic hold | ||||
1984
| Party | Candidate | Votes | % | |
|---|---|---|---|---|
| Democratic | Vic Fazio (incumbent) | 130,109 | 61.4 | |
| Republican | Roger B. Canfield | 77,773 | 36.7 | |
| Libertarian | Roger Conant Pope | 4,039 | 1.9 | |
| Total votes | 211,921 | 100.0 | ||
| Turnout | ||||
| Democratic hold | ||||
1986
| Party | Candidate | Votes | % | |
|---|---|---|---|---|
| Democratic | Vic Fazio (incumbent) | 128,364 | 70.2 | |
| Republican | Jack D. Hite | 54,596 | 29.8 | |
| Total votes | 182,960 | 100.0 | ||
| Turnout | ||||
| Democratic hold | ||||
1988
| Party | Candidate | Votes | % | |
|---|---|---|---|---|
| Democratic | Vic Fazio (incumbent) | 181,184 | 100.0 | |
| No party | Write-ins | 1,306 | 0.0% | |
| Turnout | ||||
| Democratic hold | ||||
1990
| Party | Candidate | Votes | % | |
|---|---|---|---|---|
| Democratic | Vic Fazio (incumbent) | 115,090 | 54.7 | |
| Republican | Mark R. Baughman | 82,738 | 39.3 | |
| Libertarian | Bryce Bigwood | 12,626 | 6.0 | |
| Total votes | 210,454 | 100.0 | ||
| Turnout | ||||
| Democratic hold | ||||
1992
| Party | Candidate | Votes | % | |
|---|---|---|---|---|
| Republican | John Doolittle (incumbent) | 141,155 | 49.8 | |
| Democratic | Patricia Malberg | 129,489 | 45.7 | |
| Libertarian | Patrick Lee McHargue | 12,705 | 4.5 | |
| No party | Brooksher (write-in) | 16 | 0.0% | |
| Total votes | 283,265 | 100.0 | ||
| Turnout | ||||
| Republican hold | ||||
1994
| Party | Candidate | Votes | % | |
|---|---|---|---|---|
| Republican | John Doolittle (incumbent) | 144,936 | 61.33 | |
| Democratic | Katie Hirning | 82,505 | 34.91 | |
| Libertarian | Damon S. Falconi | 8,882 | 3.76 | |
| Total votes | 236,323 | 100.0 | ||
| Turnout | ||||
| Republican hold | ||||
1996
| Party | Candidate | Votes | % | |
|---|---|---|---|---|
| Republican | John Doolittle (incumbent) | 164,048 | 60.5 | |
| Democratic | Katie Hirning | 97,948 | 36.1 | |
| Libertarian | Patrick McHargue | 9,319 | 3.4 | |
| Total votes | 271,315 | 100.0 | ||
| Turnout | ||||
| Republican hold | ||||
1998
| Party | Candidate | Votes | % | |
|---|---|---|---|---|
| Republican | John Doolittle (incumbent) | 155,306 | 62.57 | |
| Democratic | David Shapiro | 85,394 | 34.40 | |
| Libertarian | Dan Winterrowd | 7,524 | 3.03 | |
| Total votes | 248,224 | 100.0 | ||
| Turnout | ||||
| Republican hold | ||||
2000
| Party | Candidate | Votes | % | |
|---|---|---|---|---|
| Republican | John Doolittle (incumbent) | 197,503 | 63.5 | |
| Democratic | Mark A. Norberg | 97,974 | 31.5 | |
| Libertarian | William Fritz Frey | 9,494 | 3.0 | |
| Natural Law | Robert E. Ray | 6,452 | 2.0 | |
| Total votes | 311,423 | 100.0 | ||
| Turnout | ||||
| Republican hold | ||||
2002
| Party | Candidate | Votes | % | |
|---|---|---|---|---|
| Republican | John Doolittle (incumbent) | 139,280 | 64.9 | |
| Democratic | Mark A. Norberg | 68,755 | 32.0 | |
| Libertarian | Allen M. Roberts | 6,834 | 3.1 | |
| Total votes | 214,869 | 100.0 | ||
| Turnout | ||||
| Republican hold | ||||
2004
| Party | Candidate | Votes | % | |
|---|---|---|---|---|
| Republican | John Doolittle (incumbent) | 221,926 | 65.4 | |
| Democratic | David I. Winters | 117,443 | 34.6 | |
| Total votes | 339,369 | 100.0 | ||
| Turnout | ||||
| Republican hold | ||||
2006
| Party | Candidate | Votes | % | |
|---|---|---|---|---|
| Republican | John Doolittle (incumbent) | 135,818 | 49.1 | |
| Democratic | Charlie Brown | 126,999 | 45.9 | |
| Libertarian | Dan Warren | 14,076 | 5.0 | |
| Total votes | 213,984 | 100.0 | ||
| Turnout | ||||
| Republican hold | ||||
2008
| Party | Candidate | Votes | % | |
|---|---|---|---|---|
| Republican | Tom McClintock | 184,543 | 50.3 | |
| Democratic | Charlie Brown | 182,967 | 49.7 | |
| Total votes | 367,510 | 100.0 | ||
| Turnout | ||||
| Republican hold | ||||
2010
| Party | Candidate | Votes | % | |
|---|---|---|---|---|
| Republican | Tom McClintock | 186,392 | 61% | |
| Democratic | Clint Curtis | 95,653 | 31% | |
| Green | Benjamin Emery | 22,179 | 8% | |
| Total votes | 304,224 | 100% | ||
| Turnout | ||||
| Republican hold | ||||
2012
| Party | Candidate | Votes | % | |
|---|---|---|---|---|
| Republican | Tom McClintock | 197,803 | 61% | |
| Democratic | Jack Uppal | 125,885 | 39% | |
| Total votes | 323,688 | 100% | ||
| Turnout | ||||
| Republican hold | ||||
2014
| Party | Candidate | Votes | % | |
|---|---|---|---|---|
| Republican | Tom McClintock | 126,784 | 60% | |
| Republican | Arthur "Art" Moore | 84,350 | 40% | |
| Total votes | 211,134 | 100% | ||
| Turnout | ||||
| Republican hold | ||||
2016
| Party | Candidate | Votes | % | |
|---|---|---|---|---|
| Republican | Tom McClintock | 220,133 | 63% | |
| Democratic | Robert W. Derlet | 130,845 | 37% | |
| Total votes | 350,978 | 100% | ||
| Turnout | ||||
| Republican hold | ||||
Historical district boundaries

2018 primary election
As of March 5, 2018, there are five Democratic candidates who have filed statements of candidacy with the Federal Election Commission (FEC) to contest the June 2018 primary.[69] They are, in alphabetical order by last name: Regina Bateson; Roza Calderon; Richard Martin; Jessica Morse; and Rochelle Wilcox. Martin and Wilcox[70] have since dropped out of the race. Wilcox[71] endorsed Morse in February.
Retired Air Force Lieutenant Colonel Charlie Brown, who was the Democratic nominee for this seat in 2006 and 2008, was "seriously considering" running in 2018,[72] but decided in June 2017 against a third campaign. In January 2018, Brown endorsed Morse for the nomination.[73] Bob Derlet,[74] the Democratic nominee in 2016, also endorsed Morse in January.
On the Republican side, McClintock has one challenger, Mitchell Kendrick White, who filed with the FEC in January.[75]
In February, the California Democratic Party endorsed[76] Jessica Morse for the Democratic Nomination. However, the California jungle primary system means that only the two candidates with the most votes on June 5, regardless of party, will go on to the general election on November 6. Both Republicans and four Democrats will appear on the jungle primary ballot.[76]
Living former Members
As of April 2015, there are two former members of the U.S. House of Representatives from California's 4th congressional district that are currently living.
| Representative | Term in office | Date of birth (and age) |
|---|---|---|
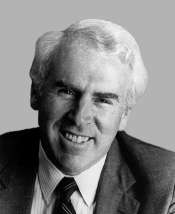
| Vic Fazio | 1979–1993 | October 11, 1942 |
| John Doolittle | 1993–1999 | October 30, 1950 |
See also
References
- ↑ Bureau, Center for New Media & Promotion (CNMP), US Census. "My Congressional District". www.census.gov. Archived from the original on 20 March 2018. Retrieved 7 May 2018.
- ↑ "California election results - 2012 election". Los Angeles Times. Archived from the original on February 5, 2013. Retrieved February 24, 2013.
- ↑ "Partisan Voting Index – Districts of the 115th Congress" (PDF). The Cook Political Report. April 7, 2017. Archived (PDF) from the original on June 7, 2017. Retrieved April 7, 2017.
- ↑ "Maps: Final Congressional Districts". Citizens Redistricting Commission. Archived from the original on March 10, 2013. Retrieved February 24, 2013.
- ↑ "Editorial: 4th Congressional District", The Sacramento Bee, May 10, 2006
- ↑ Ballotpedia
- ↑ Ballotpedia.org
- ↑ "Statement of Vote (2000 President)" (PDF). ca.gov. Archived from the original (PDF) on 20 May 2011. Retrieved 7 May 2018.
- ↑ "Statement of Vote (2000 Senator)" (PDF). ca.gov. Archived from the original (PDF) on 20 May 2011. Retrieved 7 May 2018.
- ↑ Statement of Vote (2002 Governor) Archived 2010-11-11 at the Wayback Machine.
- ↑ "Statement of Vote (2003 Recall Question)" (PDF). ca.gov. Archived from the original (PDF) on 20 May 2011. Retrieved 7 May 2018.
- ↑ "Statement of Vote (2003 Governor)" (PDF). ca.gov. Archived from the original (PDF) on 20 May 2011. Retrieved 7 May 2018.
- ↑ "Statement of Vote (2004 President)" (PDF). ca.gov. Archived from the original (PDF) on 1 August 2010. Retrieved 7 May 2018.
- ↑ Statement of Vote (2004 Senator) Archived 2011-08-10 at the Wayback Machine.
- ↑ Statement of Vote (2006 Governor) Archived 2011-08-10 at the Wayback Machine.
- ↑ Statement of Vote (2006 Senator) Archived 2011-08-10 at the Wayback Machine.
- ↑ "(2008 President)". 2008racetracker.com. Archived from the original on 26 June 2009. Retrieved 7 May 2018.
- ↑ "Statement of Vote (2010 Governor)" (PDF). ca.gov. Archived from the original (PDF) on 20 May 2011. Retrieved 7 May 2018.
- ↑ "Statement of Vote (2010 Governor" (PDF). ca.gov. Archived from the original (PDF) on 20 May 2011. Retrieved 7 May 2018.
- ↑ "JoinCalifornia - James J. Ayers". www.joincalifornia.com. Archived from the original on 3 March 2016. Retrieved 7 May 2018.
- ↑ "1920 election results" (PDF). house.gov. Archived (PDF) from the original on 29 December 2011. Retrieved 7 May 2018.
- ↑ "1922 election results" (PDF). house.gov. Archived (PDF) from the original on 9 July 2014. Retrieved 7 May 2018.
- ↑ "1924 election results" (PDF). house.gov. Archived (PDF) from the original on 7 June 2016. Retrieved 7 May 2018.
- ↑ "1926 election results" (PDF). house.gov. Archived (PDF) from the original on 8 June 2016. Retrieved 7 May 2018.
- ↑ "1928 election results" (PDF). house.gov. Archived (PDF) from the original on 25 May 2017. Retrieved 7 May 2018.
- ↑ "1930 election results" (PDF). house.gov. Archived (PDF) from the original on 23 April 2012. Retrieved 7 May 2018.
- ↑ "1932 election results" (PDF). house.gov. Archived (PDF) from the original on 17 August 2008. Retrieved 7 May 2018.
- ↑ "1934 election results" (PDF). house.gov. Archived (PDF) from the original on 18 August 2008. Retrieved 7 May 2018.
- ↑ "1936 election results" (PDF). house.gov. Archived (PDF) from the original on 20 August 2008. Retrieved 7 May 2018.
- ↑ "1938 election results" (PDF). house.gov. Archived (PDF) from the original on 19 August 2008. Retrieved 7 May 2018.
- ↑ "1940 election results" (PDF). house.gov. Archived (PDF) from the original on 23 August 2008. Retrieved 7 May 2018.
- ↑ "1942 election results" (PDF). house.gov. Archived (PDF) from the original on 22 August 2008. Retrieved 7 May 2018.
- ↑ "1944 election results" (PDF). house.gov. Archived (PDF) from the original on 9 July 2014. Retrieved 7 May 2018.
- ↑ "1946 election results" (PDF). house.gov. Archived (PDF) from the original on 10 May 2013. Retrieved 7 May 2018.
- ↑ "1948 election results" (PDF). house.gov. Archived (PDF) from the original on 28 June 2011. Retrieved 7 May 2018.
- ↑ "1950 election results" (PDF). house.gov. Archived (PDF) from the original on 29 October 2013. Retrieved 7 May 2018.
- ↑ "1952 election results" (PDF). house.gov. Archived (PDF) from the original on 29 December 2011. Retrieved 7 May 2018.
- ↑ "1954 election results" (PDF). house.gov. Archived (PDF) from the original on 29 December 2011. Retrieved 7 May 2018.
- ↑ "1956 election results" (PDF). house.gov. Archived (PDF) from the original on 6 November 2011. Retrieved 7 May 2018.
- ↑ "1958 election results" (PDF). house.gov. Archived (PDF) from the original on 2 August 2010. Retrieved 7 May 2018.
- ↑ "1960 election results" (PDF). house.gov. Archived (PDF) from the original on 6 November 2011. Retrieved 7 May 2018.
- ↑ "1962 election results" (PDF). house.gov. Archived (PDF) from the original on 3 August 2010. Retrieved 7 May 2018.
- ↑ "1964 election results" (PDF). house.gov. Archived (PDF) from the original on 26 July 2011. Retrieved 7 May 2018.
- ↑ "1966 election results" (PDF). house.gov. Archived (PDF) from the original on 6 November 2011. Retrieved 7 May 2018.
- ↑ "1968 election results" (PDF). house.gov. Archived (PDF) from the original on 20 September 2011. Retrieved 7 May 2018.
- ↑ "1970 election results" (PDF). house.gov. Archived (PDF) from the original on 7 December 2014. Retrieved 7 May 2018.
- ↑ "1972 election results" (PDF). house.gov. Archived (PDF) from the original on 14 August 2011. Retrieved 7 May 2018.
- ↑ "1974 election results" (PDF). house.gov. Archived (PDF) from the original on 27 October 2011. Retrieved 7 May 2018.
- ↑ "1976 election results" (PDF). house.gov. Archived (PDF) from the original on 14 August 2011. Retrieved 7 May 2018.
- ↑ "1978 election results" (PDF). house.gov. Archived (PDF) from the original on 28 September 2011. Retrieved 7 May 2018.
- ↑ "1980 election results" (PDF). house.gov. Archived (PDF) from the original on 23 January 2017. Retrieved 7 May 2018.
- ↑ "1982 election results" (PDF). house.gov. Archived (PDF) from the original on 14 August 2011. Retrieved 7 May 2018.
- ↑ "1984 election results" (PDF). house.gov. Archived (PDF) from the original on 27 October 2011. Retrieved 7 May 2018.
- ↑ "1986 election results" (PDF). house.gov. Archived (PDF) from the original on 23 January 2017. Retrieved 7 May 2018.
- ↑ "1988 election results" (PDF). house.gov. Archived (PDF) from the original on 1 July 2011. Retrieved 7 May 2018.
- ↑ "1990 election results" (PDF). house.gov. Archived (PDF) from the original on 16 July 2011. Retrieved 7 May 2018.
- ↑ "1992 election results" (PDF). house.gov. Archived (PDF) from the original on 23 January 2017. Retrieved 7 May 2018.
- ↑ "1994 election results" (PDF). house.gov. Archived (PDF) from the original on 25 May 2017. Retrieved 7 May 2018.
- ↑ "1996 election results" (PDF). house.gov. Archived (PDF) from the original on 25 May 2017. Retrieved 7 May 2018.
- ↑ "1998 election results" (PDF). house.gov. Archived (PDF) from the original on 23 January 2017. Retrieved 7 May 2018.
- ↑ "2000 election results" (PDF). house.gov. Archived (PDF) from the original on 25 May 2017. Retrieved 7 May 2018.
- ↑ 2002 general election results Archived February 3, 2009, at the Wayback Machine.
- ↑ 2004 general election results Archived 2008-08-21 at the Wayback Machine.
- ↑ 2006 general election results Archived November 27, 2008, at the Wayback Machine.
- 1 2 "Archived copy". Archived from the original on 2008-11-26. Retrieved 2008-11-30.
- ↑ "Archived copy" (PDF). Archived (PDF) from the original on 2015-08-17. Retrieved 2015-12-31.
- ↑ "Archived copy" (PDF). Archived (PDF) from the original on 2016-03-04. Retrieved 2015-08-21.
- ↑ "Archived copy" (PDF). Archived (PDF) from the original on 2017-02-22. Retrieved 2017-03-03.
- ↑ "Federal Election Commission, Registered Candidates in California's Fourth Congressional District". Federal Election Commission. Retrieved July 27, 2017.
- ↑ "Rochelle Wilcox". Rochelle Wilcox. Archived from the original on 2018-01-19. Retrieved 2018-01-25.
- ↑ @Morse4America https://twitter.com/Morse4America/status/969295288740470785. Archived from the original on 2018-05-07. Retrieved 2018-01-12. Missing or empty
|title=(help) - ↑ Johnson, Doug (April 8, 2017). "Although Tough on Trump, McClintock Faces Backlash at Another Town Hall". KTXL. Archived from the original on April 11, 2017. Retrieved April 10, 2017.
- ↑ "I am thrilled & grateful to be endorsed by Charlie Brown, 2006 & 2008 Congressional Candidate for #CA04. From Charlie: "Jessica has the knowledge & experience to best represent the people in the 4th Congressional District." To read his full statement:". Archived from the original on 2018-05-07.
- ↑ Morse, Jessica (January 11, 2018). "We are so grateful to have the support of community leaders, such as Dr. Bob Derlet - the 2016 Democratic candidate for #CA04! "I am behind Jessica because she is a fighter. She will stand up for the people of this district & not back down." Thank you, Dr. Derlet! #JessWeCanpic.twitter.com/e5tv0OC6bk". @Morse4America. Archived from the original on May 7, 2018. Retrieved 2018-01-12.
- ↑ "PAGE BY PAGE REPORT DISPLAY FOR 201801199090468752 (Page 1 of 1)". docquery.fec.gov. Retrieved 2018-01-25.
- 1 2 http://www.thepresstribune.com/article/2/27/18/jessica-morse-wins-contested-endorsement-california-democratic-party. Archived from the original on 2018-02-28. Retrieved 2018-02-27. Missing or empty
|title=(help)
External links
- GovTrack.us: California's 4th congressional district
- California Citizens Redistricting Commission: wedrawthelines.ca.gov 2012 final district maps