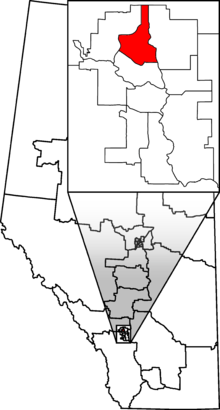
Geography
It consists of the part of the City of Calgary clockwise within the following line: from the northern limit of the city along: Centre Street North, Harvest Hills Boulevard North, Beddington Trail NW, Deerfoot Trail, McKnight Boulevard, John Laurie Boulevard NW, Sarcee Trail, Stoney Trail, 14 Street north to the northern limit of the city.
Demographics
- According to the Canada 2011 Census[3]
Ethnic groups: 56.0% White, 19.8% Chinese, 7.0% South Asian, 3.7% Indigenous, 3.1% Filipino, 2.8% Black, 2.2% Arab, 2.2% Latino, 1.9% Southeast Asian, 1.3% Other
Languages: 78.0% English, 12.9% Chinese, 1.0% Punjabi, 1.0% Spanish, 7.1% Other
Religions: 52.2% Christian, 4.9% Muslim, 3.3% Buddhist, 1.9% Hindu, 1.4% Sikh, 0.6% Other, 35.7% None
Median income: $37,048 (2010)
Average income: $51,586 (2010)
Election results
| Canadian federal election, 2015 |
| Party |
Candidate |
Votes | % | ±% | Expenditures |
|
Conservative | Michelle Rempel | 32,760 | 60.04 | –9.25 | $106,493.93 |
|
Liberal | Robert Prcic | 14,671 | 26.89 | +15.84 | $4,646.34 |
|
New Democratic | Bruce Kaufman | 4,836 | 8.86 | –3.92 | $17,607.32 |
|
Green | Laurie Scheer | 1,384 | 2.54 | –4.21 | $2,630.75 |
|
Libertarian | Edward Gao | 727 | 1.33 | – | $1,101.19 |
|
Democratic Advancement | Faizan Butt | 184 | 0.34 | – | – |
| Total valid votes/Expense limit |
54,562 | 100.00 | | $217,293.27 |
| Total rejected ballots |
255 | 0.47 | – |
| Turnout |
54,817 | 67.19 | – |
| Eligible voters |
81,582 |
|
Conservative hold |
Swing |
–12.54
|
| Source: Elections Canada[6][7] |
| Canadian federal election, 2011 |
| Party |
Candidate |
Votes | % | ±% | Expenditures |
|
Conservative | Diane Ablonczy | 40,384 | 70.17 | +0.54 | $60,393 |
|
New Democratic | Collin Anderson | 7,189 | 12.49 | +4.63 | |
|
Liberal | Margaret McLeod | 6,501 | 11.30 | -1.93 | $34,065 |
|
Green | Tony Hajj | 3,480 | 6.05 | -3.23 | $10,363 |
| Total valid votes/Expense limit |
57,554 | 100.00 | – | $101,293 |
| Total rejected ballots |
169 | 0.29 | – |
| Turnout |
57,723 | 57.35 | – |
| Eligible voters |
100,656 | – | – |
| Canadian federal election, 2008 |
| Party |
Candidate |
Votes | % | ±% | Expenditures |
|
Conservative | Diane Ablonczy | 35,029 | 69.63 | +1.15 | $53,757 |
|
Liberal | Anoush Newman | 6,653 | 13.23 | -3.87 | $9,605 |
|
Green | Tony Hajj | 4,669 | 9.28 | +2.81 | $6,945 |
|
New Democratic | Stephanie Sundberg | 3,953 | 7.86 | -0.08 | $853 |
| Total valid votes/Expense limit |
50,304 | 100.00 | $93,719 |
| Total rejected ballots |
– |
| Turnout |
– |
| Canadian federal election, 2006 |
| Party |
Candidate |
Votes | % | ±% | Expenditures |
|
Conservative | Diane Ablonczy | 37,815 | 68.48 | +4.10 | $56,089 |
| |
Liberal |
Ted Haney |
9,443 |
17.10 |
-5.78 |
$59,767 |
| |
New Democratic Party |
Bruce Kaufman |
4,385 |
7.94 |
+1.21 |
$6,417 |
|
Green | Juliet Burgess | 3,573 | 6.47 | +0.47 | $606 |
| Total valid votes |
55,216 |
100.00 |
|
|
| Total rejected ballots |
130 |
0.23 |
|
|
| Turnout |
55,346 |
63.83 |
|
|
| Canadian federal election, 2004 |
| Party |
Candidate |
Votes | % | ±% | Expenditures |
|
Conservative | Diane Ablonczy | 31,088 | 64.38 | -10.30 | $56,902 |
| |
Liberal |
Ted Haney |
11,051 |
22.88 |
+3.46 |
$49,767 |
| |
New Democratic Party |
Vinay Dey |
3,250 |
6.73 |
+3.01 |
$4,146 |
|
Green | Richard Larson | 2,898 | 6.00 | +4.18 | $570 |
| Total valid votes |
48,287 |
100.00 |
|
|
| Total rejected ballots |
131 |
0.27 |
|
|
| Turnout |
48,418 |
61.21 |
|
|
| Canadian federal election, 2000: Calgary—Nose Hill |
| Party |
Candidate |
Votes | % | ±% | Expenditures |
|
Alliance | Diane Ablonczy | 35,904 | 60.12 | +8.33 | $59,338 |
|
Liberal | Brian Thiessen | 11,602 | 19.42 | -5.81 | $20,306 |
|
Progressive Conservative | James F. McArdle | 8,696 | 14.56 | -2.86 | $5,320 |
|
New Democratic | Jon Adams | 2,227 | 3.72 | -0.06 | $893 |
|
Green | Andrew Pickles | 1,092 | 1.82 | +0.55 | $2,410 |
|
Canadian Action | Maureen Ann Roberts | 194 | 0.32 | – | $2,411 |
| Total valid votes |
59,715 |
| Total rejected ballots |
123 | 0.21 |
| Turnout |
59,838 | 59.51 |
| Canadian federal election, 1997 |
| Party |
Candidate |
Votes | % | ±% | Expenditures |
|
Reform | Diane Ablonczy | 25,788 | 51.79 | | $64,740 |
| |
Liberal |
James Maxim |
12,565 |
25.23 |
|
$47,359 |
| |
Progressive Conservative |
Pat Murray |
8,678 |
17.42 |
|
$53,211 |
| |
New Democratic Party |
Andrea Garnier |
1,883 |
3.78 |
|
$1,278 |
|
Green | Frank Young | 637 | 1.27 | – | $1,631 |
| |
Natural Law |
Gloria Hansen |
237 |
0.47 |
|
$103 |
| Total valid votes |
49,788 |
100.00 |
|
|
| Total rejected ballots |
102 |
0.20 |
|
|
| Turnout |
49,890 |
64.88 |
|
|
Notes
- ↑ The Reform Party merged with the Canadian Alliance on 27 March 2000.
- ↑ The Canadian Alliance merged with the Progressive Conservatives to form the Conservative Party on 8 December 2003.
.png)
.png)