Urban heat island
An urban heat island (UHI) is an urban area or metropolitan area that is significantly warmer than its surrounding rural areas due to human activities. The temperature difference is usually larger at night than during the day, and is most apparent when winds are weak. UHI is most noticeable during the summer and winter. The main cause of the urban heat island effect is from the modification of land surfaces.[1][2] Waste heat generated by energy usage is a secondary contributor.[3] As a population center grows, it tends to expand its area and increase its average temperature. The term heat island is also used; the term can be used to refer to any area that is relatively hotter than the surrounding, but generally refers to human-disturbed areas.[4]
Monthly rainfall is greater downwind of cities, partially due to the UHI. Increases in heat within urban centers increases the length of growing seasons and decreases the occurrence of weak tornadoes. The UHI decreases air quality by increasing the production of pollutants such as ozone, and decreases water quality as warmer waters flow into area streams and put stress on their ecosystems.
Not all cities have a distinct urban heat island, and the heat island characteristics depend strongly on the background climate of the area in which the city is located.[5] Mitigation of the urban heat island effect can be accomplished through the use of green roofs and the use of lighter-colored surfaces in urban areas, which reflect more sunlight and absorb less heat.
Concerns have been raised about possible contribution from urban heat islands to global warming. While some lines of research did not detect a significant impact, other studies have concluded that heat islands can have measurable effects on climate phenomena at the global scale.
History
The phenomenon was first investigated and described by Luke Howard in the 1810s, although he was not the one to name the phenomenon.[6]
Causes
There are several causes of an urban heat island (UHI); for example, dark surfaces absorb significantly more solar radiation, which causes urban concentrations of roads and buildings to heat more than suburban and rural areas during the day;[1] materials commonly used in urban areas for pavement and roofs, such as concrete and asphalt, have significantly different thermal bulk properties (including heat capacity and thermal conductivity) and surface radiative properties (albedo and emissivity) than the surrounding rural areas. This causes a change in the energy budget of the urban area, often leading to higher temperatures than surrounding rural areas.[7] Another major reason is the lack of evapotranspiration (for example, through lack of vegetation) in urban areas.[8] The U.S. Forest Service found in 2018 that cities in the United States are losing 36 million trees each year.[9] With a decreased amount of vegetation, cities also lose the shade and evaporative cooling effect of trees.[10][11]
Other causes of a UHI are due to geometric effects. The tall buildings within many urban areas provide multiple surfaces for the reflection and absorption of sunlight, increasing the efficiency with which urban areas are heated. This is called the "urban canyon effect". Another effect of buildings is the blocking of wind, which also inhibits cooling by convection and prevents pollutants from dissipating. Waste heat from automobiles, air conditioning, industry, and other sources also contributes to the UHI.[3][12][13] High levels of pollution in urban areas can also increase the UHI, as many forms of pollution change the radiative properties of the atmosphere.[7] UHI not only raises urban temperatures but also increases ozone concentrations because ozone is a greenhouse gas whose formation will accelerate with the increase of temperature.[14]
For most cities, the difference in temperature between the urban and surrounding rural area is largest at night. While temperature difference is significant all year round, the difference is generally bigger in Winter.[15][16] The typical temperature difference is several degrees between the center of the city and surrounding fields. The difference in temperature between an inner city and its surrounding suburbs is frequently mentioned in weather reports, as in "68 °F (20 °C) downtown, 64 °F (18 °C) in the suburbs". "The annual mean air temperature of a city with 1 million people or more can be 1.8–5.4 °F (1.0–3.0 °C) warmer than its surroundings. In the evening, the difference can be as high as 22 °F (12 °C)."[17][18]
The UHI can be defined as either the air temperature difference (the canopy UHI) or the surface temperature difference (surface UHI) between the urban and the rural area. These two show slightly different diurnal and seasonal variability and have different causes [19][8]
Diurnal behavior
The IPCC stated that "it is well-known that compared to non-urban areas urban heat islands raise night-time temperatures more than daytime temperatures."[20] For example, Barcelona, Spain is 0.2 °C (0.36 °F) cooler for daily maxima and 2.9 °C (5.2 °F) warmer for minima than a nearby rural station.[21] A description of the very first report of the UHI by Luke Howard in the late 1810s said that the urban center of London was warmer at night than the surrounding countryside by 2.1 °C (3.7 °F).[22] Though the warmer air temperature within the UHI is generally most apparent at night, urban heat islands exhibit significant and somewhat paradoxical diurnal behavior. The air temperature difference between the UHI and the surrounding environment is large at night and small during the day. The opposite is true for skin temperatures of the urban landscape within the UHI.[23]
Throughout the daytime, particularly when the skies are cloudless, urban surfaces are warmed by the absorption of solar radiation. Surfaces in the urban areas tend to warm faster than those of the surrounding rural areas. By virtue of their high heat capacities, urban surfaces act as a giant reservoir of heat energy. For example, concrete can hold roughly 2,000 times as much heat as an equivalent volume of air. As a result, the large daytime surface temperature within the UHI is easily seen via thermal remote sensing.[24] As is often the case with daytime heating, this warming also has the effect of generating convective winds within the urban boundary layer. It is theorized that, due to the atmospheric mixing that results, the air temperature perturbation within the UHI is generally minimal or nonexistent during the day, though the surface temperatures can reach extremely high levels.[25]
At night, the situation reverses. The absence of solar heating leads to the decrease of atmospheric convection and the stabilization of urban boundary layer. If enough stabilization occurs, an inversion layer is formed. This traps urban air near the surface, and keeping surface air warm from the still-warm urban surfaces, resulting in warmer nighttime air temperatures within the UHI. Other than the heat retention properties of urban areas, the nighttime maximum in urban canyons could also be due to the blocking of "sky view" during cooling: surfaces lose heat at night principally by radiation to the comparatively cool sky, and this is blocked by the buildings in an urban area. Radiative cooling is more dominant when wind speed is low and the sky is cloudless, and indeed the UHI is found to be largest at night in these conditions.[26][8]
Seasonal behavior
The urban heat island temperature difference is not only usually larger at night than during the day, but also larger in winter than in summer. This is especially true in areas where snow is common, as cities tend to hold snow for shorter periods of time than surrounding rural areas (this is due to the higher insulation capacity of cities, as well as human activities such as plowing). This decreases the albedo of the city and thereby magnifies the heating effect. Higher wind speeds in rural areas, particularly in winter, can also function to make them cooler than urban areas. Regions with distinct wet and dry seasons will exhibit a larger urban heat island effect during the dry season. The thermal time constant of moist soil is much higher than that of dry soil.[27] As a result, moist rural soils will cool slower than dry rural soils and act to minimize the nocturnal temperature difference between urban and rural regions.[8]
Prediction
If a city or town has a good system of taking weather observations the UHI can be measured directly.[28] An alternative is to use a complex simulation of the location to calculate the UHI, or to use an approximate empirical method.[29][30] Such models allow the UHI to be included in estimates of future temperatures rises within cities due to climate change.
Leonard O. Myrup published the first comprehensive numerical treatment to predict the effects of the urban heat island (UHI) in 1969. His paper surveys UHI and criticizes then-existing theories as being excessively qualitative. A general purpose, numerical energy budget model is described and applied to the urban atmosphere. Calculations for several special cases as well as a sensitivity analysis are presented. The model is found to predict the correct order of magnitude of the urban temperature excess. The heat island effect is found to be the net result of several competing physical processes. In general, reduced evaporation in the city center and the thermal properties of the city building and paving materials are the dominant parameters. It is suggested that such a model could be used in engineering calculations to improve the climate of existing and future cities.[31]
Impact on animals
Ant colonies in urban heat islands have an increased heat tolerance at no cost to cold tolerance.[32]
Species that are good at colonizing can utilize conditions provided by urban heat islands to thrive in regions outside of their normal range. Examples of this include grey-headed flying fox (Pteropus poliocephalus) and the common house gecko (Hemidactylus frenatus).[33] Grey-headed flying foxes, found in Melbourne, Australia, colonized urban habitats following increase in temperatures there. Increased temperatures, causing warmer winter conditions, made the city more similar in climate to the more northerly wildland habitat of the species.
With attempts to mitigate and manage urban heat islands, temperature changes and availability of food and water are reduced. With temperate climates, urban heat islands will extend the growing season, therefore altering breeding strategies of inhabiting species.[34] This can be seen the best in the effects that urban heat islands have on water temperature. With the temperature of the nearby buildings sometimes reaching over 50 degrees different from the near-surface air temperature, precipitation will warm rapidly, causing runoff into nearby streams, lakes and rivers (or other bodies of water) to provide excessive thermal pollution. The increase in the thermal pollution has the ability to increase water temperature by 20 to 30 degrees. This increase will cause the fish species inhabiting the body of water to undergo thermal stress and shock due to the rapid change in temperature to their climate.[35]
Urban heat islands caused by cities have altered the natural selection process.[34] Selective pressures like temporal variation in food, predation and water are relaxed causing for a new set of selective forces to roll out. For example, within urban habitats, insects are more abundant than in rural areas. Insects are ectotherms. This means that they depend on the temperature of the environment to control their body temperature, making for the warmer climates of the city perfect for their ability to thrive. A study done in Raleigh, North Carolina conducted on Parthenolecanium quercifex (oak scales), showed that this particular species preferred warmer climates and were therefore found in higher abundance in the urban habitats than on oak trees in rural habitats. Over time of living in urban habitats, they have adapted to thrive in warmer climates than in cooler.[36]
The presence of non-native species is heavily dependent on the amount of human activity.[37] An example of this can be seen in the populations of cliff swallows seen taking nests under the eaves of homes in urban habitats. They make their homes using the shelter provided by the humans in the upper regions of homes, allowing for an influx in their populations due to added protection and reduced predator numbers.
Other impacts on weather and climate
Aside from the effect on temperature, UHIs can produce secondary effects on local meteorology, including the altering of local wind patterns, the development of clouds and fog, the humidity, and the rates of precipitation.[38] The extra heat provided by the UHI leads to greater upward motion, which can induce additional shower and thunderstorm activity. In addition, the UHI creates during the day a local low pressure area where relatively moist air from its rural surroundings converges, possibly leading to more favorable conditions for cloud formation.[39] Rainfall rates downwind of cities are increased between 48% and 116%. Partly as a result of this warming, monthly rainfall is about 28% greater between 20 miles (32 km) to 40 miles (64 km) downwind of cities, compared with upwind.[40] Some cities show a total precipitation increase of 51%.[41]
Research has been done in a few areas suggesting that metropolitan areas are less susceptible to weak tornadoes due to the turbulent mixing caused by the warmth of the urban heat island.[42] Using satellite images, researchers discovered that city climates have a noticeable influence on plant growing seasons up to 10 kilometers (6.2 miles) away from a city's edges. Growing seasons in 70 cities in eastern North America were about 15 days longer in urban areas compared to rural areas outside of a city's influence.[43]
Research in China indicates that urban heat island effect contributes to climate warming by about 30%.[44][45] On the other hand, one 1999 comparison between urban and rural areas proposed that urban heat island effects have little influence on global mean temperature trends.[46] One study concluded that cities change the climate in area 2–4 times larger than their own area.[47] Other suggested that urban heat islands affect global climate by impacting the jet stream.[48] Several studies have revealed increases in the severity of the effect of heat islands with the progress of climate change.[49]
Health effects
UHIs have the potential to directly influence the health and welfare of urban residents. Within the United States alone, an average of 1,000 people die each year due to extreme heat.[50] As UHIs are characterized by increased temperature, they can potentially increase the magnitude and duration of heat waves within cities. Research has found that the mortality rate during a heat wave increases exponentially with the maximum temperature,[51] an effect that is exacerbated by the UHI. The nighttime effect of UHIs can be particularly harmful during a heat wave, as it deprives urban residents of the cool relief found in rural areas during the night.[52]
Research in the United States suggests that the relationship between extreme temperature and mortality varies by location. Heat is more likely to increase the risk of mortality in cities in the northern part of the country than in the southern regions of the country. For example, when Chicago, Denver, or New York experience unusually hot summertime temperatures, elevated levels of illness and death are predicted. In contrast, parts of the country that are mild to hot year-round have a lower public health risk from excessive heat. Research shows that residents of southern cities, such as Miami, Tampa, Los Angeles, and Phoenix, tend to be acclimated to hot weather conditions and therefore less vulnerable to heat related deaths. However, as a whole, people in the United States appear to be adapting to hotter temperatures further north each decade. However, this might be due to better infrastructure, more modern building design, and better public awareness.[53]
Increased temperatures have been reported to cause heat stroke, heat exhaustion, heat syncope, and heat cramps.[54] Some studies have also looked at how severe heat stroke can lead to permanent damage to organ systems.[54] This damage can increase the risk of early mortality because the damage can cause severe impairment in organ function.[54] Other complications of heat stroke include respiratory distress syndrome in adults and disseminated intravascular coagulation.[55] Some researchers have noted that any compromise to the human body's ability to thermoregulate would in theory increase risk of mortality.[54] This includes illnesses that may affect a person's mobility, awareness, or behavior.[54] Researchers[55] have noted that individuals with cognitive health issues (e.g. depression, dementia, Parkinson's disease) are more at risk when faced with high temperatures and "need to take extra care"[54] as cognitive performance has been shown to be differentially affected[56] by heat. People with diabetes,[54] are overweight,[55] have sleep deprivation,[55] or have cardiovascular/cerebrovascular conditions should avoid too much heat exposure.[54][55] Some common medications that have an effect on thermoregulation can also increase the risk of mortality. Specific examples include anticholinergics,[54] diuretics,[54] phenothiazines[55] and barbiturates.[55] Not only health, but heat can also affect behavior. A U.S. study suggests that heat can make people more irritable and aggressive, noting that violent crimes increased by 4.58 out of 100,000 for every one degree increase in temperature.[57]
A researcher found that high UHI intensity correlates with increased concentrations of air pollutants that gathered at night, which can affect the next day's air quality.[57] These pollutants include volatile organic compounds, carbon monoxide, nitrogen oxides, and particulate matter.[55] The production of these pollutants combined with the higher temperatures in UHIs can quicken the production of ozone.[57] Ozone at surface level is considered to be a harmful pollutant.[57] Studies suggest that increased temperatures in UHIs can increase polluted days but also note that other factors (e.g. air pressure, cloud cover, wind speed) can also have an effect on pollution.[57]
The Centers for Disease Control and Prevention notes that it "is difficult to make valid projections of heat-related illness and death under varying climate change scenarios" and that "heat–related deaths are preventable, as evidenced by the decline of all-cause mortality during heat events over the past 35 years".[58] However, some studies suggest that the effects of UHIs on health may be disproportionate, since the impacts may be unevenly distributed based on a variety of factors such as age,[55][59] ethnicity and socioeconomic status.[60] This raises the possibility of health impacts from UHIs being an environmental justice issue.
Inequality of tree canopy cover
- Relationship between neighborhood income and tree canopy cover
In recent years, researchers have discovered a strong correlation between neighborhood income and tree canopy cover. In 2010, researchers at Auburn University and University of Southern California found that the presence of trees are "highly responsive to changes in [neighborhood] income."[61] Low-income neighborhoods tend to have significantly fewer trees than neighborhoods with higher incomes. They described this unequal distribution of trees as a demand for "luxury," rather than "necessity."[62] According to the study, "for every 1 percent increase in per capita income, demand for forest cover increased by 1.76 percent. But when income dropped by the same amount, demand decreased by 1.26 percent."[62]
Trees are a necessary feature in combating most of the urban heat island effect because they reduce air temperatures by 10 °F (5.6 °C),[63] and surface temperatures by up to 20–45 °F (11–25 °C).[64] Researchers hypothesized that less-well-off neighborhoods do not have the financial resources to plant and maintain trees. Affluent neighborhoods can afford more trees, on "both public and private property."[65] Part of this is also that wealthier homeowners and communities can afford more land, which can be kept open as green space, whereas poorer ones are often rentals, where landowners try to maximize their profit by putting as much density as possible on their land.
Impact on nearby water bodies
UHIs also impair water quality. Hot pavement and rooftop surfaces transfer their excess heat to stormwater, which then drains into storm sewers and raises water temperatures as it is released into streams, rivers, ponds, and lakes. Additionally, increased urban water body temperatures lead to a decrease in diversity in the water.[66] In August 2001, rains over Cedar Rapids, Iowa, led to a 10.5C (18.9F) rise in the nearby stream within one hour, which led to a fish kill. Since the temperature of the rain was comparatively cool, it could be attributed to the hot pavement of the city. Similar events have been documented across the American Midwest, as well as Oregon and California.[67] Rapid temperature changes can be stressful to aquatic ecosystems.[68] Permeable pavements may mitigate these effects by percolating water through the pavement into subsurface storage areas where it can be dissipate through absorption and evaporation.[69]
Impact on energy usage
Another consequence of urban heat islands is the increased energy required for air conditioning and refrigeration in cities that are in comparatively hot climates. The Heat Island Group estimates that the heat island effect costs Los Angeles about US$100 million per year in energy.[70] Conversely, those that are in cold climates such as Moscow, Russia would have less demand for heating. However, through the implementation of heat island reduction strategies, significant annual net energy savings have been calculated for northern locations such as Chicago, Salt Lake City, and Toronto.[71]
Mitigation
The temperature difference between urban areas and the surrounding suburban or rural areas can be as much as 5 °C (9.0 °F). Nearly 40 percent of that increase is due to the prevalence of dark roofs, with the remainder coming from dark-colored pavement and the declining presence of vegetation. The heat island effect can be counteracted slightly by using white or reflective materials to build houses, roofs, pavements, and roads, thus increasing the overall albedo of the city.[72] Relative to remedying the other sources of the problem, replacing dark roofing requires the least amount of investment for the most immediate return. A cool roof made from a reflective material such as vinyl reflects at least 75 percent of the sun's rays, and emit at least 70 percent of the solar radiation absorbed by the building envelope. Asphalt built-up roofs (BUR), by comparison, reflect 6 percent to 26 percent of solar radiation.[73]
Using light-colored concrete has proven effective in reflecting up to 50% more light than asphalt and reducing ambient temperature.[74] A low albedo value, characteristic of black asphalt, absorbs a large percentage of solar heat creating warmer near-surface temperatures. Paving with light-colored concrete, in addition to replacing asphalt with light-colored concrete, communities may be able to lower average temperatures.[75] However, research into the interaction between reflective pavements and buildings has found that, unless the nearby buildings are fitted with reflective glass, solar radiation reflected off light-colored pavements can increase building temperatures, increasing air conditioning demands.[76][77]
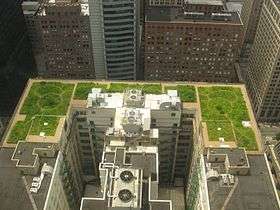
A second option is to increase the amount of well-watered vegetation. These two options can be combined with the implementation of green roofs. Green roofs are excellent insulators during the warm weather months and the plants cool the surrounding environment. Air quality is improved as the plants absorb carbon dioxide with concomitant production of oxygen.[78] The city of New York determined that the cooling potential per area was highest for street trees, followed by living roofs, light covered surface, and open space planting. From the standpoint of cost effectiveness, light surfaces, light roofs, and curbside planting have lower costs per temperature reduction.[79]
A hypothetical "cool communities" program in Los Angeles has projected that urban temperatures could be reduced by approximately 3 °C (5 °F) after planting ten million trees, reroofing five million homes, and painting one-quarter of the roads at an estimated cost of US$1 billion, giving estimated annual benefits of US$170 million from reduced air-conditioning costs and US$360 million in smog related health savings.[80]
Mitigation strategies include:
- White roofs: Painting rooftops white has become a common strategy to reduce the heat island effect.[81] In cities, there are many dark colored surfaces that absorb the heat of the sun in turn lowering the albedo of the city.[81] White rooftops allow high solar reflectance and high solar emittance, increasing the albedo of the city or area the effect is occurring.[81]
- Green roofs: Green roofs are another method of decreasing the urban heat island effect. Green roofery is the practice of having vegetation on a roof; such as having trees or a garden. The plants that are on the roof increase the albedo and decreases the urban heat island effect.[81] This method has been studied and criticized for the fact that green roofs are affected by climatic conditions, green roof variables are hard to measure, and are very complex systems[81]
- Planting trees in cities: Planting trees around the city can be another way of increasing albedo and decreasing the urban heat island effect. It is recommended to plant deciduous trees because they can provide many benefits such as more shade in the summer and not blocking warmth in winter.[82]
- Green parking lots: Green parking lots use surfaces other than asphalt and vegetation to limit the impact urban heat island effect.
Mitigation policies, measures and other strategies
Global Warming Solutions Act of 2006, or Assembly Bill (AB) 32 scoping plan
Assembly Bill (AB) 32 required the California Air Resources Board to create a scoping plan. This plan is California's approach on how to carry out their goal of combating climate change by reducing greenhouse emissions by 2020 to levels from the 1990s. The scoping plan had four primary programs, advanced clean cars, cap and trade, renewables portfolio standard and low-carbon fuel standard all geared toward increased energy efficiency. The plan has main strategies to reduce green house gases such as having monetary incentives, regulations and voluntary actions. Every five years the scoping plan is updated.[83]
- The advanced clean car rules program was made to reduce tail pipe emissions. The Air Resources Board approved the program to control emissions for newer models from the year 2017 to 2025. Some of their goals by 2025 are to have more environmentally superior cars to be available in different models and different types of cars. New automobiles will emit 34 percent fewer global warming gases and 75 percent fewer smog-forming emissions. And if fully implemented consumers can save an average of $6,000 over the life of the car.[84]
- The renewable portfolio standard mandates to increase renewable energy from a variety of sources such as solar power and wind. Investor-owned utilities, community choice aggregators and electric service providers are required to increase procurement to 33% by 2020.[85]
- Low carbon fuel standards is administered by the California Air Resources Board and attempts to make wider choice of cleaner fuels to Californians. Producers of petroleum-based fuels are required to reduce the carbon intensity of their products to 10 percent in 2020.[86]
- Cap and trade is designed to reduce the effects of climate change by setting a cap on greenhouse gases released into the atmosphere. The cap will decline approximately three percent each year in 2013. The trading will create incentives to reduce the effects of climate change in California communities by reducing greenhouse gases through investments in clean technologies.[87]
Clean Air Act
The EPA has initiated several air quality requirements that help reduce ground-level ozone that leads to urban heat islands. In the Clean Air Act, one of the EPA's chief policies, there are certain regulations that are put in place to ensure the state's emissions stay below a certain level. Included in the Clean Air Act, all states must set forth a State Implementation Plan (SIP) which is designed to guarantee all states meet a central air quality standard.[88]
State implementation plans and policies
- The Emerging and Voluntary Measures Policy allows a state to add unconventional forms of heat island mitigation. This can include removing pollution after it has already been emitted into air, water, or soil. These measures are not implemented into law, but they do make it possible for certain parties to voluntarily become more efficient. The purpose of this policy is for all polluting sources to follow by example and use the most successful forms of mitigation.[89]
- The Guidance on State Implementation Plan Credits for Emissions Reductions from Electric-Sector Energy Efficiency or Renewable Energy Measures is an educational tool for states to create an up-to-date and well-organized SIP. It allows states to include plans that meet the guidelines or plans that exceed expectations. Based on the success of their SIP, some states can have their plans incorporated into other SIPs.[90]
- The Bundled Measures Policy authorizes different factions within the state to collaborate on mitigation projects. This policy takes a more of a community-based approach by adding several groups for the purpose of multiple perspectives and inventive approaches. The Bundled Measures Policy is one method that generates co-benefits for both parties.[91] In example, if a partaking business were to add cool roofs, there will be a reduction in greenhouse gases which is beneficial for the environment as well as the need for excess energy which is beneficial for the business.
Implementation of policies
The Seattle Green Factor, a multifaceted system for urban landscaping, has seen much success in the mitigation of urban heat islands. The program focuses on areas that are prone to high pollution, such as business districts. There are strict guidelines for any new construction that exceeds roughly 20 parking spaces, and this platform helps developers physically see their levels of pollution while trying different methods of construction to figure out the most effective course of action. Seattle has correspondingly produced a "score sheet" for cities to use in their city planning.[88]
AB32 and urban heat islands
- Urban heat islands increase demand for energy consumption during the summer when temperatures rise. As a result of increased energy consumption, there is an increase in air pollution and greenhouse gas emissions. This policy focuses on lowering greenhouse emissions, which contributes to lowering the heat island effect.[92]
EPA Compendium of Strategies
This compendium focuses on a variety of issues dealing with urban heat islands. They describe how urban heat islands are created, who is affected, and how people can make a difference to reduce temperature. It also shows examples of policies and voluntary actions by state and local governments to reduce the effect of urban heat islands.[93]
Incentives
- Sacramento Municipal Utility District (SMUD) and the Sacramento Tree Foundation have partnered to provide the city of Sacramento shade trees for free. The program allows citizens to receive trees from four to seven feet tall. They also give them fertilizer, and delivery, all at no cost. They encourage citizens to plant their trees to benefit their home by reducing air conditioning costs. Approximately more than 450,000 shade trees have been planted in the Sacramento area.[94]
- The Eco-Roof Incentive Program: In Canada, grants are distributed throughout Toronto for installing green and cool roofs on residential and commercial buildings. This will reduce usage of energy and lower green house gas emissions.[95]
- Tree vitalize: This program is a partnership with multiple entities that focuses on helping restore tree cover in the city, it also educates citizens about the positive effects of trees on climate change and the urban heat island effect. And another goal they have is to build capacity among local governments to understand, protect and restore their urban trees. Because there is a need for educating citizens about the maintenance of trees, Treevitalize provides nine hours of classroom and field training to community residents. The classes cover a variety of topics such as tree identification, pruning, tree biology, and proper species selection.[96]
Weatherization
U.S. Department of Energy Weatherization Assistance Program helps low income recipients by covering their heating bills and helping the families to make their homes energy efficient. In addition, this program allows states to also use the funds to install cooling efficiency measures such as shading devices.[96]
Outreach and education
- Tree Utah: a statewide non-profit organization is dedicated to educating communities about the environmental and social benefits provided by trees. They are also committed to planting thousands of trees throughout the state of Utah.[97]
- The Lawrence Hall of Science at UC Berkeley has a high-school level course called Global Systems Science. The course focuses on a variety of topics including climate change and the greenhouse effect.[98]
- The Department of Biology at the University of Central Florida, has previously offered a course, called "Systems sustainability: socially and economically viable environmental protection". The course is an overview of connectivity, scales and networks, and various research methods, and includes a final research article & poster presentation. It is a service-learning class (students host a service event in addition to performing research funded by UCF Land Management & Natural Resources and the UCF Arboretum). One of the ongoing research projects executed by the class is the Urban Heat Island Study, as shown in this presentation from August 2015, and this presentation from November 2015. Research is used by campus developers to ensure efficiency and sustainability on campus as the campus grows in attendance and area, and the UHI effect is recognized and discussed briefly in the UCF Urban Forestry Plan from 2015 (on page 11).
Tree protection ordinances
- A variety of local governments have implemented tree and landscape ordinances, which will help communities by providing shade during summer. Tree protection is an ordinance that does not allow someone to prune or remove trees without a city permit. An example is the city of Glendale, California: Through the Indigenous Tree Ordinance, the city of Glendale protects the following species of trees, the California sycamore, the coast live oak, mesa oak, valley oak, scrub oak, California bay. Anyone who is planning on removing or trimming the trees has to obtain an indigenous tree permit. Within the permit they have to provide detailed information about the number of trees affected, trunk diameter and the health of the tree itself. They also have to submit photographs of the site, and a site plan sketch.[99]
- Another example is the city of Berkeley, California. The tree protection ordinance prohibits the removal of coast live oak trees and any excessive pruning that can cause harm to the tree is also prohibited. The only exception is if the tree is poses a danger to life or limb and danger to the property.[100]
- The city of Visalia, California, has implemented a street tree ordinance intended to promote and regulate the planting, maintenance, and protection of street trees within the city. Their ordinance does not allow street trees to be altered, pruned or removed. Street trees are also protected during construction.[101]
Co-benefits of mitigation strategies
Trees and gardens aid mental health
- A large percentage of people who live in urban areas have access to parks and gardens in their areas, which are probably the only connections they have with nature. A study shows that having contact with nature helps promote our health and well-being. People who had access to gardens or parks were found to be healthier than those who did not.[102]
- Another study done investigating whether or not the viewing of natural scenery may influence the recoveries of people from undergoing surgeries, found that people who had a window with a scenic view had shorter postoperative hospital stays and fewer negative comments from nurses.[103]
Tree planting as empowerment and community building
- Los Angeles TreePeople, is an example of how tree planting can empower a community. Tree people provides the opportunity for people to come together, build capacity, community pride and the opportunity to collaborate and network with each other.[104]
Green roofs as food production
- Growing food on rooftops could be an option for fast growing communities. Popular plants grown for food include, chives, oregano and lavender these plants are suitable for green roofs because they are evolutionarily equipped for Mediterranean climate.[105]
Green roofs and wildlife biodiversity
- Green roofs are important for wildlife because they allow organisms to inhabit the new garden. To maximize opportunities to attract wildlife to a green roof, one must aid the garden to be as diverse as possible in the plants that are added. By planting a wide array of plants, different kinds of invertebrate species will be able to colonize, they will be provided with foraging sources and habitat opportunities.[105]
Urban forests and a cleaner atmosphere
- Trees provide benefits such as absorbing carbon dioxide, and other pollutants.[106] Trees also provide shade and reduce ozone emissions from vehicles. By having many trees, we can cool the city heat by approximately 10 degrees to 20 degrees, which will help reducing ozone and helping communities that are mostly affected by the effects of climate change and urban heat islands.[107]
Low-impact development strategy and sponge city
- Low-impact development, sponge city, is an opportunity to technically mitigate UHI phenomenon with higher compatibilities in cool pavement and green infrastructures. Although there are some intrinsic discrepancies among understandings of sponge city and UHI mitigation towards blue infrastructure, the osmotic pool, wet pond, and regulating pond are essential supplements to urban water bodies, performing their roles in nourishing vegetation and evaporating for cooling in UHI mitigation. Sponge city pilot projects have already provided the financial foundation for taking the UHI mitigation further. It is an attempt for people in different disciplines to synergistically think about how to mitigate UHI effects, which is conducive to the generation of holistic policies, guidelines and regulations. Furthermore, the inclusion of UHI mitigation can be a driver to public participation in sponge city construction, which can consolidate the PPP model for more funds. The weights of different authorities can also be redistributed to promote institutional transitions. [108]
Green building programs
Voluntary green building programs have been promoting the mitigation of the heat island effect for years.[109] For example, one of the ways for a site to earn points under the US Green Building Council's (USGBC) Leadership in Energy and Environmental Design (LEED) Green Building Rating System is to take action that reduces heat islands, minimizing impacts on microclimates and human and wildlife habitats. Credits associated with reflective roofing or planted roofs can help a building achieve LEED certification. Buildings also receive credits by providing shade.[110] Similarly, The Green Building Initiative's Green Globes program awards points to sites that take measures to decrease a building's energy consumption and reduce the heat island effect. As many as 10 points may be awarded to sites with roof coverage from vegetation, highly reflective materials, or a combination of the two.[111].
Moreover, some scholars advocate that microclimate moderation should be included to foster, or at least be harmless to, the initial goals of GB in energy consumption reduction, carbon emission reduction and indoor environmental quality. Based on this, they argue the next generation of green building should be GB-based UHI mitigation system, or ‘zero UHI impact building’, or ‘zero-heat building’ or ‘microclimate neutral building’, aiming to achieve the zero-heat impact on surrounding environments through reasonably designing and operating buildings, or depending on innovative techniques to eliminate the excessive heats, on the basis of GB’s goals.[112].
Cost analysis
Every year in the U.S. 15% of energy goes towards the air conditioning of buildings in these urban heat islands. According to Rosenfeld et al., "the air conditioning demand has risen 10% within the last 40 years."[113] Home and business owners alike can benefit from building a cool community. A decrease in energy usage directly correlates to cost efficiency. Areas with substantial vegetation and reflective surface materials used for roofs of houses, pavement, and roads are proven to be more effective and cost efficient.
In a case study of the Los Angeles Basin, simulations showed that even when trees are not strategically placed in these urban heat islands, they can still aid in minimization of pollutants and energy reduction. It is estimated that with this wide-scale implementation, the city of Los Angeles can annually save $100M with most of the savings coming from cool roofs, lighter colored pavement, and the planting of trees. With a citywide implementation, added benefits from the lowering smog-level would result in at least one billion dollars of saving per year.[113]
The cost efficiency of green roofs is quite high because of several reasons. According to Carter, "A conventional roof is estimated to be $83.78/m2 while a green roof was estimated at $158.82/m2."[114] For one, green roofs have over double the lifespan of a conventional roof, effectively decelerating the amount of roof replacements every year. In addition to roof-life, green roofs add stormwater management reducing fees for utilities. The cost for green roofs is more in the beginning, but over a period of time, their efficiency provides financial as well as health benefits.
In Capital E Analysis' conclusions of the financial benefits of green buildings, it was determined that green roofs successfully lowered energy usage and raised health benefits. For every square foot of green roof used in one study the savings amounted to $5.80 energy-wise. There were also savings seen in the emissions, water, and maintenance categories. Overall, the savings amounted to $52.90–$71.30 on average while the cost of going green totaled -$3.00–$5.00.[115]
Global warming
Because some parts of some cities may be hotter than their surroundings, concerns have been raised that the effects of urban sprawl might be misinterpreted as an increase in global temperature. Such effects are removed by homogenization from the raw climate record by comparing urban stations with surrounding stations. While the "heat island" warming is an important local effect, there is no evidence that it biases trends in the homogenized historical temperature record. For example, urban and rural trends are very similar.[20]
The Third Assessment Report from the IPCC says:
However, over the Northern Hemisphere land areas where urban heat islands are most apparent, both the trends of lower-tropospheric temperature and surface air temperature show no significant differences. In fact, the lower-tropospheric temperatures warm at a slightly greater rate over North America (about 0.28°C/decade using satellite data) than do the surface temperatures (0.27°C/decade), although again the difference is not statistically significant.[20]
Ground temperature measurements, like most weather observations, are logged by location. Their siting predates the massive sprawl, roadbuilding programs, and high- and medium-rise expansions which contribute to the UHI. More importantly, station logs allow sites in question to be filtered easily from data sets. Doing so, the presence of heat islands is visible, but overall trends change in magnitude, not direction. The effects of the urban heat island may be overstated. One study stated, "Contrary to generally accepted wisdom, no statistically significant impact of urbanization could be found in annual temperatures." This was done by using satellite-based night-light detection of urban areas, and more thorough homogenisation of the time series (with corrections, for example, for the tendency of surrounding rural stations to be slightly higher in elevation, and thus cooler, than urban areas). If its conclusion is accepted, then it is necessary to "unravel the mystery of how a global temperature time series created partly from urban in situ stations could show no contamination from urban warming." The main conclusion is that microscale and local-scale impacts dominate the mesoscale impact of the urban heat island. Many sections of towns may be warmer than rural sites, but surface weather observations are likely to be made in park "cool islands."[116]
Not all cities show a warming relative to their rural surroundings. After trends were adjusted in urban weather stations around the world to match rural stations in their regions, in an effort to homogenise the temperature record, in 42 percent of cases, cities were getting cooler relative to their surroundings rather than warmer. One reason is that urban areas are heterogeneous, and weather stations are often sited in "cool islands" – parks, for example – within urban areas.[117]
Studies in 2004 and 2006 attempted to test the urban heat island theory, by comparing temperature readings taken on calm nights with those taken on windy nights.[118][119] If the urban heat island theory is correct then instruments should have recorded a bigger temperature rise for calm nights than for windy ones, because wind blows excess heat away from cities and away from the measuring instruments. There was no difference between the calm and windy nights, and one study said that "we show that, globally, temperatures over land have risen as much on windy nights as on calm nights, indicating that the observed overall warming is not a consequence of urban development."[120][121]
A view often held by those who reject the evidence for global warming is that much of the temperature increase seen in land based thermometers could be due to an increase in urbanization and the siting of measurement stations in urban areas.[121] For example, Ross McKitrick and Patrick J. Michaels conducted a statistical study of surface-temperature data regressed against socioeconomic indicators, and concluded that about half of the observed warming trend (for 1979–2002) could be accounted for by the residual UHI effects in the corrected temperature data set they studied—which had already been processed to remove the (modeled) UHI contribution.[122][123] Critics of this paper, including Gavin A. Schmidt,[124] have said the results can be explained away as an artifact of spatial autocorrelation. McKittrick and Nicolas Nierenberg stated further that "the evidence for contamination of climatic data is robust across numerous data sets."[125]
The preliminary results of an independent assessment carried out by the Berkeley Earth Surface Temperature group, and made available to the public in October 2011, found that among other scientific concerns raised by skeptics, the urban heat island effect did not bias the results obtained by NOAA, the Hadley Centre and NASA's GISS. The Berkeley Earth group also confirmed that over the past 50 years the land surface warmed by 0.911 °C (1.640 °F), and their results closely matched those obtained from earlier studies.[126][127][128][129][130]
Climate Change 2007, the Fourth Assessment Report from the IPCC states the following.
Studies that have looked at hemispheric and global scales conclude that any urban-related trend is an order of magnitude smaller than decadal and longer time-scale trends evident in the series (e.g., Jones et al., 1990; Peterson et al., 1999). This result could partly be attributed to the omission from the gridded data set of a small number of sites (<1%) with clear urban-related warming trends. In a worldwide set of about 270 stations, Parker (2004, 2006) noted that warming trends in night minimum temperatures over the period 1950 to 2000 were not enhanced on calm nights, which would be the time most likely to be affected by urban warming. Thus, the global land warming trend discussed is very unlikely to be influenced significantly by increasing urbanisation (Parker, 2006). ... Accordingly, this assessment adds the same level of urban warming uncertainty as in the TAR: 0.006°C per decade since 1900 for land, and 0.002°C per decade since 1900 for blended land with ocean, as ocean UHI is zero.[131]
A 2014 study published in the Proceedings of the National Academy of Sciences of the United States of America looks at the potential of large-scale urban adaptation to counteract the effects of long-term global climate change. The researchers calculate that without any adaptive urban design, by 2100 the expansion of existing U.S. cities into regional megalopolises could raise near-surface temperatures between 1 and 2 °C (1.8 and 3.6 °F) over large regions, "a significant fraction of the 21st-century greenhouse gas-induced climate change simulated by global climate models." Large-scale adaptive design could completely offset this increase, however. For example, the temperature increase in California was calculated to be as high as 1.31 °C (2.36 °F), but a 100% deployment of "cool roofs" would result in a temperature drop of 1.47 °C (2.65 °F)—more than the increase.[132]
Urban cold island
The same urban area that is hotter in the day can be colder than surrounding rural areas at ground level at night, leading to a new term urban cold island. Snow cover in rural areas, for example, insulates plants. This was an unexpected discovery when studying the response of plants to urban environments.[133] The urban cold island effect takes place in the early morning because the building within cities block the sun's solar radiation, as well as the wind speed within the urban centre. Both the urban heat island and urban cold island effects are most intense at times of stable meteorological conditions.[134] Several other studies have observed the urban cool island in semi-arid or arid regions. The reason for this phenomenon is the availability of water and vegetation in the urban region as compared to the surroundings.[8]
See also
- Anthropogenic heat
- Cool roof
- Urban climatology
- Urban dust dome
- Urban reforestation
- Urban thermal plume
References
- Solecki, William D.; Rosenzweig, Cynthia; Parshall, Lily; Pope, Greg; Clark, Maria; Cox, Jennifer; Wiencke, Mary (2005). "Mitigation of the heat island effect in urban New Jersey". Global Environmental Change Part B: Environmental Hazards. 6 (1): 39–49. doi:10.1016/j.hazards.2004.12.002.
- United States Environmental Protection Agency (2008). Reducing urban heat islands: Compendium of strategies (Report). pp. 7–12.
- Li, Y.; Zhao, X. (2012). "An empirical study of the impact of human activity on long-term temperature change in China: A perspective from energy consumption". Journal of Geophysical Research. 117 (D17): D17117. Bibcode:2012JGRD..11717117L. doi:10.1029/2012JD018132.
- Glossary of Meteorology (2019). "Urban Heat Island". American Meteorological Society. Retrieved 2019-04-12.
- T. Chakraborty and X. Lee (2019). "A simplified urban-extent algorithm to characterize surface urban heat islands on a global scale and examine vegetation control on their spatiotemporal variability". International Journal of Applied Earth Observation and Geoinformation. 74: 269–280. Bibcode:2019IJAEO..74..269C. doi:10.1016/j.jag.2018.09.015.
- Luke Howard, The climate of London, deduced from Meteorological observations, made at different places in the neighbourhood of the metropolis, 2 vol., London, 1818–20
- T. R. Oke (1982). "The energetic basis of the urban heat island". Quarterly Journal of the Royal Meteorological Society. 108 (455): 1–24. Bibcode:1982QJRMS.108....1O. doi:10.1002/qj.49710845502.
- Kumar, Rahul; Mishra, Vimal; Buzan, Jonathan; Kumar, Rohini; Shindell, Drew; Huber, Matthew (2017-10-25). "Dominant control of agriculture and irrigation on urban heat island in India". Scientific Reports. 7 (1): 14054. doi:10.1038/s41598-017-14213-2. ISSN 2045-2322. PMC 5656645. PMID 29070866.
- Larsson, Naomi (10 May 2018). "US cities losing 36 million trees a year, researchers find". The Guardian. Retrieved 10 May 2018.
- Santos, Fabiane. Trees – the Natural Air Conditioners. Scientific Scribbles. The University of Melbourne, 23 Aug. 2013. Web. 27 Sept. 2013
- United States. NASA. Air Pollution Prevention Through Urban Heat Island Mitigation: An Update on the Urban Heat Island Pilot Project. By Virginia Gorsevski, Haider Taha, Dale Quattrochi, and Jeff Luvall. N.p.: n.p., n.d. Print.
- Sailor, D. J. (2011). "A review of methods for estimating anthropogenic heat and moisture emissions in the urban environment". International Journal of Climatology. 31 (2): 189–199. Bibcode:2011IJCli..31..189S. doi:10.1002/joc.2106.
- Chen, F.; Kusaka, H.; Bornstein, R.; Ching, J.; Grimmond, C. S. B.; Grossman-Clarke, S.; Loridan, T.; Manning, K. W.; Martilli, A.; Miao, S.; Sailor, D.; Salamanca, F. P.; Taha, H.; Tewari, M.; Wang, X.; Wyszogrodzki, A. A.; Zhang, C. (2011). "The integrated WRF/urban modelling system: Development, evaluation, and applications to urban environmental problems". International Journal of Climatology. 31 (2): 273. Bibcode:2011IJCli..31..273C. doi:10.1002/joc.2158.
- Union of Concerned Scientists. "Rising Temperatures, Worsening Ozone Pollution." Climate Change and Your Health (2011): n. pag. Print.
- Imyunku (2009). "Learning About Urban Heat Islands". Pusan National University. Retrieved 2009-06-18.
- Hinkel, Kenneth M. (March 2003). "Barrow Urban Heat Island Study". Department of Geography, University of Cincinnati. Retrieved 2007-08-02.
- United States. Environmental Protection Agency. Heat Island Effect. By EPA. N.p., 29 August 2013. Web. 31 August 2015. <http://www.epa.gov/heatisld/about/index.htm>.
- Raj, Sarath; Paul, Saikat Kumar; Chakraborty, Arun; Kuttippurath, Jayanarayanan (2020-03-01). "Anthropogenic forcing exacerbating the urban heat islands in India". Journal of Environmental Management. 257: 110006. doi:10.1016/j.jenvman.2019.110006. ISSN 0301-4797. PMID 31989962.
- T. Chakraborty; C. Sarangi; S. N. Tripathi (2017). "Understanding Diurnality and Inter-Seasonality of a Sub-tropical Urban Heat Island". Boundary-Layer Meteorology. 163 (2): 287–309. Bibcode:2017BoLMe.163..287C. doi:10.1007/s10546-016-0223-0.CS1 maint: multiple names: authors list (link)
- IPCC (2001). "Climate Change 2001: The Scientific Basis. Chapter 2.2 How Much is the World Warming?". Archived from the original on 2009-06-12. Retrieved 2009-06-18.
- M. Carmen Moreno-garcia (1993-10-28). "Intensity and form of the urban heat island in barcelona". International Journal of Climatology. 14 (6): 705–710. Bibcode:1994IJCli..14..705M. doi:10.1002/joc.3370140609.
- Keith C. Heidorn (2009). "Luke Howard: The Man Who Named The Clouds". Islandnet.com. Retrieved 2009-06-18.
- M. Roth; T. R. Oke & W. J. Emery (1989). "Satellite-derived urban heat islands from three coastal cities and the utilization of such data in urban climatology". International Journal of Remote Sensing. 10 (11): 1699–1720. Bibcode:1989IJRS...10.1699R. doi:10.1080/01431168908904002.
- H.-Y. Lee (1993). "An application of NOAA AVHRR thermal data to the study or urban heat islands". Atmospheric Environment. 27B (1): 1–13. Bibcode:1993AtmEB..27....1L. doi:10.1016/0957-1272(93)90041-4.
- I. Camilloni & V. Barros (1997). "On the urban heat island effect dependence on temperature trends". Climatic Change. 37 (4): 665–681. doi:10.1023/A:1005341523032.
- C.J.G. (Jon) Morris (2006-07-09). "Urban Heat Islands and Climate Change – Melbourne, Australia". University of Melbourne, Victoria, Australia. Archived from the original on March 10, 2009. Retrieved 2009-06-18.
- Swaid, Hanna (1991). "Nocturnal variation of air-surface temperature gradients for typical urban and rural surfaces". Atmospheric Environment. Part B. Urban Atmosphere. 25 (3): 333–341. Bibcode:1991AtmEB..25..333S. doi:10.1016/0957-1272(91)90005-Y.
- Steeneveld, G.J. (2011). "Quantifying urban heat island effects and human comfort for cities of variable size and urban morphology in the Netherlands". Journal of Geophysical Research. 116 (D20): D20129. Bibcode:2011JGRD..11620129S. doi:10.1029/2011JD015988.
- Kershaw, T. J.; Sanderson, M.; Coley, D.; Eames, M. (2010). "Estimation of the urban heat island for UK climate change projections". Building Services Engineering Research and Technology. 31 (3): 251–263. doi:10.1177/0143624410365033.
- Theeuwes, N. E.; Steeneveld, G.J.; Ronda, R.J.; Holtslag, A.A.M. (2017). "A diagnostic equation for the daily maximum urban heat island effect for cities in northwestern Europe". International Journal of Climatology. 37 (1): 443–454. Bibcode:2017IJCli..37..443T. doi:10.1002/joc.4717.
- Myrup, Leonard O. (1969). "A Numerical Model of the Urban Heat Island". Journal of Applied Meteorology. 8 (6): 908–918. Bibcode:1969JApMe...8..908M. doi:10.1175/1520-0450(1969)008<0908:ANMOTU>2.0.CO;2.
- Michael J. Angilletta Jr mail, Robbie S. Wilson, Amanda C. Niehaus, Michael W. Sears, Carlos A. Navas, Pedro L. Ribeiro (February 2007). "Urban Physiology: City Ants Possess High Heat Tolerance". PLOS ONE. 2 (2): e258. Bibcode:2007PLoSO...2..258A. doi:10.1371/journal.pone.0000258. PMC 1797824. PMID 17327918.CS1 maint: multiple names: authors list (link)
- Shochat, Eyal; Warren, Paige S.; Faeth, Stanley H.; Mclntyre, Nancy E.; Hope, Diane (April 2006). "From Patterns to Emerging Processes in Mechanistic Urban Ecology". Trends in Ecology & Evolution. 21 (4): 186–91. doi:10.1016/j.tree.2005.11.019. PMID 16701084.
- Shochat, Eyal; Warren, Paige S.; Faeth, Stanley H.; Mclntyre, Nancy E.; Hope, Diane (April 2006). "From Patterns to Emerging Processes in Mechanistic Urban Ecology". Trends in Ecology & Evolution. 21 (4): 186–91. doi:10.1016/j.tree.2005.11.019. PMID 16701084.
- "Islands in the Sun". Institute on the Environment. University of Minnesota.
- Tang, Teri (2014-06-05). "Where are the Insects?". School of Life Sciences. Arizona State University. Retrieved 19 October 2014.
- McDonnell, Mark J. (1997). "Ecosystem processes along an urban-to-rural gradient". Urban Ecosystems. 1: 26.
- Arizona Board of Regents (2006). "Urban Climate – Climate Study and UHI via the Internet Wayback Machine". Arizona State University. Archived from the original on 2007-11-23. Retrieved 2007-08-02.
- Chiel C. van Heerwaarden & J. Vilà-Guerau de Arellano (2008). "Relative humidity as an indicator for cloud formation over heterogeneous land surfaces". Journal of the Atmospheric Sciences. 65 (10): 3263–3277. Bibcode:2008JAtS...65.3263V. doi:10.1175/2008JAS2591.1.
- Fuchs, Dale (2005-06-28). "Spain goes hi-tech to beat drought". The Guardian. Retrieved 2007-08-02.
- Goddard Space Flight Center (2002-06-18). "NASA Satellite Confirms Urban Heat Islands Increase Rainfall Around Cities". National Aeronautics and Space Administration. Archived from the original on June 12, 2008. Retrieved 2009-07-17.
- "Myths and Misconceptions about Tornadoes". Tornado Project. 1999. Archived from the original on 2005-11-14. Retrieved 2008-06-24.
- Gretchen Cook-Anderson (2004-06-29). "Urban Heat Islands Make Cities Greener". NASA. Retrieved 2007-08-02.
- Huang, Q.; Lu, Y. (2015). "The Effect of Urban Heat Island on Climate Warming in the Yangtze River Delta Urban Agglomeration in China". International Journal of Environmental Research and Public Health. 12 (8): 8773–8789. doi:10.3390/ijerph120808773. PMC 4555247. PMID 26225986.
- Z.-C. Zhao (2011) Impacts of urbanization on climate change, 10,000 Scientific Difficult Problems: Earth Science (in Chinese), 10,000 scientific difficult problems Earth Science Committee Eds, 2011, Science Press, pp. 843–846
- Peterson, T.C.; Gallo, K.P.; Lawrimore, J.; Owen, T.W.; Huang, A.; McKittrick, D.A. (1999). "Global rural temperature trends". Geophysical Research Letters. 26 (3): 329–332. Bibcode:1999GeoRL..26..329P. doi:10.1029/1998GL900322.
- Zhou, Decheng; Zhao, Shuqing; Zhang, Liangxia; Sun, Ge; Liu, Yongqiang (10 June 2015). "The footprint of urban heat island effect in China". Scientific Reports. 5: 11160. Bibcode:2015NatSR...511160Z. doi:10.1038/srep11160. PMC 4461918. PMID 26060039.
- J. Zhang, Guang; Cai, Ming; Hu, Aixue (27 January 2013). "Energy consumption and the unexplained winter warming over northern Asia and North America". Nature Climate Change. 3 (5): 466–470. Bibcode:2013NatCC...3..466Z. doi:10.1038/nclimate1803.
- Sachindra, D. A., Ng, A. W. M., Muthukumaran, S., & Perera, B. J. C. (July 2015). Impact of Climate Change on Urban Heat Island Effect and Extreme Temperatures: A Case Study. Quarterly Journal of the Royal Meteorological Society
- S. A. Changnon, Jr.; K. E. Kunkel & B. C. Reinke (1996). "Impacts and responses to the 1995 heat wave: A call to action". Bulletin of the American Meteorological Society. 77 (7): 1497–1506. Bibcode:1996BAMS...77.1497C. doi:10.1175/1520-0477(1996)077<1497:IARTTH>2.0.CO;2.
- R. W. Buechley; J. Van Bruggen & L. E. Trippi (1972). "Heat island = death island?". Environmental Research. 5 (1): 85–92. Bibcode:1972ER......5...85B. doi:10.1016/0013-9351(72)90022-9. PMID 5032927.
- J. F. Clarke (1972). "Some effects of the urban structure on heat mortality". Environmental Research. 5 (1): 93–104. Bibcode:1972ER......5...93C. doi:10.1016/0013-9351(72)90023-0. PMID 5032928.
- Robert E. Davis; Paul C. Knappenberger; Patrick J. Michaels & Wendy M. Novicoff (November 2003). "Changing heat-related mortality in the United States". Environmental Health Perspectives. 111 (14): 1712–1718. doi:10.1289/ehp.6336. PMC 1241712. PMID 14594620.
- Kovats, R. Sari; Hajat, Shakoor (April 2008). "Heat Stress and Public Health: A Critical Review". Annual Review of Public Health. 29 (1): 41–55. doi:10.1146/annurev.publhealth.29.020907.090843. PMID 18031221.
- Koppe, Christina; Sari Kovats; Gerd Jendritzky; Bettina Menne (2004). "Heat-waves: risks and responses". Health and Global Environmental Change Series. 2.
- Hancock, P. A.; Vasmatzidis, I. (January 2003). "Research Article". International Journal of Hyperthermia. 19 (3): 355–372. CiteSeerX 10.1.1.464.7830. doi:10.1080/0265673021000054630. PMID 12745975.
- "Assessment of International Urban Heat Island Research" (PDF). U.S. Department of Energy Report. Navigant Consulting. Retrieved 30 April 2014.
- "Heat-Related Morbidity and Mortality". U.S. Center for Disease Control. USA Government. Retrieved 30 April 2014.
- Díaz, J.; Jordán, A.; García, R.; López, C.; Alberdi, J.; Hernández, E.; Otero, A. (1 February 2014). "Heat waves in Madrid 1986–1997: effects on the health of the elderly". International Archives of Occupational and Environmental Health. 75 (3): 163–170. doi:10.1007/s00420-001-0290-4. PMID 11954983.
- Harlan, Sharon L.; Brazel, Anthony J.; Prashad, Lela; Stefanov, William L.; Larsen, Larissa (December 2006). "Neighborhood microclimates and vulnerability to heat stress". Social Science & Medicine. 63 (11): 2847–2863. doi:10.1016/j.socscimed.2006.07.030. PMID 16996668.
- Zhu, Pengyu; Zhang Yaoqui (2008). "Demand for Urban Forests in United States Cities". Landscape and Urban Planning. 84 (3–4): 293–300. CiteSeerX 10.1.1.543.6302. doi:10.1016/j.landurbplan.2007.09.005.
- De Chant, Tim. "Urban Trees Reveal Income Inequality". Per Square Mile. doi:10.1016/j.landurbplan.2007.09.005. Retrieved 7 May 2014. Cite journal requires
|journal=(help) - "Top 22 Benefits of Trees". Tree People. Retrieved 7 July 2014.
- "Trees and Vegetation". EPA.gov. 2014-02-28. Retrieved 7 July 2014.
- Chant, Tim. "Urban Trees reveal income inequality". Per Square Mile. doi:10.1016/j.landurbplan.2007.09.005. Retrieved 7 July 2014.
- NYS DEC. "Streams Tributary to Onondaga Lake Biological Assessment." Dec.ny.gov. N.p., 2008. Web. 12 September 2013.
- Paul A. Tipler & Gene Mosca (2007). Physics for Scientists and Engineers. Macmillan. p. 686. ISBN 978-1-4292-0124-7.
- "Urban Climate – Climate Study and UHI". United States Environmental Protection Agency. 2009-02-09. Retrieved 2009-06-18.
- "Cool Pavement Report" (PDF). Environmental Protection Agency. June 2005. pp. 21, 43. Retrieved 2013-01-15.
- Sheng-chieh Chang (2000-06-23). "Energy Use". Environmental Energies Technology Division. Archived from the original on March 11, 2009. Retrieved 2009-06-18.
- "Aging and Weathering of Cool Roofing Membranes" (PDF). Cool Roofing Symposium. 2005-08-23. Retrieved 2010-08-16.
- Albers, R. A. W., Bosch, P. R., Blocken, B., Van Den Dobbelsteen, A. A. J. F., Van Hove, L. W. A., Spit, T. J. M., ... & Rovers, V. (2015). Overview of challenges and achievements in the Climate Adaptation of Cities and in the Climate Proof Cities program. Building and environment, 83, 1–10.
- "Comprehensive Cool Roof Guide from the Vinyl Roofing Division of the Chemical Fabrics and Film Association". Archived from the original on 2013-09-21.
- "Cool Pavement Report" (PDF). Environmental Protection Agency. June 2005. p. 14. Retrieved 2009-02-06.
- Al Gore; A. Steffen (2008). World Changing: A User's Guide for the 21st Century. New York: Abrams. p. 258.
- Yaghoobian, N.; Kleissl, J. (2012). "Effect of reflective pavements on building energy use". Urban Climate. 2: 25–42. doi:10.1016/j.uclim.2012.09.002.
- Yang, Jiachuan; Wang, Zhihua; Kaloush, Kamil E. (October 2013), Unintended Consequences: A Research Synthesis Examining the Use of Reflective Pavements to Mitigate the Urban Heat Island Effect (PDF), Tempe, Arizona: NCE SMART Innovations, retrieved 2013-11-25
- "Green (Planted) Roofs". Retrieved 2010-08-07.
- New York City Regional Heat Island Initiative (October 2006). "Mitigating New York City's Heat Island With Urban Forestry, Living Roofs, and Light Surfaces" (PDF). New York State Energy Research and Development Authority. p. ii. Retrieved 2009-06-18.
- Arthur Rosenfeld; Joseph Romm; Hashem Akbari; Alana Lloyd (February–March 1997). "Painting the Town White – and Green". MIT Technology Review. Archived from the original on 2007-07-14. Retrieved 2007-09-29.
- Zinzi, M., and S. Agnoli. "Cool and green roofs. An energy and comfort comparison between passive cooling and mitigation urban heat island techniques for residential buildings in the Mediterranean region." Energy and Buildings. 55. (2012): 66–76. Print.
- Rosenfield, Arthur, Joseph Romm, Hashem Akbari, and Alana Lloyd. "Painting the Town White – and Green." MIT Technology Review. N.p., 14 07 1997. Web. 25 Feb 2014.
- AB 32 Scoping Plan." Scoping Plan. N.p., n.d. Web. 06 Apr. 2014
- "California's Advanced Clean Cars Program." Advanced Clean Cars. N.p., n.d. Web. 06 Apr. 2014.
- "California Renewables Portfolio Standard (RPS)." California Publics Utilities Commission. N.p., n.d. Web. 06 Apr. 2014
- "Low Carbon Fuel Standard." Low Carbon Fuel Standard. N.p., n.d. Web. 06 Apr. 2014
- "Cap-and-Trade Program." Air Resources Board. N.p., n.d. Web. 06 Apr. 2014.
- "Reducing Urban Heat Islands: Compendium of Strategies | Heat Island Effect | US EPA." EPA. Environmental Protection Agency, n.d. Web. 16 Apr. 2014.
- "Roadmap for Incorporating Energy Efficiency/Renewable Energy Policies and Programs into State and Tribal Implementation Plans." US EPA." EPA. Environmental Protection Agency, July 2012 n.d. Web. 15 Apr. 2014. (missing url)
- "Incorporating Emerging And Voluntary Measures In A State Implementation Plan (SIP). EPA. Environmental Protection Agency, September 2004. Web. 12 Apr. 2014.
- Page, Stephen, "Guidance on Incorporating Bundled Measures in a State Implementation Plan." EPA. Environmental Protection Agency, 16 Aug. 2005 Web. 12 Apr. 2014.
- AB 32 Scoping Plan." Scoping Plan. N.p., n.d. Web. 06 Apr. 2014.
- "Reducing Urban Heat Islands: Compendium of Strategies | Heat Island Effect | US EPA." EPA. Environmental Protection Agency, n.d. Web. 06 Apr. 2014.
- "SMUD." SMUD Video Player. N.p., n.d. Web. 06 Apr. 2014.
- Ecoroof Incentive Program." Live Green Toronto, n.d. Web.
- "TreeVitalize." TreeVitalize. N.p., n.d. Web. 06 Apr. 2014. (Missing url)
- "About." TreeUtah. N.p., n.d. Web. 06 Apr. 2014. (missing url)
- "Global Systems Science." Global Systems Science. N.p., 2012. Web. 06 Apr. 2014. (missing url)
- "Indigenous Tree Program." City of Glendale, CA :. N.p., n.d. Web. 06 Apr. 2014.
- "Tree Protection Program - City of Berkeley, CA." Planning and Development-City of Berkeley, CA. N.p., n.d. Web. 06 Apr. 2014.
- "City of Visalia - Street Tree Ordinance." Street Tree Ordinance. N.p., n.d. Web. 06 Apr. 2014.
- Maller, C. "Healthy Nature Healthy People: 'contact with Nature' as an Upstream Health Promotion Intervention for Populations." Health Promotion International 21.1 (2005): 45–54. Print.
- Ulrich, R (1984). "View through a Window May Influence Recovery from Surgery". Science. 224 (4647): 420–21. Bibcode:1984Sci...224..420U. CiteSeerX 10.1.1.669.8732. doi:10.1126/science.6143402. PMID 6143402.
- Wilmsen, Carl. Partnerships for Empowerment: Participatory Research for Community-based Natural Resource Management. London: Earthscan, 2008. Print.
- Dunnett, Nigel. Small Green Roofs: Low-tech Options for Greener Living. Portland, Or.: Timber, 2011. Print.
- Hilltop Arboretum. "Nature the Changing Climate and You: Act Locally!" 5.4 (2007). Web
- McPherson, Gregory, James Simpson, Paula Peper, Shelley Gardner, Kelaine Vargas, Scott Maco, and Qingfu Xiao. "Coastal Plain Community Tree Guide: Benefits, Costs, and Strategic Planting". USDA, Forest Service, Pacific Southwest Research Station. (2006). Web. (missing url)
- He, B. J., Zhu, J., Zhao, D. X., Gou, Z. H., Qi, J. D., & Wang, J. (2019). Co-benefits approach: Opportunities for implementing sponge city and urban heat island mitigation. Land use policy, 86, 147-157.
- "Voluntary Green Building Programs". Archived from the original on 2012-03-21.
- "LEED 2009 for New Construction and Major Renovations Rating System". US Green Building Council. November 2008. Retrieved 2010-08-17.
- "Green Globes". Archived from the original on 2012-03-21. Retrieved 2011-07-27.
- He, B. J. (2019). Towards the next generation of green building for urban heat island mitigation: Zero UHI impact building. Sustainable Cities and Society, 101647.
- Rosenfeld, Arthur H., et al. "Cool communities: strategies for heat island mitigation and smog reduction." Energy and Buildings 28.1 (1998): 51–62.
- Carter, Timothy; Keeler, Andrew (2008). "Life-cycle cost–benefit analysis of extensive vegetated roof systems". Journal of Environmental Management. 87 (3): 350–363. doi:10.1016/j.jenvman.2007.01.024. PMID 17368704.
- Kats, Gregory. Green building costs and financial benefits. Boston, MA: Massachusetts Technology Collaborative, 2003.
- T. C. Peterson (2003). "Assessment of Urban Versus Rural In Situ Surface Temperatures in the Contiguous United States: No Difference Found" (PDF). Journal of Climate. 16 (18): 2941–2959. Bibcode:2003JCli...16.2941P. doi:10.1175/1520-0442(2003)016<2941:AOUVRI>2.0.CO;2.
- J. Hansen; R. Ruedy; M. Sato; M. Imhoff; W. Lawrence; D. Easterling; T. Peterson & T. Karl (2001). "A closer look at United States and global surface temperature change". Journal of Geophysical Research. 106 (D20): 239–247. Bibcode:2001JGR...10623947H. doi:10.1029/2001JD000354.
- D. E. Parker (2004). "Climate: Large-scale warming is not urban". Nature. 432 (7015): 290. Bibcode:2004Natur.432..290P. doi:10.1038/432290a. PMID 15549087.
- David E. Parker (2006). "A demonstration that large-scale warming is not urban" (PDF). Journal of Climate. 19 (12): 2882–2895. Bibcode:2006JCli...19.2882P. CiteSeerX 10.1.1.543.2675. doi:10.1175/JCLI3730.1.
- Parker, David E. (2004). "Large-scale warming is not urban" (PDF). Nature. 432 (7015): 290. Bibcode:2004Natur.432..290P. doi:10.1038/432290a. PMID 15549087. Archived from the original (PDF) on September 28, 2007. Retrieved 2007-08-02.
- Black, Richard (2004-11-18). "Climate change sceptics 'wrong'". BBC News. Retrieved 2007-08-02.
- McKitrick, R.R.; Michaels, P.J. (2007). "Quantifying the influence of anthropogenic surface processes and inhomogeneities on gridded global climate data" (PDF). J. Geophys. Res. 112 (D24): D24S09. Bibcode:2007JGRD..11224S09M. doi:10.1029/2007JD008465.
- Non-technical summary of M&M 2007 by McKitrick
- Schmidt, G. A. (2009). "Spurious correlations between recent warming and indices of local economic activity". International Journal of Climatology. 29 (14): 2041–2048. Bibcode:2009IJCli..29.2041S. doi:10.1002/joc.1831.
- Ross McKitrick; Nicolas Nierenberg (2010-01-01). "Socioeconomic patterns in climate data". Journal of Economic and Social Measurement. 35 (3): 149–175. doi:10.3233/JEM-2010-0336.. Also see for a non-technical summary, and comments on the publication delay.
- Jeff Tollefson (2011-10-20). "Different method, same result: global warming is real". Nature News. doi:10.1038/news.2011.607. Retrieved 2011-10-22.
- "Cooling the Warming Debate: Major New Analysis Confirms That Global Warming Is Real". Science Daily. 2011-10-21. Retrieved 2011-10-22.
- Ian Sample (2011-10-20). "Global warming study finds no grounds for climate sceptics' concerns". The Guardian. Retrieved 2011-10-22.
- Richard Black (2011-10-21). "Global warming 'confirmed' by independent study". BBC News. Retrieved 2011-10-21.
- "Climate change: The heat is on". The Economist. 2011-10-22. Retrieved 2011-10-22.
- Kevin E. Trenberth; Philip D. Jones; Peter Ambenje; Roxana Bojariu; David Easterling; Albert Klein Tank; David Parker; Fatemeh Rahimzadeh; James A. Renwick; Matilde Rusticucci; Brian Soden & Panmao Zhai (2007). "IPCC Fourth Assessment Report - Chapter 3 - Observations: Surface and Atmospheric Climate Change" (PDF). Intergovernmental Panel on Climate Change. p. 244. Retrieved 2009-06-27.
- Georgescu, Matei; Morefield, Philip E.; Bierwagen, Britta G.; Weaver, Christopher P. (2014). "Urban Adaptation Can Roll Back Warming of Emerging Megapolitan Regions". Proceedings of the National Academy of Sciences of the United States of America. 111 (8): 2909–2914. Bibcode:2014PNAS..111.2909G. doi:10.1073/pnas.1322280111. PMC 3939866. PMID 24516126. Lay summary – JournalistsResource.org.
- ""Urban cold islands" driving plant evolution in cities".
- Feliciano, Manuel; Rocha, Alfredo; Maia, Filipe; Castro Ribeiro, António; Ornellas, Gabriella; Gonçalves, Artur (September 2018). "Urban Cold and Heat Island in the City of Bragança (Portugal)". Climate. 6 (3): 70. doi:10.3390/cli6030070.
Further reading
- Arnfield, A. John (1 January 2003). "Two decades of urban climate research: a review of turbulence, exchanges of energy and water, and the urban heat island". International Journal of Climatology. 23 (1): 1–26. Bibcode:2003IJCli..23....1A. doi:10.1002/joc.859.
- Gartland, Lisa (2008). Heat islands: understanding and mitigating heat in urban areas. London: Earthscan. ISBN 9781844072507.
- P. D. Jones; P.Y. Groisman; M. Coughlan; N. Plummer; W.-C. Wang; T.R. Karl (1990). "Assessment of urbanization effects in time series of surface air temperature over land". Nature. 347 (6289): 169–172. Bibcode:1990Natur.347..169J. doi:10.1038/347169a0.
- Helmut E. Landsberg (1981). The Urban Climate. New York: Academic Press. ISBN 978-0-12-435960-4.
- Hagan, Thomas (2015). "What's Hot at UCF: A UHI Study". University of Central Florida Department of Biology, Landscape and Natural Resources, Urban Heat Study.
- J. Khodakarami; M.Hatami (2016). Heat Island: A New Variable In Architecture and Urbanism. Tehran, In Persian: Fekreno Book.
External links
| Wikimedia Commons has media related to Urban heat islands. |
- Lawrence Berkeley National Laboratory Heat Island Group
- The Surface Temperature Record and the Urban Heat Island From RealClimate.org
- UrbanHeatIslands.com – Urban Heat islands in Canada and the world
- Cool Roof and Pavement Toolkit
- Global Cool Cities Alliance
| |||||||||||||
| |||||||||||||
| |||||||||||||
| |||||||||||||
| |||||||||||||
| |||||||||||||
| |||||||||||||
| Authority control |
|
|---|