Tropical cyclones in 2019
During 2019, tropical cyclones formed within seven different tropical cyclone basins, located within various parts of the Atlantic, Pacific and Indian Oceans. During the year, a total of 150 systems formed with 102 of these developing further and were named by the responsible warning centre. The strongest tropical cyclone of the year was Typhoon Halong, which was estimated to have a minimum barometric pressure of 905 hPa (26.72 inHg). Hurricane Dorian has the highest wind-speed, with 1-minute sustained wind speed of 185 mph (295 km/h).
| Tropical cyclones in 2019 | |
|---|---|
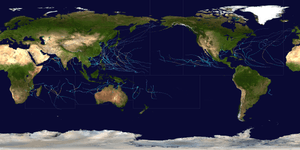 Year summary map | |
| Year boundaries | |
| First system | Mona |
| Formed | December 28, 2018 |
| Last system | Sarai |
| Dissipated | January 2, 2020 |
| Strongest system | |
| Name | Halong 1 |
| Lowest pressure | 905 mbar/hPa; 26.72 inHg |
| Longest lasting system | |
| Name | Oma |
| Duration | 15 days |
| Year statistics | |
| Total systems | 150 |
| Named systems | 102 |
| Total fatalities | 2,096 total |
| Total damage | > $60.87 billion (2019 USD) |
.jpg)
Similar to the previous year, 2019 was above average in terms of the number of storms. The most active basin in the year was the Western Pacific, which documented 29 named systems. The Eastern Pacific had an average season, although many of the storms were rather weak and short-lived, therefore the number of hurricanes was the least since 2010 (7). The North Atlantic hurricane season experienced an above average number of tropical storm intensity systems, numbering 18, though most were rather weak and short-lived, especially late in the season. In the North Indian Ocean basin it was extremely active, breaking many records. This included Cyclone Kyarr, the strongest Arabian Sea Cyclone on record and second strongest ever in the North Indian Ocean. Activity across the southern hemisphere's three basins - South-West Indian, Australian, and South Pacific - was fairly significant, with the regions recording 25 named storms altogether, with the most intense Southern Hemisphere cyclone of the year, Cyclone Ambali from the Southwest Indian Ocean basin peaking at 155 mph (250 km/h) and 930 millibars.
The deadliest tropical cyclone of the year was Intense Tropical Cyclone Idai in the South-West Indian Ocean, which killed at least 1,303 people in Mozambique, Malawi, Zimbabwe, and Madagascar and the costliest tropical cyclone of the year was Typhoon Hagibis in the Western Pacific Ocean, which caused more than $15 billion in damage after striking Japan.
Global atmospheric and hydrological conditions
Summary
Systems
January
The month of January was inactive, with only eight tropical cyclones forming, of which five were named. However, Tropical Storm Pabuk[1] was the earliest-forming tropical storm of the western Pacific Ocean on record, breaking the previous record held by Typhoon Alice in 1979. Pabuk killed 10 people in Vietnam, Thailand and Malaysia, causing $151 million (US$2019) in damage.[2] Moderate Tropical Storm Eketsang killed 27 people in Madagascar in late-January.
| Storm name | Dates active | Max wind km/h (mph) |
Pressure (hPa) |
Areas affected | Damage (USD) |
Deaths | Refs |
|---|---|---|---|---|---|---|---|
| Mona | December 28 – January 9 | 95 (60) | 985 | Solomon Islands, Fiji, Tonga | Minimal | None | |
| Pabuk | December 31 – January 7 | 85 (50) | 994 | Natuna Islands, Vietnam, Malaysia, Thailand, Myanmar, Andaman Islands | $151 million | 10 | [3][4] |
| 01W (Amang) | January 4 – 22 | 55 (35) | 1004 | Kiribati, Marshall Islands, Caroline Islands, Philippines | $4.11 million | 9 | [5] |
| 11U | January 15 – 23 | Unspecified | 1004 | Java | None | None | |
| Desmond | January 17 – 22 | 65 (40) | 995 | Mozambique, Madagascar | Unknown | None | |
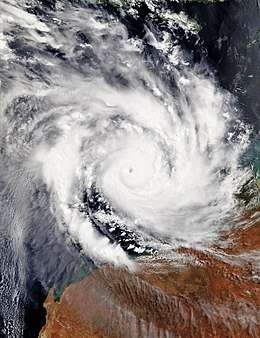
| Riley | January 19 – 30 | 120 (75) | 974 | Maluku Islands, East Timor, West Australia | None | None | |
| 13U | January 21 – 25 | 55 (35) | 999 | Cape York Peninsula | None | None | |
| Eketsang | January 22 – 24 | 75 (45) | 993 | Madagascar | Unknown | 27 | |
February
The month of February was inactive, with only ten tropical cyclones forming, of which seven were named. However, Typhoon Wutip became the most-intense typhoon recorded in the month of February.[6][7]
| Storm name | Dates active | Max wind km/h (mph) |
Pressure (hPa) |
Areas affected | Damage (USD) |
Deaths | Refs |
|---|---|---|---|---|---|---|---|
| Funani | February 3 – 10 | 195 (120) | 940 | Rodrigues | None | None | |
| 06F | February 3 – 9 | 65 (40) | 994 | Wallis and Futuna, Samoan Islands | None | None | |
| Gelena | February 4 – 14 | 205 (125) | 942 | Madagascar, Mauritius, Rodrigues | $1.02 million | None | |
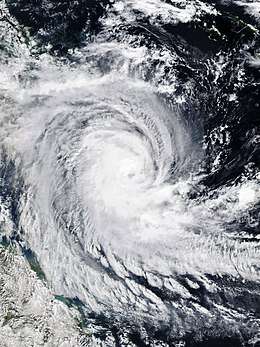
| Oma | February 7 – 22 | 130 (80) | 974 | Vanuatu, New Caledonia, Solomon Islands, Queensland, New South Wales | $51 million | 1 | |
| Neil | February 8 – 10 | 65 (40) | 994 | Wallis and Futuna, Fiji, Tonga | None | None | |
| 08F | February 10 – 13 | Unspecified | 996 | Fiji, Tonga | None | None | |
| 10F | February 11 – 13 | Unspecified | 996 | Wallis and Futuna, Fiji | None | None | |
| Wutip (Betty) | February 18 – March 2 | 195 (120) | 920 | Caroline Islands, Guam | $3.3 million | None | |
| Pola | February 23 – March 2 | 165 (105) | 950 | Wallis and Futuna, Fiji, Tonga | None | None | |
| Haleh | February 28 – March 7 | 175 (110) | 945 | None | None | None | |
March
Ten tropical cyclones formed in the month of March, including six named tropical cyclones. A total of five systems strengthened into the equivalent of at least a Category 3 major hurricane on the Saffir Simpson hurricane wind scale (SSHWS)—the first such occurrence since September 2018. The month featured Cyclone Idai, which is currently the deadliest tropical cyclone of the year, responsible for 1,007 deaths in southern Africa.[8] Idai was also the costliest cyclone in the South-West Indian Ocean basin, inflicting more than $2 billion (USD) in damages.[9] Tropical Storm Iba became the first tropical cyclone to develop in the South Atlantic since Anita in 2010.
| Storm name | Dates active | Max wind km/h (mph) |
Pressure (hPa) |
Areas affected | Damage (USD) |
Deaths | Refs |
|---|---|---|---|---|---|---|---|
| Idai | March 4 – 16 | 195 (120) | 940 | Mozambique, Malawi, Madagascar, Zimbabwe | ≥$2 billion | 1,303 | [9][10] |
| 15U | March 6 – 11 | Unspecified | 1007 | Maluku Islands | None | None | |
| Savannah | March 7 – 20 | 175 (110) | 951 | Bali, Java, Christmas Island, Cocos (Keeling) Islands | >$7.5 million | 10 | |
| TL | March 13 – 14 | Unspecified | Unspecified | None | None | None | |
| 03W (Chedeng) | March 14 – 19 | Unspecified | 1006 | Palau, Philippines | $23,000 | None | |
| Trevor | March 15 – 26 | 175 (110) | 950 | Papua New Guinea, Queensland, Northern Territory | $710 thousand | None | |
| Veronica | March 18 – 31 | 215 (130) | 928 | Timor, Western Australia | $1.2 billion | None | [11] |
| Joaninha | March 18 – 30 | 185 (115) | 939 | Rodrigues | None | None | |
| Iba | March 23 – 28 | 85 (55) | 1006 | Brazil | None | None | |
| TL | March 31 – April 3 | Unspecified | 1005 | Southeastern Papua New Guinea | None | None | |
April


April was an inactive month with six cyclones forming, of which four were named. Cyclone Kenneth became the most intense tropical cyclone to make landfall in Mozambique on record.[12] Kenneth killed 48 people, of which 41 were killed in the country of Mozambique.[13] Cyclone Fani struck parts of India and Bangladesh, killing 72 people in Odisha,[14] 17 people in Bangladesh,[15] and 8 in Uttar Pradesh.[16]
| Storm name | Dates active | Max wind km/h (mph) |
Pressure (hPa) |
Areas affected | Damage (USD) |
Deaths | Refs |
|---|---|---|---|---|---|---|---|
| Wallace | April 1 – 16 | 120 (75) | 980 | Eastern Indonesia, Northern Territory, East Timor, Western Australia, Cocos (Keeling) Islands | None | None | |
| 22U | April 5 – 15 | 65 (40) | 1006 | New Guinea, Queensland, Northern Territory, Western Australia | None | None | |
| Kenneth | April 21 – 29 | 215 (130) | 934 | Seychelles, Madagascar, Comoros, Mozambique, Tanzania, Malawi | >$100 million | 50 | [13] |
| Lorna | April 21 – May 1 | 150 (90) | 964 | None | None | None | |
| TL | April 21 – 26 | 55 (35) | 1003 | Sumatra, Cocos (Keeling) Islands | None | None | |
| Fani | April 26 – May 4 | 215 (130) | 932 | Sri Lanka, Odisha,Andhra Pradesh, East India, Bangladesh, Bhutan | $8,12 billion[17][18] | 89 | [14][15][16] |
May
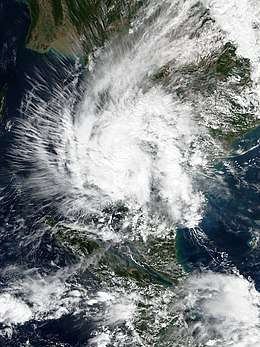
May was a relatively inactive month with eight tropical cyclones forming. Four of these tropical cyclones reached the required intensity threshold to receive official names. Cyclone Lili developed at the beginning of the Australian region off-season, and struck East Timor and Indonesia's Maluku Islands, with rainfall-induced flooding causing minor damage to infrastructure and residential property. Cyclone Ann, another off-season Australian system, developed into a strong tropical storm on the SSHWS, and made landfall in Far North Queensland as a tropical low. Ann was the strongest Australian cyclone to develop in May since Rhonda in 1997. A subtropical storm named Jaguar formed in the South Atlantic, marking the second South Atlantic cyclone of the year, the first time two have occurred in the same year since 2016. The formation of the short-lived Subtropical Storm Andrea to the southwest of Bermuda began the Atlantic hurricane season early for the fifth year in a row.
| Storm name | Dates active | Max wind km/h (mph) |
Pressure (hPa) |
Areas affected | Damage (USD) |
Deaths | Refs |
|---|---|---|---|---|---|---|---|
| Lili | May 4 – 11 | 75 (45) | 997 | Eastern Indonesia, East Timor, Top End, Kimberley | Moderate | None | |
| TD | May 7 – 8 | Unspecified | 1006 | Yap Islands, Palau | None | None | |
| TD | May 7 – 15 | Unspecified | 1004 | Caroline Islands | None | None | |
| Ann | May 7 – 18 | 95 (60) | 993 | Solomon Islands, New Caledonia, Southern Papua New Guinea, Queensland, Top End, Eastern Indonesia, East Timor | None | None | |
| TD | May 10 – 11 | Unspecified | 1006 | Yap Islands, Palau | None | None | |
| 12F | May 16 – 21 | 55 (35) | 1002 | None | None | None | |
| Jaguar | May 20 – 22 | 65 (40) | 1010 | Brazil | None | None | |
| Andrea | May 20 – 21 | 65 (40) | 1006 | Bermuda | None | None |
June

June was an inactive month in terms of the number of tropical cyclones formed, with only five systems occurring in total. June 1 also marked the official commencement of the Atlantic hurricane season. After the year's longest period without any cyclone activity, the first system in the Arabian Sea for the 2019 North Indian Ocean cyclone season formed on June 10. Named Vayu, the system intensified into a high-end very severe cyclonic storm on the Indian scale, equivalent to a minimal Category 3 major hurricane on the SSHWS. Late in the month, Hurricane Alvin became the first tropical cyclone of the Eastern Pacific hurricane season, marking the latest start to the season since reliable records began in 1971. A tropical depression briefly reached tropical storm intensity near Japan on 27 June, and was named Sepat. The cyclone was the first tropical storm to form in the western Pacific in four months.
| Storm name | Dates active | Max wind km/h (mph) |
Pressure (hPa) |
Areas affected | Damage (USD) |
Deaths | Refs |
|---|---|---|---|---|---|---|---|
| Vayu | June 10 – 19 | 150 (90) | 978 | Northern Maldives, Lakshadweep, Western India, Southeastern Pakistan | >$140 thousand | 8 | [19][20][21] |
| Sepat (Dodong) | June 17 – 28 | 75 (45) | 992 | Caroline Islands, Japan | None | None | |
| TD | June 26 | 55 (35) | 1000 | Ryukyu Islands, South Korea, Japan | None | None | |
| Alvin | June 25 – 29 | 120 (75) | 992 | Clarion Island | None | None | |
| 04W (Egay) | June 26 – July 1 | 55 (35) | 1006 | Caroline Islands, Palau | None | None | |
| Barbara | June 30 – July 6 | 250 (155) | 930 | None | None | None |
July
The month of July was the third most active month in terms of total tropical cyclones and in terms of named storms in the year, with thirteen tropical cyclones forming, of which ten were named, behind August. Among these storms, Hurricane Barry made landfall between Midwestern United States and Southeastern United States as tropical storm, causing $500 million (USD) in damages and one person was indirectly killed by the storm.
| Storm name | Dates active | Max wind km/h (mph) |
Pressure (hPa) |
Areas affected | Damage (USD) |
Deaths | Refs |
|---|---|---|---|---|---|---|---|
| Mun | July 1 – 4 | 65 (40) | 992 | Hainan, South China, Paracel Islands, Vietnam, Laos | $240 thousand | 2 | |
| Cosme | July 6 – 8 | 85 (50) | 1001 | None | None | None | |
| Barry | July 11 – 15 | 120 (75) | 991 | Midwestern United States, Southeastern United States, Gulf Coast of the United States, Arkansas, Oklahoma, Great Lakes region, Northeastern United States | ≥ $600 million | 0 (1) | [22][23] |
| Four-E | July 12 – 14 | 55 (35) | 1006 | None | None | None | |
| Danas (Falcon) | July 12 – 21 | 85 (50) | 985 | Yap Islands, Philippines, Taiwan, Ryukyu Islands, East China, Japan, Korean Peninsula, North China, Russian Far East, Kuril Islands | $302 thousand | 4 | |
| Goring | July 17 – 19 | 55 (35) | 996 | Philippines, Taiwan, Ryukyu Islands | None | None | |
| Dalila | July 22 – 25 | 65 (40) | 1005 | Panama, Costa Rica, Nicaragua | None | None | |
| Three | July 22 – 23 | 50 (30) | 1013 | Bahamas | None | None | |
| 01 | July 22 – 24 | 45 (30) | 1001 | None | None | None | |
| Nari | July 24 – 27 | 65 (40) | 998 | Bonin Islands, Japan | None | None | |
| Erick | July 27 – August 5 | 215 (130) | 952 | Hawaii | None | None | |
| Flossie | July 28 – August 6 | 130 (80) | 990 | Hawaii | None | None | |
| Wipha | July 30 – August 3 | 85 (50) | 985 | Paracel Islands, Hainan, South China, Vietnam, Laos | $44.3 million | None |
August
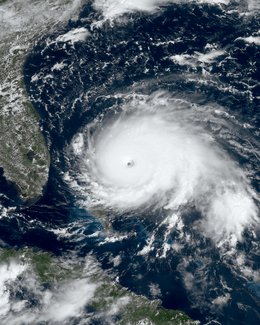
The month of August was the second-most active of the year with eighteen tropical cyclones forming, with fourteen being named, out of all the cyclones, Hurricane Dorian in the Atlantic was the strongest to form and the most deadly, with thousands suspected dead and many more unaccounted for,[24] and Typhoon Lekima (2019) became the second most costliest storm in Chinese history, behind Typhoon Fitow of 2013.
| Storm name | Dates active | Max wind km/h (mph) |
Pressure (hPa) |
Areas affected | Damage (USD) |
Deaths | Refs |
|---|---|---|---|---|---|---|---|
| Francisco | August 1 – 7 | 130 (80) | 970 | Japan, Korean Peninsula | Unknown | 1 | |
| Lekima (Hanna) | August 2 – 14 | 195 (120) | 925 | Caroline Islands, Philippines, Ryukyu Islands, Taiwan, China, Korean Peninsula, Russian Far East | $9.28 billion | 91 | [25][26][27][28] |
| Gil | August 3 – 5 | 65 (40) | 1006 | None | None | None | |
| Krosa | August 5 – 16 | 155 (100) | 950 | Mariana Islands, Japan, Korean Peninsula, Russian Far East | $20.3 million | 3 | |
| BOB 03 | August 6 – 11 | 55 (35) | 988 | East India, Bangladesh | None | None | |
| TD | August 6 – 8 | 55 (35) | 996 | Philippines | None | None | |
| Henriette | August 12 – 13 | 70 (45) | 1005 | Central America, Southwestern Mexico, Revillagigedo Islands, Baja California Peninsula | None | None | |
| TD | August 17 – 18 | Unspecified | 1006 | None | None | None | |
| TD | August 19 – 21 | Unspecified | 1004 | Ryukyu Islands, Taiwan, East China | None | None | |
| Bailu (Ineng) | August 20 – 27 | 95 (60) | 985 | Philippines, Taiwan, South China | Unknown | 3 | |
| Chantal | August 21 – 24 | 65 (40) | 1009 | Southeastern United States | None | None | |
| Ivo | August 21 – 25 | 100 (65) | 992 | Revillagigedo Islands, Baja California Peninsula, Northwestern Mexico | None | None | |
| Dorian | August 24 – September 12 | 295 (185) | 910 | Leeward Islands, Barbados, Virgin Islands, Puerto Rico, The Bahamas, Southeastern United States. Atlantic Canada, | $4.68billion | 63 | [29][30][31][32] |
| Podul (Jenny) | August 25 – 31 | 85 (50) | 992 | Yap, Philippines, Vietnam, Laos, Thailand, Cambodia | $2.35 million | 15 | |
| Erin | August 26 – 29 | 65 (40) | 1005 | Eastern United States | Minimal | None | [33] |
| Faxai | August 30 – September 10 | 155 (100) | 955 | Wake Island, Japan | $8.12 billion | 3 | |
| Kajiki (Kabayan) | August 30 – September 7 | 65 (45) | 996 | Philippines, South China, Vietnam, Laos | None | None | |
| Lingling (Liwayway) | August 31 – September 7 | 165 (105) | 940 | Philippines, Ryukyu Islands | $236 million | 8 |
September
The month of September was the most active of the year with twenty-five tropical cyclones forming, with nineteen being named. Out of all the cyclones, Hurricane Lorenzo in the Atlantic is the most intense of the month and become one of the largest and most powerful category 5 hurricanes on record for the central tropical Atlantic in the satellite era.[34] Tropical Storm Fernand caused heavy flooding in Northwest Mexico, killing one person and causing at least $213 million in damage. The activity of the month in the Eastern Pacific became a record-tying most active in the month between 1966, 1992, 1994, 1997 and 2005 forming six named storms in the basin. Severe Tropical Storm (later Typhoon) Tapah (Nimfa) worsened the flooding situation in the Philippines. No tropical cyclones were formed in South Atlantic.
| Storm name | Dates active | Max wind km/h (mph) |
Pressure (hPa) |
Areas affected | Damage (USD) |
Deaths | Refs |
|---|---|---|---|---|---|---|---|
| Juliette | September 1 – 7 | 205 (125) | 953 | None | None | None | |
| TD | September 1 – 4 | 55 (35) | 998 | Philippines | None | None | |
| Fernand | September 3 – 5 | 85 (50) | 1000 | Northwestern Mexico, Southern Texas | $383 million | 1 | [35][36] |
| Gabrielle | September 3 – 10 | 100 (65) | 995 | Cape Verde, British Isles | None | None | |
| Akoni | September 4 – 6 | 65 (40) | 1004 | None | None | None | |
| TD | September 4 – 5 | Unspecified | 1006 | Caroline Islands | None | None | |
| TD | September 7 – 10 | 55 (35) | 1000 | Ryukyu Islands | None | None | |
| Marilyn | September 7 – 10 | 55 (35) | 998 | Caroline Islands, Philippines | None | None | |
| Kiko | September 12 – 25 | 215 (130) | 950 | None | None | None | |
| Humberto | September 13 – 20 | 205 (125) | 951 | Hispaniola, Cuba, Bahamas, Southeastern United States, Bermuda | 25 million | 1 | |
| Peipah | September 13 – 16 | 65 (40) | 1000 | Mariana Islands | None | None | |
| TD | September 15 | Unspecified | 996 | None | None | None | |
| TD | September 17 – 20 | Unspecified | 1000 | None | None | None | |
| Tapah (Nimfa) | September 17 – 23 | 120 (75) | 970 | Philippines | None | None | |
| Lorena | September 17 – 22 | 140 (85) | 987 | Southwestern Mexico, Western Mexico, Revillagigedo Islands, Baja California Peninsula | None | None | |
| Mario | September 17 – 23 | 100 (65) | 992 | None | None | None | |
| Jerry | September 17 – 25 | 165 (105) | 971 | Leeward Islands, Puerto Rico | None | None | |
| Imelda | September 17 – 21 | 65 (40) | 1003 | Southwestern United States, Texas, Louisiana, Oklahoma, Arkansas | $5 billion | 5 | |
| TD | September 17 | Unspecified | 1004 | Philippines | None | None | |
| Karen | September 22 – 27 | 75 (45) | 1002 | Windward Islands, Trinidad and Tobago, Venezuela, U.S. Virgin Islands, British Virgin Islands, Puerto Rico | None | None | |
| Hikaa | September 22 – 26 | 140 (85) | 978 | Gujarat, Oman | None | None | |
| Lorenzo | September 23 – October 2 | 260 (160) | 925 | West Africa, Cape Verde, Eastern United States, Azores, British Isles, France | ≥$362 million | 10 | |
| Mitag (Onyok) | September 25 – October 3 | 140 (85) | 965 | Mariana Islands, Taiwan, Japan, East China, South Korea | None | None | |
| Narda | September 28 – October 1 | (85) 50 | 998 | Western Mexico, Southwestern Mexico | None | None | |
| Land 01 | September 29 – October 1 | Unspecified | Unspecified | Gujarat | None | None | |
October
The month of October as fairly active, with formation of Typhoon Hagibis, made landfall in Tokyo, Japan, becoming the worst typhoon in Japanese history since Ida in 1958. Hurricane Pablo became the easternmost Atlantic storm to ever strengthen into a hurricane, breaking Hurricane Vince’s record.
| Storm name | Dates active | Max wind km/h (mph) |
Pressure (hPa) |
Areas affected | Damage (USD) |
Deaths | Refs |
|---|---|---|---|---|---|---|---|
| TD | October 1 – 3 | Unspecified | 1010 | None | None | None | |
| Hagibis | October 4 – 13 | 195 (120) | 915 | Mariana Islands, South Korea, Japan, Russian Far East | $15 billion | 95 | |
| Melissa | October 11 – 14 | 100 (65) | 995 | Mid-Atlantic States, New England, Nova Scotia, | None | None | |
| Ema | October 12 – 14 | 85 (50) | 1003 | None | None | None | |
| Fifteen | October 14 – 16 | 55 (35) | 1006 | West Africa, Cape Verde | None | None | |
| Neoguri (Perla) | October 15 – 21 | 140 (85) | 992 | None | None | None | |
| Octave | October 17 – 19 | 75 (45) | 1004 | None | None | None | |
| Bualoi | October 18 – 25 | 185 (115) | 935 | None | None | None | |
| Nestor | October 18 – 19 | 95 (60) | 996 | Central America, Mexico, Southeastern United States | >$150 million | 0 (3) | |
| Priscilla | October 20 – 21 | 65 (40) | 1004 | Western Mexico | >$3 million | None | |
| Kyarr | October 24 – November 1 | 240 (150) | 922 | Gujarat, Iran, Pakistan, Oman | None | None | |
| Olga | October 25 – 26 | 65 (40) | 998 | United States Gulf Coast | >$100 million | 1 | |
| Pablo | October 25 – 28 | 130 (80) | 977 | Azores | None | None | |
| Matmo | October 28 – November 1 | 100 (60) | 992 | Vietnam | >$53 million | None | |
| Maha | October 30 – November 7 | 185 (115) | 956 | India | None | None | |
| Rebekah | October 30 – November 1 | 75 (45) | 987 | Azores | None | None |
November

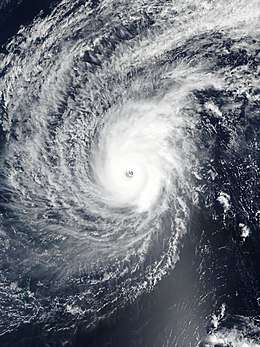
The month of November was relatively inactive, with only eleven tropical cyclones forming. However, Typhoon Halong became the strongest storm of the year, peaking with a minimum central pressure of 905 millibars. Cyclone Bulbul caused extensive damage in West Bengal during the early period of the month, with damage estimates likely exceeding over US$2.5 billion. Typhoon Nakri, far earlier in the month, and Typhoon Kammuri, near the end of the month, both lashed parts of the Philippines with heavy rainfall and strong wind, killing 34 people in the country in total. Additionally, Tropical Cyclone Rita became the first cyclone of the 2019-20 South Pacific cyclone season.
| Storm name | Dates active | Max wind km/h (mph) |
Pressure (hPa) |
Areas affected | Damage (USD) |
Deaths | Refs |
|---|---|---|---|---|---|---|---|
| Halong | November 2 – 9 | 215 (130) | 905 | None | None | None | |
| Nakri (Quiel) | November 4 – 11 | 120 (75) | 980 | Philippines | >$40 million | 22 | |
| Bulbul | November 5 – 11 | 155 (100) | 980 | Andaman and Nicobar Islands, East India, Bangladesh | ≥$2.6 billion | 38 | [37][38][39][40][41] |
| Fengshen | November 10 – 18 | 155 (100) | 965 | Marshall Islands, Northern Mariana Islands | None | None | |
| Kalmaegi (Ramon) | November 11 – 21 | 120 (75) | 980 | Philippines | None | None | |
| Raymond | November 15 – 17 | 85 (50) | 1000 | Revillagigedo Islands, Baja California Peninsula | None | None | |
| Twenty-One-E | November 16 – 18 | 55 (35) | 1006 | Southwest Mexico | None | None | |
| Fung-wong (Sarah) | November 19 – 24 | 100 (65) | 990 | Philippines | None | None | |
| Sebastien | November 19 – 25 | 100 (65) | 994 | Leeward Islands | None | None | |
| TD | November 22–23 | Not specified | 1010 | None | None | None | |
| Rita | November 22 – 27 | 120 (75) | 978 | Solomon Islands, Vanuatu | None | None | |
| Kammuri (Tisoy) | November 24 - December 6 | 165 (105) | 950 | Caroline Islands, Mariana Islands, Philippines | $116 million | 12 | |
| TD | November 26–29 | 55 (35) | 1002 | Mariana Islands | None | None | |
| TD | November 29 - December 1 | 55 (35) | 1002 | Caroline Islands | None | None | |
December
The month of December was only slightly active, with nine tropical cyclones forming but only six tropical cyclones being named. However, Ambali became the strongest storm of the month, peaking with a minimum central pressure of 930 millibars and maximum sustained winds of 155 mph (250 km/h), thus becoming the first very intense tropical cyclone in the basin since Fantala in 2016 and also becoming the first cyclone of the 2019-20 South-West Indian Ocean cyclone season. Adding to the season, Cyclone Belna formed and made a destructive landfall in northwestern Madagascar, killing 9 people. Additionally, before becoming the last typhoon of the 2019 Pacific typhoon season, Typhoon Phanfone made a devastating landfall in the Philippines on Christmas Eve causing over ₱3,39 billion (US$67.2 million) in damage and leaving 50 people in the nation dead.
| Storm name | Dates active | Max wind km/h (mph) |
Pressure (hPa) |
Areas affected | Damage (USD) |
Deaths | Refs |
|---|---|---|---|---|---|---|---|
| Belna | December 2 – 11 | 185 (115) | 955 | Seychelles, Mayotte, Comoros, Madagascar | Unknown | 9 | |
| Pawan | December 2 – 7 | 75 (45) | 999 | Somalia | Unknown | 1 | |
| ARB 06 | December 3 – 5 | 95 (60) | 1002 | Tamil Nadu | Unknown | 25 | |
| Ambali | December 3 – 8 | 220 (140) | 930 | None | None | None | |
| ARB 08 | December 8 – 10 | 55 (35) | 1004 | Socotra, Somalia | None | None | |
| 02F | December 19 – 23 | Unspecified | 999 | None | None | None | |
| Phanfone (Ursula) | December 19–29 | 175 (110) | 970 | Caroline Islands, Philippines | $67.2 million | 50 | |
| Sarai | December 23 – January 2 | 110 (70) | 972 | Fiji, Tonga, Niue, Southern Cook Islands | $2.3 million | 2 | |
| Calvinia | December 27 - January 1 | 120 (75) | 973 | Mauritius, Rodrigues | Unknown | None |
Global effects
- The sum of the number of systems in each basin will not equal the number shown as the total. This is because when systems move between basins, it creates a discrepancy in the actual number of systems.
- The sum of the number of fatalities in each basin will not equal the number shown as the total. This is because when systems move between basins, it creates a discrepancy in the actual number of fatalities.
Notes
1The "strength" of a tropical cyclone is measured by the minimum barometric pressure, not wind speed. Most meteorological organizations rate the intensity of a storm by this figure, so the lower the minimum pressure of the storm, the more intense or "stronger" it is considered to be. The strongest winds were actually from Dorian, at 185 mph (295 km/h) when measured on a 1-minute sustained basis.
2 Only systems that formed either on or after January 1, 2019 are counted in the seasonal totals.
3 Only systems that formed either before or on December 31, 2019 are counted in the seasonal totals.
4 The wind speeds for this tropical cyclone/basin are based on the IMD Scale which uses 3-minute sustained winds.
5 The wind speeds for this tropical cyclone/basin are based on the Saffir Simpson Scale which uses 1-minute sustained winds.
6The wind speeds for this tropical cyclone are based on Météo-France which uses gust winds.
References
- Olarn, Kocha. "Storm kills 3 in Thailand, moves into Andaman Sea". CNN. Retrieved 2019-04-09.
- "Pabuk leaves 4 dead, billions of Baht in damage – Thailand". ReliefWeb. Retrieved 2019-04-09.
- Olarn, Kocha. "Storm Kills 3 in Thailand, moves into Andaman Sea". CNN. CNN. Retrieved 26 January 2019.
- Wright, Pam. "Tropical Storm Pabuk Makes First on Record Southern Thailand January Landfall; Two Killed, Thousands Evacuated". The Weather Channel. The Weather Channel. Retrieved 26 January 2019.
- Dalizon, Alfred. "Landslide buried 7 treasure hunters in Agusan del Norte". Journal Online. People's Journal. Retrieved 26 January 2019.
- "Wutip 2019 – Hurricane And Typhoon Updates". blogs.nasa.gov. Retrieved 2019-04-09.
- Matthew Cappucci (February 25, 2019). "The strongest February typhoon on record packs 180 mph gusts, sideswiping Guam". The Washington Post. Retrieved May 21, 2019.
- Leahy, Stephen (2019-03-19). "Why Cyclone Idai was so destructive". Environment. Retrieved 2019-04-09.
- "Resources stretched as Cyclone Kenneth piles misery on Mozambique". Reliefweb. 27 April 2019. Retrieved 27 April 2019.
- "Hundreds feared dead after Cyclone Idai". BBC News. 18 March 2019. Retrieved 18 March 2019.
- Osental, Duffie (5 April 2019). "Insurers on standby as cyclone looms off Western Australia coast". Insurance Business America. Retrieved 5 April 2019.
- Brandon Miller (25 April 2019). "Cyclone Kenneth: Thousands evacuated as Mozambique is hit with the strongest storm in its history". Cable News Network. Retrieved 25 April 2019.
- Mutsaka, Farai. "Mozambique church a refuge for Muslim cyclone survivors". SF Gate. The Associated Press. Retrieved 1 May 2019.
- "Number Of Dead From Cyclone Fani Rises To 29 In Odisha". NDTV. 5 May 2019. Retrieved 5 May 2019.
- "Cyclone Fani: 14 killed in 8 districts". Dhaka Tribune. 4 May 2019. Retrieved 4 May 2019.
- "Lightning kills 8 in Uttar Pradesh". New Indian Express. 3 May 2019. Retrieved 5 May 2019.
- "Andhra Pradesh pegs loss due to Cyclone Fani at ₹58.62 crore". The Hindu. 5 May 2019. Retrieved 5 May 2019.
- "Fani storm loss estimated at Tk 536 crore". Banglanews24.com. 9 May 2019. Retrieved 9 May 2019.
- "Rains and strong winds hit Mumbai; 1 killed, 2 injured as portion of cladding collapses at Churchgate Railway Station". Mumbai Mirror. 12 June 2019. Archived from the original on 14 June 2019. Retrieved 14 June 2019.
- Saiyed, Kamal; Mohanty, Aishwarya (13 June 2019). "Gujarat: Six killed, 2 injured in 3 districts ahead of Vayu landfall". The Indian Express. Archived from the original on 14 June 2019. Retrieved 14 June 2019.
- Waqar Bhatti, M. (15 June 2019). "Elderly man apparently dies due to heat stroke as weathermen predicts another very hot, humid day on Sunday". The News International. Archived from the original on 16 June 2019. Retrieved 16 June 2019.
- Adams, Char (July 15, 2019). "Good Samaritans Form Human Chain to Rescue Swimmers from Rip Current in Florida". PEOPLE.com. Retrieved 2019-07-18.
- Global Catastrophe Recap: July 2019 (PDF) (Report). AON. August 1, 2019. Retrieved August 16, 2019.
- Ron Brackett; Jan Wesner Childs (September 9, 2019). "In the Bahamas, Official Hurricane Dorian Death Toll Rises to 45, But Newspaper Says It's in the Thousands". weather.com. The Weather Company. Retrieved September 13, 2019.
- "Typhoon Lekima leaves 45 dead, 16 missing in China". China.org.cn. 12 August 2019. Retrieved 12 August 2019.
- "Typhoon Lekima: 45 dead, one million displaced in China". The Week.
- BeijingAugust 12, Press Trust of India; August 12, 2019UPDATED:; Ist, 2019 17:32. "Typhoon Lekima: 45 killed, over a million displaced in China". India Today.CS1 maint: extra punctuation (link) CS1 maint: numeric names: authors list (link)
- "'Like a horse with an extremely fierce temper': Typhoon Lekima kills 44 in China". www.abc.net.au. August 12, 2019.
- "Bahamas official warns people to prepare for the 'unimaginable' as hurricane death toll rises to 30". CNN. Retrieved 2019-09-06.
- Connolly, Kevin (September 5, 2019). "6 Florida Deaths Linked to Hurricane Dorian". www.mynews13.com. News 13. Retrieved 2019-09-06.
- Puleo, Mark; Mitchell, Chaffin (August 29, 2019). "While Puerto Rico avoids direct hit, Virgin Islands take significant blow from Dorian". AccuWeather. Retrieved September 6, 2019.
- "WATCH: North Carolina reports 1st death from Hurricane Dorian". PBS NewsHour. Public Broadcasting Service. 2019-09-04. Retrieved 2019-09-06.
- https://www.cbc.ca/news/canada/nova-scotia/rainfall-post-tropical-storm-erin-1.5265391
- Jack Beven (September 26, 2019). Hurricane Lorenzo Discussion Number 16 (Report). National Hurricane Center. Retrieved September 26, 2019.
- "Minuto a minuto: Fernand azota Monterrey con lluvias torrenciales y deja un muerto". Infobae. September 4, 2019. Retrieved September 7, 2019.
- "Fernand provocó daños por 7.500 millones de pesos en Nuevo León". Infobae. September 7, 2019. Retrieved September 8, 2019.
- "Cyclone Bulbul kills 102 in West Bengal, 2.73 lakh families affected in the state". Times of India. November 10, 2019. Retrieved November 10, 2019.
- "Cyclone Bulbul claims 13 lives, leaves a trail of destruction in Bangladesh". bdnews24.com. November 10, 2019. Retrieved November 11, 2019.
- "Cyclone Bulbul: Bodies of missing nine fishermen recovered from Meghna river". The Daily Star. 11 November 2019. Retrieved 11 November 2019.
- "Cyclone Bulbul: Bodies Of 4 Missing Fishermen Found Off Bengal Coast". NDTV. November 11, 2019. Retrieved November 11, 2019.
- "Initial Estimates Suggest Damages Worth ₹19,000 Crore Due to Cyclone Bulbul in West Bengal". The Weather Channel. 13 November 2019. Retrieved 13 November 2019.
External links
Regional Specialized Meteorological Centers
- US National Hurricane Center – North Atlantic, Eastern Pacific
- Central Pacific Hurricane Center – Central Pacific
- Japan Meteorological Agency – NW Pacific
- India Meteorological Department – Bay of Bengal and the Arabian Sea
- Météo-France – La Reunion – South Indian Ocean from 30°E to 90°E
- Fiji Meteorological Service – South Pacific west of 160°E, north of 25° S
Tropical Cyclone Warning Centers
- Meteorology, Climatology, and Geophysical Agency of Indonesia – South Indian Ocean from 90°E to 141°E, generally north of 10°S
- Australian Bureau of Meteorology (TCWC's Perth, Darwin & Brisbane) – South Indian Ocean & South Pacific Ocean from 90°E to 160°E, generally south of 10°S
- Papua New Guinea National Weather Service – South Pacific Ocean from 141°E to 160°E, generally north of 10°S
- Meteorological Service of New Zealand Limited – South Pacific west of 160°E, south of 25°S
![]()