Pacific hurricane
A Pacific hurricane is a mature tropical cyclone that develops within the northeastern and central Pacific Ocean to the east of 180°W, north of the equator. For tropical cyclone warning purposes, the northern Pacific is divided into three regions: the eastern (North America to 140°W), central (140°W to 180°), and western (180° to 100°E), while the southern Pacific is divided into 2 sections, the Australian region (90E to 160°E) and the southern Pacific basin between 160°E and 120°W.[1] Identical phenomena in the western north Pacific are called typhoons. This separation between the two basins has a practical convenience, however, as tropical cyclones rarely form in the central north Pacific due to high vertical wind shear, and few cross the dateline.

List of seasons
| Period | Seasons |
|---|---|
| Pre-1950s | Before 1900, 1900–09, 1910–19, 1920–29, 1930–39, 1939, 1940–48, 1949 |
| 1950s | 1950, 1951, 1952, 1953, 1954, 1955, 1956, 1957, 1958, 1959 |
| 1960s | 1960, 1961, 1962, 1963, 1964, 1965, 1966, 1967, 1968, 1969 |
| 1970s | 1970, 1971, 1972, 1973, 1974, 1975, 1976, 1977, 1978, 1979 |
| 1980s | 1980, 1981, 1982, 1983, 1984, 1985, 1986, 1987, 1988, 1989 |
| 1990s | 1990, 1991, 1992, 1993, 1994, 1995, 1996, 1997, 1998, 1999 |
| 2000s | 2000, 2001, 2002, 2003, 2004, 2005, 2006, 2007, 2008, 2009 |
| 2010s | 2010, 2011, 2012, 2013, 2014, 2015, 2016, 2017, 2018, 2019 |
| 2020s | 2020 |
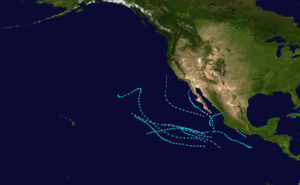
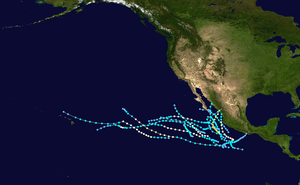
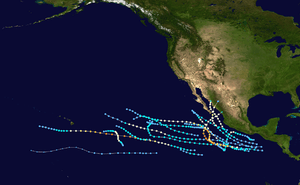
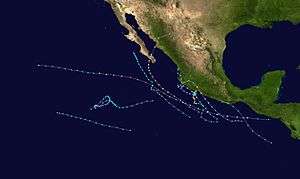
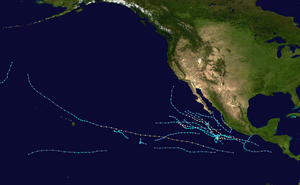
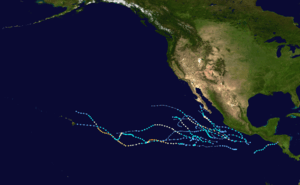
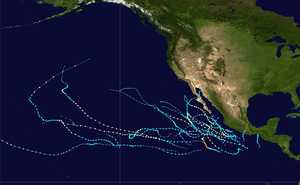
1950s
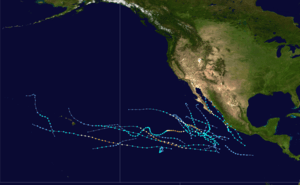
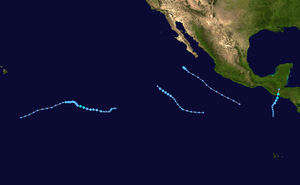
| Track map | Year | TD | TS | HU | MH | Strongest storm | Deaths | Damages (USD) | Notes |
|---|---|---|---|---|---|---|---|---|---|
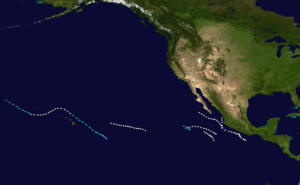 | 1950 | -- | 7 | 6 | 0 | Hiki | 1 | Unknown | Includes Hiki, the third wettest tropical cyclone in the United States |
 | 1951 | -- | 9 | 2 | 0 | Two and Eight | 0 | Unknown | |
 | 1952 | -- | 7 | 3 | 0 | Five and Seven | 0 | Unknown | |
 | 1953 | -- | 4 | 2 | 0 | One | 0 | Unknown | |
 | 1954 | 11 | 11 | 3 | 0 | Seven | 40 | Unknown | |
 | 1955 | -- | 6 | 2 | 0 | One | 0 | Unknown | |
 | 1956 | -- | 11 | 7 | 0 | One | 0 | Unknown | |
 | 1957 | -- | 13 | 9 | 1 | Twelve | 21 | $100,000 | |
 | 1958 | 14 | 14 | 5 | 0 | Eleven | 0 | Unknown | |
 | 1959 | 15 | 15 | 5 | 3 | Patsy | >1,800 | $280 million | Patsy was the first Category 5 hurricane in the Central Pacific basin Includes the deadliest tropical cyclone in the Eastern Pacific, the 1959 Mexico hurricane |
| >1,862 | $280.10 million | ||||||||
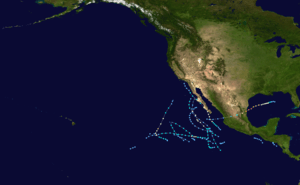
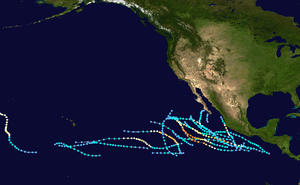
1960s
| Track map | Year | TD | TS | HU | MH | Strongest storm | Deaths | Damages (USD) | Notes |
|---|---|---|---|---|---|---|---|---|---|
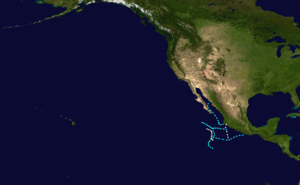
 | 1960 | 8 | 8 | 5 | 0 | Estelle | 0 | Unknown | |
 | 1961 | 11 | 10 | 2 | 0 | Iva | 436 | $16 million | |
 | 1962 | 18 | 12 | 2 | 0 | Doreen | Unknown | $11 million | |
 | 1963 | 8 | 8 | 4 | 0 | Mona | Unknown | Unknown | |
 | 1964 | 6 | 6 | 2 | 0 | Odessa | Unknown | Unknown | Least active season since 1953 |
 | 1965 | 11 | 10 | 1 | 0 | Emily | 6 | $10 million | |
 | 1966 | 18 | 13 | 8 | 0 | Connie | 9+ | $5.6 million | Includes the farthest traveled storm in the Eastern Pacific, Hurricane Blanca |
 | 1967 | 17 | 17 | 6 | 1 | Olivia | 121 | Unknown | |
 | 1968 | 26 | 20 | 6 | 0 | Rebecca | 9 | Unknown | Tied with 2009 for having the most storms named in the month of August |
 | 1969 | 15 | 10 | 4 | 0 | Doreen | 10 | Unknown | Includes latest first named storm, Tropical Storm Ava, which formed in July |
| 591 | $42.6 million | ||||||||
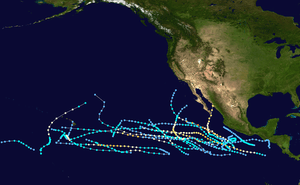
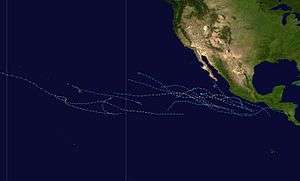
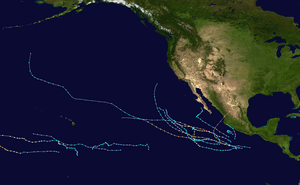
1970s
| Track map | Year | TD | TS | HU | MH | Strongest storm | Deaths | Damages (USD) | Notes |
|---|---|---|---|---|---|---|---|---|---|
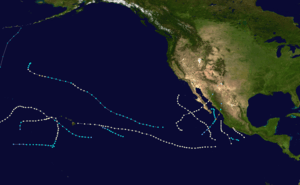
 | 1970 | 21 | 19 | 5 | 0 | Lorraine | 22 | Unknown | |
 | 1971 | 22 | 18 | 12 | 6 | Olivia | 52 | $40 million | |
 | 1972 | 20 | 14 | 9 | 4 | Celeste | 1 | $75,000 | |
 | 1973 | 18 | 12 | 7 | 3 | Ava | 0 | Unknown | |
 | 1974 | 25 | 18 | 11 | 3 | Maggie | 18–33 | $4 million | Featured one of the most active periods of tropical cyclones on record with five existing simultaneously (Ione, Joyce, Kirsten, Lorraine, and Maggie) |
 | 1975 | 21 | 17 | 9 | 4 | Denise | 30 | $20 million | |
 | 1976 | 19 | 15 | 9 | 5 | Annette | 614–964 | $360 million | |
 | 1977 | 17 | 8 | 4 | 0 | Florence | 8 | $39.6 million | Least active season until 2010 Featured no major hurricanes tied with 2003 |
 | 1978 | 25 | 19 | 14 | 7 | Fico, Hector, Norman | 4 | $301 million | |
 | 1979 | 13 | 10 | 6 | 4 | Ignacio | Unknown | Unknown | Most recent year in which no tropical cyclones crossed into the Central Pacific basin |
| 201 | 150 | 86 | 36 | Ava | 767–1,102 | $385.075 million | |||
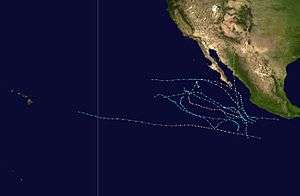
1980s
| Track map | Year | TD | TS | HU | MH | Strongest storm | Deaths | Damages (USD) | Notes |
|---|---|---|---|---|---|---|---|---|---|
 | 1980 | 16 | 15 | 7 | 3 | Kay | 0 | Unknown | |
 | 1981 | 17 | 15 | 8 | 1 | Norma | 79 | $134 million | |
 | 1982 | 30 | 23 | 12 | 5 | Olivia | 1,937 | $1.3 billion | Fifth most active season on record |
 | 1983 | 26 | 21 | 12 | 8 | Kiko and Raymond | 168 | $303.33 million | Tied with 1984 for the fourth most active season at the time Longest season recorded at the time One tropical storm formed in December, Hurricane Winnie |
 | 1984 | 26 | 21 | 13 | 7 | Douglas | 21 | Unknown | Tied with 1983 for the fourth most active season at the time |
 | 1985 | 28 | 24 | 12 | 8 | Rick | 1 | $1 million | Third most active season on record Tied with 2018 for having five named storms in the month of June Tied with 2015 and 2016 for the most active month of July since reliable records began |
 | 1986 | 26 | 17 | 9 | 3 | Roslyn | 2 | $352 million | |
 | 1987 | 20 | 20 | 10 | 4 | Max | 3 | $144.22 million | Last year in which the Eastern Pacific Hurricane Center was the primary warning center for tropical cyclones in the eastern Pacific Ocean |
 | 1988 | 23 | 15 | 7 | 3 | Hector | 24 | Unknown | Hurricane Joan crossed over Central America and was named Miriam in the Eastern Pacific basin |
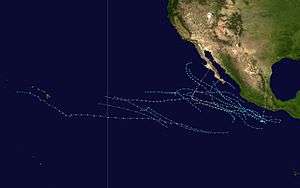 | 1989 | 25 | 18 | 9 | 4 | Raymond | 14 | $1.75 million | |
| 237 | 189 | 99 | 46 | Hector | 2,250 | $2.240 billion | |||
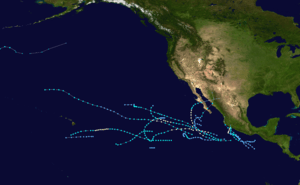
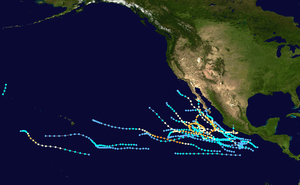
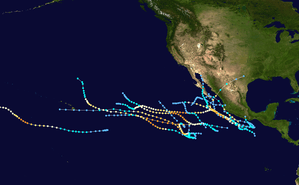
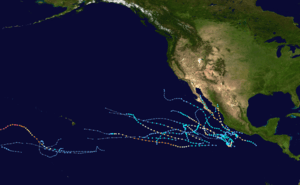
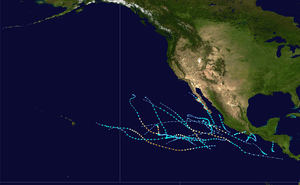
1990s
| Map | Year | TD | TS | HU | MH | Strongest storm | Deaths | Damages (USD) | Notes |
|---|---|---|---|---|---|---|---|---|---|
 | 1990 | 27 | 21 | 16 | 6 | Trudy | 19 | $12.5 million | Fifth most active season on record and third most active in terms of ACE indices Tied with 1992, 2014, and 2015 for the most number of hurricanes in a single season |
 | 1991 | 16 | 14 | 10 | 5 | Kevin | 11 | Unknown | |
 | 1992 | 30 | 27 | 16 | 10 | Tina | 25 | $3.15 billion | The second-most active Pacific hurricane season on record in terms of ACE Tied with 1990, 2014, and 2015 for the most hurricanes in a single season Includes the costliest hurricane in the East/Central Pacific, Hurricane Iniki Includes the longest-lasting Pacific hurricane, Tina Hurricane Ekeka is the most intense off-season hurricane in the Pacific basin |
 | 1993 | 18 | 15 | 11 | 9 | Lidia | 50 | $40 million | |
 | 1994 | 23 | 20 | 10 | 5 | Gilma | 26 | $735 million | Tied with 2002 and 2018 for having the most number of category 5 hurricanes in a single season Includes both the farthest distance and longest-lasting tropical cyclone ever observed, Hurricane John |
 | 1995 | 11 | 10 | 7 | 3 | Juliette | 124 | $31 million | Least active season since 1979 |
 | 1996 | 14 | 9 | 5 | 2 | Douglas | 48 | $813,000 | Saw a record of four Pacific hurricanes strike Mexico, the most in a single season Hurricane Cesar crossed over from Central America and was renamed Douglas in the Pacific basin |
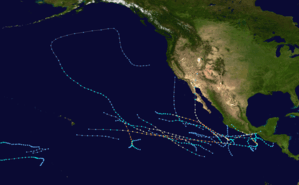 | 1997 | 24 | 19 | 9 | 7 | Linda | 261–531 | $551 million | Two category 5 hurricanes formed: Linda and Guillermo Hurricane Linda was the most intense hurricane in the Pacific basin until Patricia of 2015 |
 | 1998 | 16 | 13 | 9 | 6 | Howard | 54 | $760 million | |
 | 1999 | 14 | 9 | 6 | 2 | Dora | 16 | None | |
| 193 | 157 | 99 | 55 | Linda | 581–853 | $4.9 billion | |||
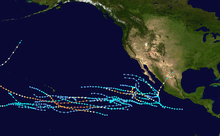
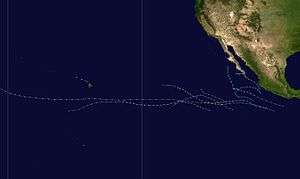
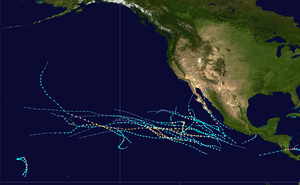
2000s
| Map | Year | TD | TS | HU | MH | Strongest storm | Deaths | Damages (USD) | Notes | |
|---|---|---|---|---|---|---|---|---|---|---|
 | 2000 | 21 | 19 | 6 | 2 | Carlotta | 27 | $84 million | ||
 | 2001 | 19 | 15 | 8 | 2 | Juliette | 13 | $401 million | ||
 | 2002 | 19 | 15 | 8 | 6 | Kenna | 7 | $101 million | Tied with 1994 and 2018 for having the most number of category 5 hurricanes in a single season Includes the fourth most intense hurricane in the Pacific basin, Kenna | |
 | 2003 | 17 | 16 | 7 | 0 | Nora | 23 | $129 million | Featured no major hurricanes tied with 1977 | |
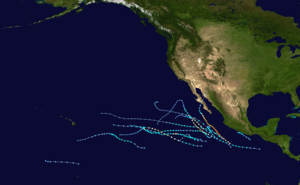 | 2004 | 18 | 12 | 6 | 3 | Javier | None | None | ||
 | 2005 | 17 | 15 | 7 | 2 | Kenneth | 6 | $12 million | ||
 | 2006 | 25 | 19 | 11 | 6 | Ioke | 14 | $355 million | Most active since 2000 Includes the most intense hurricane in the Central Pacific basin, Ioke | |
 | 2007 | 15 | 11 | 4 | 1 | Flossie | 42 | $80 million | ||
 | 2008 | 19 | 17 | 7 | 2 | Norbert | 45 | $153 million | ||
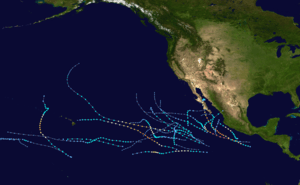 | 2009 | 23 | 20 | 8 | 5 | Rick | 16 | $226 million | Most active since 1994 Tied with 1968 for having the most storms named in the month of August Includes the third most intense hurricane in the Pacific basin, Rick | |
| 192 | 159 | 72 | 29 | Rick | 193 | ≥$1.54 billion | ||||
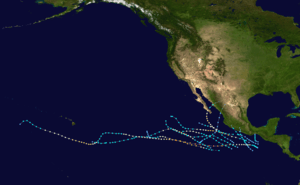
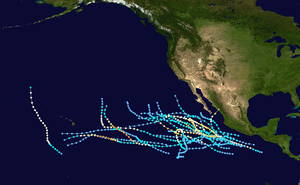
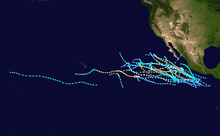
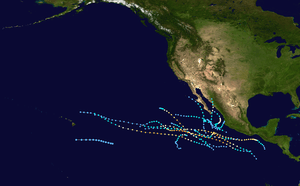
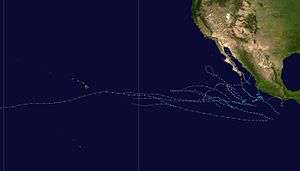
2010s
| Map | Year | TD | TS | HU | MH | Strongest storm | Deaths | Damages (USD) | Notes |
|---|---|---|---|---|---|---|---|---|---|
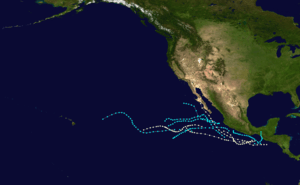
 | 2010 | 13 | 8 | 3 | 2 | Celia | 268 | $1.62 billion | Least active Pacific hurricane season on record tied with 1977 Including a Category 5 hurricane in the basin, Celia Including a rare-off season in the month of December, Omeka |
 | 2011 | 13 | 11 | 10 | 6 | Dora | 43 | >$203.67 million | First time including only tropical storm in the season whitout reaching hurricane, Fernanda |
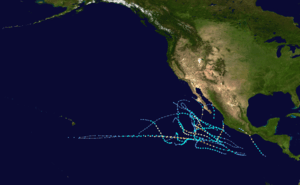 | 2012 | 17 | 17 | 10 | 5 | Emilia | 8 | $27.9 million | First consecutive hurricane season forming two tropical storms in the month of May. |
 | 2013 | 21 | 20 | 9 | 1 | Raymond | 194 | $4.56 billion | Costliest-Pacific hurricane season on record. Second and final consecutive hurricane season forming two tropical storms in the month of May. |
 | 2014 | 23 | 22 | 16 | 9 | Marie | 49 | >$1.52 billion | Fourth most active season on record Tied with 1990, 1992, and 2015 for the most number of hurricanes in a single season. Including a Category 5 hurricane in the basin, Marie |
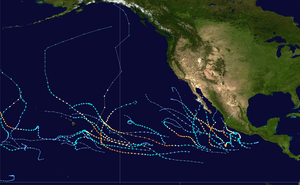 | 2015 | 31 | 26 | 16 | 11 | Patricia | 45 | $566 million | Second most active season on record Includes the most intense hurricane in the Pacific basin, Patricia Tied with 1990, 1992, and 2014 for the most number of hurricanes in a single season Tied with 1985 and 2016 for the most active month of July since reliable records began Latest ending to a season on record. |
 | 2016 | 23 | 22 | 13 | 6 | Seymour | 11 | $95.8 million | Earliest start on record in the Pacific basin Fourth most active season on record Tied with 1985 and 2015 for the most active month of July since reliable records began |
 | 2017 | 20 | 18 | 9 | 4 | Fernanda | 45 | $375.28 million | |
 | 2018 | 26 | 23 | 13 | 10 | Walaka | 52 | >$1.26 billion | Fourth-most active season on record Most active Pacific hurricane season on record in terms of ACE Tied with 1985 for the most named storms on record in the month of June (5). Tied with 1994 and 2002 for having the most number of category 5 hurricanes in a single season |
 | 2019 | 21 | 19 | 7 | 4 | Barbara | 7 | $16.1 million | Latest start since reliable records began in 1971 |
| 208 | 186 | 106 | 58 | Patricia | 723 | ≥$10.2 billion | |||
History
Documentation of Pacific hurricanes dates to the Spanish colonization of Mexico, when the military and missions wrote about "tempestades". In 1730, such accounts indicated an understanding of the storms. After observing the rotating nature of tropical cyclones, meteorologist William Charles Redfield expanded his study to include storms in the eastern North Pacific Ocean in the middle of the 19th century. Between June and October 1850, Redfield observed five tropical cyclones along "the southwestern coast of North America", along with one in each of the three subsequent years. In 1895, Cleveland Abbe reported the presence of many storms between 5° to 15°–N in the eastern Pacific, although many such storms dissipated before affecting the Mexican coast. Two years later, the German Hydrography Office Deutsche Seewarte documented 45 storms from 1832 to 1892 off the west coast of Mexico.[2]
Despite the documentation of storms in the region, the official position of the United States Weather Bureau denied the existence of such storms. In 1910, the agency reported on global tropical cyclones, noting that "the occurrence of tropical storms is confined to the summer and autumn months of the respective hemispheres and to the western parts of the several oceans." In 1913, the Weather Bureau reinforced their position by excluding Pacific storms among five tropical cyclone basins; however, the agency acknowledged the existence of "certain cyclones that have been traced for a relatively short distance along a northwest course... west of Central America."[2]
After California became a state and the discovery of gold there in 1848, shipping traffic began increasing steadily in the eastern Pacific. Such activity increased further after the Panama Canal opened in 1914, and the shipping lanes moved closer to the coast. By around 1920, Pacific hurricanes were officially recognized due to widespread ship observations, radio service, and a newly created weather network in western Mexico. Within 60 years, further studies of the region's tropical activity indicated that the eastern Pacific is in fact the second most active basin in the world.[2]
During the 1920s, a few documents in the Monthly Weather Review reported additional storms within 2,000 mi (3,200 km) off the Mexican coastline.[3][4]
The Eastern and Central Pacific hurricane database
The Eastern Pacific hurricane best track database was initially compiled on magnetic tape in 1976 for the seasons between 1949 and 1975, at the NHC to help with the development of two tropical cyclone forecast models, which required tracks of past cyclones as a base for its predictions.[5][6] The database was based on records held by the United States Navy and were interpolated from 12 hourly intervals to 6 hourly intervals based on a scheme devised by Hiroshi Akima in 1970.[7][8] Initially tracks for the Central Pacific region and tracks for tropical depressions that did not develop into tropical storms or hurricanes were not included within the database.[8] After the database had been created Arthur Pike of the NHC made some internal adjustments, while in 1980 a review was made by Arnold Court under contract from the United States National Weather Service and resulted in additions and/or modifications to 81 tracks in the database.[7][9] Between 1976–1987, the NHC archived best track data from the Eastern Pacific Hurricane Center (EPHC), and in 1982 started including information on Central Pacific tropical storms and hurricanes started to be included in the database based on data from the Joint Typhoon Warning Center and research done by Samuel Shaw of the Central Pacific Hurricane Center (CPHC) in 1981.[5][7]
The format of the database was completely revised by the NHC during 1984, so that the format could resemble the Atlantic database before they took over the warning responsibility from the EPHC for the Eastern Pacific during 1988.[7][9][10] During 2008 and 2013 several revisions were made to the database to extend tracks in land, based on reports in the Mariners Weather Log and extrapolation of the tracks since the EPHC stopped issuing advisories on systems before they made landfall.[11] The archives format was significantly changed during 2013 to include non-synoptic best track times, non-developing tropical depressions and wind radii.[12] During February 2016, the NHC released the 1959 Mexico hurricane's reanalysis, which was the first system to be reassessed, using methods developed for the Atlantic reanalysis process.[13]
Climatology
The presence of a semi-permanent high-pressure area known as the North Pacific High in the eastern Pacific is a dominant factor against the formation of tropical cyclones in the winter, as the Pacific High results in wind shear that causes unfavorable, environmental conditions for tropical cyclone formation. Its effects in the central Pacific basin are usually related to keeping cyclones away from the Hawaiian Islands. Due to westward trade winds, hurricanes in the Pacific rarely head eastward, unless recurved by a trough. A second factor preventing tropical cyclones from forming during the winter is the occupation of a semi-permanent low-pressure area designated the Aleutian Low between January and April. Its presence over western Canada and the northwestern United States contributes to the area's occurrences of precipitation in that duration. In addition, its effects in the central Pacific near 160° W causes tropical waves that form in the area to drift northward into the Gulf of Alaska and dissipate. The retreat of this low allows the Pacific High to also retreat into the central Pacific, leaving a warm and moist environment in its wake. The Intertropical Convergence Zone comes northward into the East Pacific in mid-May permitting the formation of the earliest tropical waves,[14] coinciding with the start of the eastern Pacific hurricane season on May 15.[15]
Eastern North Pacific

Hurricane season runs between May 15 and November 30 each year.[16] These dates encompass the vast majority of tropical cyclone activity in this region.
The Regional Specialized Meteorological Center for this basin is the United States' National Hurricane Center.[17] Previous forecasters are the Eastern Pacific Hurricane Center and the Joint Hurricane Warning Center. The RSMC monitors the eastern Pacific and issues reports, watches and warnings about tropical weather systems and cyclones as defined by the World Meteorological Organization.
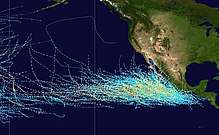
This area is, on average, the second-most active basin in the world. There are an average of 16 tropical storms annually, with 9 becoming hurricanes, and 4 becoming major hurricanes.[18] Tropical cyclones in this region frequently affect mainland Mexico and the Revillagigedo Islands. Less often, a system will affect the Continental United States or Central America. Northbound hurricanes typically reduce to tropical storms or dissipate before reaching the United States: there is only one recorded case of a Pacific system reaching California as a hurricane in almost 200 years of observations—the 1858 San Diego Hurricane.[19]
Most east Pacific hurricanes originate from a tropical wave that drifts westward across the intertropical convergence zone, and across northern parts of South America. Once it reaches the Pacific, a surface low begins to develop, however, with only little or no convection. After reaching the Pacific, it starts to move north-westward and eventually west. By that time, it develops convection and thunderstorm activity from the warm ocean temperatures but remains disorganized. Once the tropical wave becomes organized, it becomes a tropical depression. Formation usually occurs from south of the Gulf of Tehuantepec to south of Baja California with a more westerly location earlier in the season. In the eastern Pacific, development is more centered than anywhere else. If wind shear is low, a tropical cyclone can undergo rapid intensification as a result of very warm oceans, becoming a major hurricane. Tropical cyclones weaken once they reach unfavorable areas for a tropical cyclone formation. Their remnants sometimes reach Hawaii and cause showers there.
There are a few types of Pacific hurricane tracks: one is a westerly track, another moves north-westward along Baja California and another moves north. Sometimes storms can move north-east either across Central America or mainland Mexico and possibly enter the Caribbean Sea becoming a North Atlantic basin tropical cyclone, but these are rare.
Central Pacific
Hurricane season runs from June 1 to November 30, with a strong peak in August and September. However, tropical cyclones have formed outside those dates.[16] Should a tropical cyclone enter the central north Pacific from the western north Pacific, where they occur year-round, or from the eastern north Pacific, where the season starts in May, it is not known if such a system will be considered out of season or not.
The Central Pacific Hurricane Center is the RSMC for this basin and monitors the storms that develop or move into the defined area of responsibility. A previous forecaster was the Joint Hurricane Warning Center.
Central Pacific hurricanes are rare and on average 3 or 4 storms form or move in this area per year. Most often, storms that occur in the area are weak and often decline in strength upon entry. The only land masses impacted by tropical cyclones in this region are Hawaii and Johnston Atoll. Due to the small size of the islands in relation to the Pacific Ocean, direct hits and landfalls are rare.
Steering factors
Hurricanes in the Eastern Pacific tend to move westward out to sea, harming no land—unless they cross into the Central Pacific or Western Pacific basins, in which case they might harm land such as Hawaii or Japan. However, hurricanes can recurve to the north or northeast, hitting Central America or Mexico early and late in the hurricane season.
Extremes
- The strongest recorded Pacific hurricane was Hurricane Patricia (2015), with 1-minute maximum sustained winds of 215 mph (345 km/h) and a minimum barometric pressure of 872 mbar (hPa; 25.75 inHg). This ranks Patricia as the strongest tropical cyclone globally in terms of 1-minute sustained winds and the second strongest globally in terms of barometric pressure.[20]
- Hurricane John (1994) was the longest-lived and farthest-travelling tropical cyclone worldwide, traversing 7,165 mi (13,280 km) in 30 days and 18 hours.[21]
- The 1959 Mexico hurricane was the deadliest Pacific hurricane, causing 1,800 fatalities mostly in Colima and Jalisco.[22]
See also
- Atlantic hurricane
- Cordonazo wind
- Tropical cyclone
- Typhoon
- Atlantic hurricane season
- Pacific typhoon climatology
- Pacific typhoon season
- North Indian Ocean tropical cyclone season
- South-West Indian Ocean tropical cyclone season
- Australian region tropical cyclone season
- South Pacific tropical cyclone season
- South Atlantic tropical cyclone
- Mediterranean tropical-like cyclone
- List of tropical cyclone records
References
- Chris Landsea (2011-07-15). "Subject: A1) What is a hurricane, typhoon, or tropical cyclone?". Atlantic Oceanographic and Meteorological Laboratory. Retrieved 2012-07-02.
- Arnold Court (1980). Tropical Cyclone Effects on California. Northridge, California: California State University. pp. 2, 4, 6, 8, 34. Retrieved 2012-02-02.
- Tingley, F. G. (1922). "North Pacific Ocean" (PDF). Monthly Weather Review. American Meteorological Society. 50 (3): 99. Bibcode:1929MWRv...57..121H. doi:10.1175/1520-0493(1929)57<121:NPO>2.0.CO;2. ISSN 1520-0493. Retrieved 2010-12-20.
- Hurd, Willis Edwin (1929-04-21). "Eastern North Pacific tropical cyclones" (PDF). Monthly Weather Review. American Meteorological Society. 57. Bibcode:1922MWRv...50...98T. doi:10.1175/1520-0493(1922)50<98:NPO>2.0.CO;2. Retrieved 2010-12-21.
- Neumann, Charles J; Leftwhich, Preston W (August 1977). Statistical Guidance for the Prediction of Eastern North Pacific Tropical Cyclone Motion — Part I (PDF) (NOAA Technical Memorandum NWS WR-124). United States National Oceanic and Atmospheric Administration's National Weather Service — Western Region. p. 14. Archived (PDF) from the original on July 27, 2013. Retrieved July 27, 2013.
- Brown, Gail M; Leftwhich, Preston W; National Hurricane Center (August 1982). A Compilation of Eastern and Central North Pacific Tropical Cyclone Data (PDF) (NOAA Technical Memorandum NWS NHC 16). United States National Oceanic and Atmospheric Administration's National Weather Service. Archived (PDF) from the original on July 27, 2013. Retrieved July 27, 2013.
- Blake, Eric S; Gibney, Ethan J; Brown, Daniel P; Mainelli, Michelle; Franklin, James L; Kimberlain, Todd B; Hammer, Gregory R (2009). Tropical Cyclones of the Eastern North Pacific Basin, 1949-2006 (PDF). Archived from the original on July 28, 2013. Retrieved June 14, 2013.
- Leftwhich, Preston W; Brown, Gail M (February 1981). Eastern North Pacific Tropical Cyclone Occurrences during Intra Seasonal Periods (PDF) (NOAA Technical Memorandum NWS WR-160). United States National Oceanic and Atmospheric Administration's National Weather Service — Western Region. pp. 2–3. Archived (PDF) from the original on July 28, 2013. Retrieved July 27, 2013.
- Davis, Mary A.S.; Brown, Gail M; Leftwhich, Preston W; National Hurricane Center (September 1984). A Tropical Cyclone Data Tape for the Eastern and Central North Pacific Basins, 1949-1983: Contents, Limitations, and Uses (PDF) (NOAA Technical Memorandum NWS NHC 25). United States National Oceanic and Atmospheric Administration's National Weather Service. pp. 2–3. Archived (PDF) from the original on July 28, 2013. Retrieved July 28, 2013.
- Sheets, Robert C (June 1990). "The National Hurricane Center — Past, Present, and Future" (PDF). Weather and Forecasting. 5 (2): 197. Bibcode:1990WtFor...5..185S. doi:10.1175/1520-0434(1990)005<0185:TNHCPA>2.0.CO;2. ISSN 1520-0434.
- National Hurricane Center (April 2015). Revisions made to EPAC HURDAT (Report). United States National Oceanic and Atmospheric Administration's National Weather Service. Retrieved March 6, 2015.
- Landsea, Christopher W; Franklin, James L; Blake, Eric S; Tanabe Raymond (April 2013). The revised Northeast and North Central Pacific hurricane database (HURDAT2) (PDF) (Report). United States National Oceanic and Atmospheric Administration's National Weather Service. p. 1. Archived (PDF) from the original on July 28, 2013. Retrieved July 28, 2013.
- "Re-analysis of the 1959 Manzanillo Mexico Hurricane Landfall intensity changed from category 5 to category 4" (PDF) (Press release). United States National Hurricane Center. February 4, 2016. Archived (PDF) from the original on February 4, 2016. Retrieved February 4, 2016.
- Longshore, David (2009). Encyclopedia of Hurricanes, Typhoons, and Cyclones, New Edition. Infobase Publishing. p. 333. ISBN 978-1-4381-1879-6.
- Dorst, Neal (2010-01-21). "TCFAQ G1) When is hurricane season?". Hurricane Research Division. United States: Atlantic Oceanographic and Meteorological Laboratory. Retrieved 2011-11-30.
- "Tropical Cyclone Climatology". FAQ. Central Pacific Hurricane Center. Retrieved 2007-12-31.
- "Latest Advisories on Current Tropical Cyclones Hurricanes Typhoons". World Meteorological Organization. Retrieved 1 April 2015.
- National Hurricane Center. Tropical Cyclone Climatology. Retrieved on 2008-04-19.
- Michael Chenoweth and Chris Landsea. The San Diego Hurricane of 2 October 1858. Retrieved on 2008-04-19.
- Todd B. Kimberlain; Eric S. Blake & John P. Cangialosi (February 1, 2016). Hurricane Patricia (PDF) (Report). Tropical Cyclone Report. Miami, Florida: National Hurricane Center. Retrieved February 4, 2016.
- "Tropical Cyclone Records". FAQ. National Hurricane Center & Central Pacific Hurricane Center. Archived from the original on January 4, 2019. Retrieved November 30, 2019.
- E. Jáuregui (2003). "Climatology of landfalling hurricanes and tropical storms in Mexico" (PDF). Atmósfera. p. 200. Archived from the original (PDF) on 2007-12-01. Retrieved 2007-12-28.
