Raleigh County, West Virginia
Raleigh County is a county in the U.S. state of West Virginia. As of the 2010 census, the population was 78,859.[1] Its county seat is Beckley.[2] The county was founded in 1850 and is named for Sir Walter Raleigh.[3]
Raleigh County | |
|---|---|
 The Raleigh County Courthouse in Beckley | |
 Seal | |
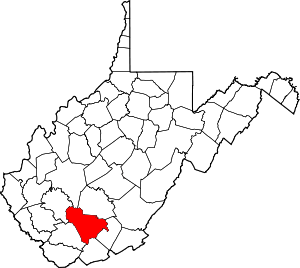 Location within the U.S. state of West Virginia | |
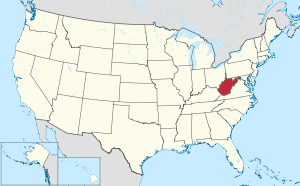 West Virginia's location within the U.S. | |
| Coordinates: 37°47′N 81°16′W | |
| Country | |
| State | |
| Founded | January 23, 1850 |
| Named for | Sir Walter Raleigh |
| Seat | Beckley |
| Largest city | Beckley |
| Area | |
| • Total | 609 sq mi (1,580 km2) |
| • Land | 605 sq mi (1,570 km2) |
| • Water | 4.0 sq mi (10 km2) 0.7%% |
| Population (2010) | |
| • Total | 78,859 |
| • Estimate (2018) | 74,254 |
| • Density | 130/sq mi (50/km2) |
| Time zone | UTC−5 (Eastern) |
| • Summer (DST) | UTC−4 (EDT) |
| Congressional district | 3rd |
| Website | www |
Raleigh County is included in the Beckley, West Virginia Metropolitan Statistical Area.
History
Raleigh County was formed on January 23, 1850 from portions of Fayette County, then a part of Virginia. Alfred Beckley (1802–88) said that he named the county for Sir Walter Raleigh (1552–1618), the "enterprising and far-seeing patron of the earliest attempts to colonize our old Mother State of Virginia".[4]
Raleigh was one of fifty Virginia Counties that were admitted to the Union as the state of West Virginia on June 20, 1863. Later that year, the counties were divided into civil townships, with the intention of encouraging local government. This proved impractical in the heavily rural state, and in 1872 the townships were converted into magisterial districts.[5] Raleigh County was initially divided into six townships: Clear Fork, Marsh Fork, Richman, Shady Spring, Town, and Trap Hill. These became magisterial districts in 1872, and the same year a seventh district, Slab Fork, was created from land that had previously belonged to Wyoming County. These remained largely unchanged over the next century, but in the 1970s the seven historic magisterial districts were consolidated into three new districts: District 1, District 2, and District 3.[6]
Heavily involved in the coal mining industry, Raleigh County has been the scene of numerous deadly accidents, of which the most severe was the Eccles Mine Disaster in 1914. At least one hundred and eighty miners died in what was the second-worst coal mining disaster in state history. More recently, the 2010 Upper Big Branch Mine disaster, which killed twenty-nine miners, occurred in Raleigh County.
On December 27, 1919, Powell Green, a Black veteran of World War I, was lynched as part of the Red Summer of 1919.
The town of Sophia in Raleigh County was the home of Senator Robert C. Byrd.
Geography
The New River flows northwestward along the county's east border. The county terrain consists of wooded hills, carved with drainages.[7] The terrain slopes to the north and west; its highest point is near its southmost corner, at 3,524' (1074m) ASL.[8] The county has a total area of 609 square miles (1,580 km2), of which 605 square miles (1,570 km2) is land and 4.0 square miles (10 km2) (0.7%) is water.[9]
Major highways
Adjacent counties
- Kanawha County (north)
- Fayette County (northeast)
- Summers County (east)
- Mercer County (southeast)
- Wyoming County (southwest)
- Boone County (northwest)
Protected areas[7]
- Little Beaver State Park
- New River Gorge National River (part)
Lakes[7]
- Flat Top Lake
- Glade Creek Reservoir
- Little Beaver Lake
- Stephens Lake
Demographics
| Historical population | |||
|---|---|---|---|
| Census | Pop. | %± | |
| 1850 | 1,765 | — | |
| 1860 | 3,367 | 90.8% | |
| 1870 | 3,673 | 9.1% | |
| 1880 | 7,367 | 100.6% | |
| 1890 | 9,597 | 30.3% | |
| 1900 | 12,436 | 29.6% | |
| 1910 | 25,633 | 106.1% | |
| 1920 | 42,482 | 65.7% | |
| 1930 | 68,072 | 60.2% | |
| 1940 | 86,687 | 27.3% | |
| 1950 | 96,273 | 11.1% | |
| 1960 | 77,826 | −19.2% | |
| 1970 | 70,080 | −10.0% | |
| 1980 | 86,821 | 23.9% | |
| 1990 | 76,819 | −11.5% | |
| 2000 | 79,220 | 3.1% | |
| 2010 | 78,859 | −0.5% | |
| Est. 2018 | 74,254 | [10] | −5.8% |
| US Decennial Census[11] 1790–1960[12] 1900–1990[13] 1990–2000[14] 2010–2018[1] | |||

2000 census
As of the 2000 United States Census, there were 79,220 people, 31,793 households, and 22,096 families in the county. The population density was 131/sqmi (50.6/km²). There were 35,678 housing units at an average density of 59/sqmi (22.8/km²). The racial makeup of the county was 89.63% White, 8.52% Black or African American, 0.19% Native American, 0.72% Asian, 0.02% Pacific Islander, 0.12% from other races, and 0.80% from two or more races. 0.92% of the population were Hispanic or Latino of any race. This number is around 0.3% based on a 2006 Census Estimate by the US Census Bureau.
There were 31,793 households out of which 28.60% had children under the age of 18 living with them, 54.30% were married couples living together, 11.90% had a female householder with no husband present, and 30.50% were non-families. 27.10% of all households were made up of individuals and 12.90% had someone living alone who was 65 years of age or older. The average household size was 2.38 and the average family size was 2.88.
The county population contained 21.50% under the age of 18, 8.70% from 18 to 24, 28.60% from 25 to 44, 25.70% from 45 to 64, and 15.40% who were 65 years of age or older. The median age was 40 years. For every 100 females there were 96.80 males. For every 100 females age 18 and over, there were 94.90 males.
The median income for a household in the county was $28,181, and the median income for a family was $35,315. Males had a median income of $33,000 versus $20,672 for females. The per capita income for the county was $16,233. About 14.60% of families and 18.50% of the population were below the poverty line, including 28.70% of those under age 18 and 10.50% of those age 65 or over.
2010 census
As of the 2010 United States Census, there were 78,859 people, 31,831 households, and 21,322 families in the county.[15] The population density was 130/sqmi (50.3/km²). There were 35,931 housing units at an average density of 59.4/sqmi (22.9/km²).[16] The racial makeup of the county was 88.5% white, 8.2% black or African American, 0.9% Asian, 0.2% American Indian, 0.4% from other races, and 1.7% from two or more races. Those of Hispanic or Latino origin made up 1.3% of the population.[15] In terms of ancestry, 41.8% were American, 9.1% were English, 8.6% were German, and 8.5% were Irish.[17]
Of the 31,831 households, 29.0% had children under the age of 18 living with them, 50.2% were married couples living together, 12.2% had a female householder with no husband present, 33.0% were non-families, and 28.6% of all households were made up of individuals. The average household size was 2.36 and the average family size was 2.87. The median age was 41.1 years.[15]
The median income for a household in the county was $38,036 and the median income for a family was $49,837. Males had a median income of $42,405 versus $27,347 for females. The per capita income for the county was $20,457. About 14.5% of families and 17.5% of the population were below the poverty line, including 26.1% of those under age 18 and 10.2% of those age 65 or over.[18]
Politics
Raleigh County voters have tended to vote Republican in recent decades. In 67% of national elections since 1980, the county selected the Republican Party candidate (as of 2016).
| Year | Republican | Democratic | Third parties |
|---|---|---|---|
| 2016 | 73.8% 22,048 | 21.6% 6,443 | 4.7% 1,401 |
| 2012 | 71.5% 20,614 | 26.8% 7,739 | 1.7% 484 |
| 2008 | 62.1% 17,548 | 36.2% 10,237 | 1.7% 474 |
| 2004 | 60.7% 18,519 | 38.7% 11,815 | 0.6% 191 |
| 2000 | 52.3% 12,587 | 45.9% 11,047 | 1.8% 427 |
| 1996 | 36.5% 8,628 | 53.1% 12,547 | 10.4% 2,447 |
| 1992 | 34.5% 8,700 | 52.2% 13,171 | 13.3% 3,343 |
| 1988 | 42.0% 10,395 | 57.7% 14,302 | 0.3% 85 |
| 1984 | 50.0% 14,571 | 49.6% 14,442 | 0.4% 109 |
| 1980 | 37.2% 10,713 | 58.8% 16,955 | 4.0% 1,163 |
| 1976 | 35.0% 10,637 | 65.0% 19,768 | |
| 1972 | 64.4% 19,150 | 35.6% 10,586 | |
| 1968 | 29.7% 8,775 | 60.1% 17,744 | 10.1% 2,987 |
| 1964 | 22.8% 6,952 | 77.3% 23,606 | |
| 1960 | 37.2% 12,088 | 62.9% 20,448 | |
| 1956 | 50.1% 16,318 | 49.9% 16,264 | |
| 1952 | 38.2% 14,005 | 61.9% 22,704 | |
| 1948 | 34.4% 10,414 | 65.1% 19,697 | 0.5% 148 |
| 1944 | 36.5% 10,323 | 63.5% 17,988 | |
| 1940 | 33.7% 11,752 | 66.3% 23,105 | |
| 1936 | 28.2% 9,001 | 71.6% 22,840 | 0.1% 44 |
| 1932 | 42.3% 11,441 | 57.1% 15,456 | 0.7% 181 |
| 1928 | 52.8% 11,581 | 47.2% 10,366 | |
| 1924 | 49.4% 8,643 | 44.5% 7,776 | 6.1% 1,067 |
| 1920 | 56.2% 7,668 | 43.4% 5,916 | 0.5% 62 |
| 1916 | 52.2% 3,791 | 45.7% 3,319 | 2.1% 151 |
| 1912 | 13.7% 897 | 35.9% 2,343 | 50.4% 3,288 |
Communities
City
- Beckley (county seat)
Magisterial districts
Current
- District 1
- District 2
- District 3
Historic
- Clear Fork
- Marsh Fork
- Richmond
- Shady Spring
- Slab Fork
- Town
- Trap Hill
Census-designated places
Unincorporated communities
- Abney
- Abraham
- Affinity
- Amigo
- Arnett
- Artie
- Dorothy
- Besoco
- Big Stick
- Blue Jay
- Blue Jay 6
- Cedar
- Cool Ridge
- Crow
- Dorothy
- Eastgulf
- Egeria
- Fireco
- Flat Top
- Glen Daniel
- Glen Morgan
- Grandview
- Hollywood
- Hot Coal
- Hotchkiss
- Jonben
- Josephine
- Killarney
- Lego
- Lillybrook
- McAlpin
- McVey
- Montcoal
- Naoma
- New
- Odd
- Pemberton
- Pickshin
- Pinepoca
- Pluto
- Price Hill
- Princewick
- Raleigh
- Redbird
- Rhodell
- Shiloh
- Slab Fork
- Soak Creek
- Sophia
- Stotesbury
- Sullivan
- Sylvia
- Tams
- Ury
- Whitby
- White Oak
- Willibet
- Winding Gulf
- Woodpeck
See also
References
- "State & County QuickFacts". United States Census Bureau. Retrieved January 11, 2014.
- "Find a County". National Association of Counties. Retrieved June 7, 2011.
- "Archived copy". Archived from the original on October 29, 2013. Retrieved May 30, 2015.CS1 maint: archived copy as title (link)
- Wood, Jim. Raleigh County: West Virginia, p. 91 (1994). BJW Printing & Office Supplies, Beckley WV
- Otis K. Rice & Stephen W. Brown, West Virginia: A History, 2nd ed., University Press of Kentucky, Lexington (1993), p. 240.
- United States Census Bureau, U.S. Decennial Census, Tables of Minor Civil Divisions in West Virginia, 1870–2010.
- Raleigh County WV Google Maps (accessed 20 March 2019)
- ""Find an Altitude/Raleigh County WV" Google Maps (accessed 20 March 2019)". Archived from the original on May 21, 2019. Retrieved March 20, 2019.
- "2010 Census Gazetteer Files". US Census Bureau. August 22, 2012. Retrieved July 30, 2015.
- "Population and Housing Unit Estimates". Retrieved May 21, 2019.
- "US Decennial Census". US Census Bureau. Retrieved January 11, 2014.
- "Historical Census Browser". University of Virginia Library. Retrieved January 11, 2014.
- "Population of Counties by Decennial Census: 1900 to 1990". US Census Bureau. Retrieved January 11, 2014.
- "Census 2000 PHC-T-4. Ranking Tables for Counties: 1990 and 2000" (PDF). US Census Bureau. Retrieved January 11, 2014.
- "Profile of General Population and Housing Characteristics: 2010 Demographic Profile Data". US Census Bureau. Archived from the original on February 13, 2020. Retrieved April 3, 2016.
- "Population, Housing Units, Area, and Density: 2010 - County". US Census Bureau. Archived from the original on February 13, 2020. Retrieved April 3, 2016.
- "Selected Social Characteristics in the US – 2006-2010 American Community Survey 5-Year Estimates". US Census Bureau. Archived from the original on February 13, 2020. Retrieved April 3, 2016.
- "Selected Economic Characteristics – 2006-2010 American Community Survey 5-Year Estimates". US Census Bureau. Archived from the original on February 13, 2020. Retrieved April 3, 2016.
- Leip, David. "Atlas of US Presidential Elections". uselectionatlas.org. Retrieved March 28, 2018.
External links
| Wikisource has the text of an 1879 American Cyclopædia article about Raleigh County, West Virginia. |
- Beckley-Raleigh County Chamber of Commerce
- Raleigh County Government
- Raleigh County Board of Education
- History of Raleigh County Flag
Places adjacent to Raleigh County, West Virginia | ||||||||||
|---|---|---|---|---|---|---|---|---|---|---|
| ||||||||||

| Authority control |
|
|---|