Grant County, West Virginia
Grant County is a county in the U.S. state of West Virginia. As of the 2010 census, the population was 11,937.[1] Its county seat is Petersburg.[2] The county was created from Hardy County in 1866 and named for Civil War General Ulysses S. Grant.[3]
Grant County | |
|---|---|
 Old Grant County Courthouse in Petersburg, WV | |
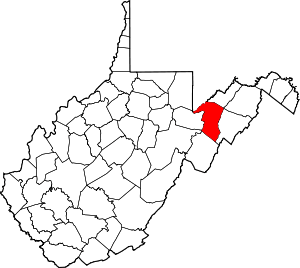 Location within the U.S. state of West Virginia | |
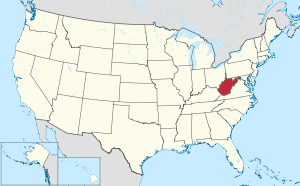 West Virginia's location within the U.S. | |
| Coordinates: 39°06′N 79°12′W | |
| Country | |
| State | |
| Founded | February 14, 1866 |
| Named for | Ulysses S. Grant |
| Seat | Petersburg |
| Largest city | Petersburg |
| Area | |
| • Total | 480 sq mi (1,200 km2) |
| • Land | 477 sq mi (1,240 km2) |
| • Water | 2.9 sq mi (8 km2) 0.6%% |
| Population (2010) | |
| • Total | 11,937 |
| • Estimate (2018) | 11,626 |
| • Density | 25/sq mi (9.6/km2) |
| Time zone | UTC−5 (Eastern) |
| • Summer (DST) | UTC−4 (EDT) |
| Congressional district | 1st |
| Website | www |


History
The territory that became Grant County in 1866 was originally part of Hampshire County, the oldest county formed within the present boundaries of West Virginia, in 1754. In 1786, Hardy County was formed from the southern portion of Hampshire County. The county's boundaries were relatively stable from 1788 until 1866, when Grant County was formed from the western portion of Hardy. The first counties formed in the state following the admission of West Virginia to the Union were Grant and Mineral in 1866, the latter formed from the western portion of Hampshire County, and thus adjoining Grant. They were the fifty-first and fifty-second counties in West Virginia, and only Logan, Summers, and Mingo were created after them.
Beginning in 1863, West Virginia's counties were divided into civil townships, with the intention of encouraging local government. This proved impractical in the heavily rural state, and in 1872 the townships were converted into magisterial districts.[4] Between its establishment and 1870, Grant County was divided into three townships: Grant, Milroy, and Union, which became magisterial districts in 1872.[5]
Most of the 47 people killed in the 1985 Election day floods were in Pendleton and Grant counties, according to the National Weather Service.[6] At Franklin, the Pendleton County seat, the South Branch of the Potomac River crested at 22.6 feet during the incident. Flood stage in the shallow riverbed was only 7 feet.[6]
Geography
According to the U.S. Census Bureau, the county has a total area of 480 square miles (1,200 km2), of which 477 square miles (1,240 km2) is land and 2.9 square miles (7.5 km2) (0.6%) is water.[7]
Major highways


Adjacent counties
- Mineral County (northeast)
- Hardy County (east)
- Pendleton County (south)
- Randolph County (southwest)
- Tucker County (west)
- Preston County (northwest)
- Garrett County, Maryland (northwest)
National protected areas
Demographics
| Historical population | |||
|---|---|---|---|
| Census | Pop. | %± | |
| 1870 | 4,467 | — | |
| 1880 | 5,542 | 24.1% | |
| 1890 | 6,802 | 22.7% | |
| 1900 | 7,275 | 7.0% | |
| 1910 | 7,838 | 7.7% | |
| 1920 | 8,993 | 14.7% | |
| 1930 | 8,441 | −6.1% | |
| 1940 | 8,805 | 4.3% | |
| 1950 | 8,756 | −0.6% | |
| 1960 | 8,304 | −5.2% | |
| 1970 | 8,607 | 3.6% | |
| 1980 | 10,210 | 18.6% | |
| 1990 | 10,428 | 2.1% | |
| 2000 | 11,299 | 8.4% | |
| 2010 | 11,937 | 5.6% | |
| Est. 2018 | 11,626 | [8] | −2.6% |
| U.S. Decennial Census[9] 1790–1960[10] 1900–1990[11] 1990–2000[12] 2010–2018[1] | |||
2000 census
As of the census[13] of 2000, there were 11,299 people, 4,591 households, and 3,273 families living in the county. The population density was 24 people per square mile (9/km²). There were 6,105 housing units at an average density of 13 per square mile (5/km²). The racial makeup of the county was 98.33% White, 0.67% Black or African American, 0.26% Indigenous American, 0.14% Asian, 0.02% Pacific Islander, 0.13% from other races, and 0.45% from two or more races. 0.55% of the population were Hispanic or Latino of any race.
There were 4,591 households out of which 30.20% had children under the age of 18 living with them, 59.50% were married couples living together, 8.20% had a female householder with no husband present, and 28.70% were non-families. 24.50% of all households were made up of individuals and 11.30% had someone living alone who was 65 years of age or older. The average household size was 2.43 and the average family size was 2.87.
In the county, the population was spread out with 22.70% under the age of 18, 7.80% from 18 to 24, 27.50% from 25 to 44, 26.80% from 45 to 64, and 15.30% who were 65 years of age or older. The median age was 39 years. For every 100 females there were 97.70 males. For every 100 females age 18 and over, there were 94.50 males.
The median income for a household in the county was $28,916, and the median income for a family was $33,813. Males had a median income of $24,796 versus $18,354 for females. The per capita income for the county was $15,696. About 12.60% of families and 16.30% of the population were below the poverty line, including 21.00% of those under age 18 and 18.70% of those age 65 or over.
2010 census
As of the 2010 United States Census, there were 11,937 people, 4,941 households, and 3,435 families living in the county.[14] The population density was 25.0 inhabitants per square mile (9.7/km2). There were 6,366 housing units at an average density of 13.3 per square mile (5.1/km2).[15] The racial makeup of the county was 97.7% white, 0.7% black or African American, 0.2% Asian, 0.2% American Indian, 0.5% from other races, and 0.9% from two or more races. Those of Hispanic or Latino origin made up 1.0% of the population.[14] In terms of ancestry, 26.9% were German, 15.0% were American, 9.3% were Irish, and 5.3% were English.[16]
Of the 4,941 households, 29.3% had children under the age of 18 living with them, 56.3% were married couples living together, 8.3% had a female householder with no husband present, 30.5% were non-families, and 25.7% of all households were made up of individuals. The average household size was 2.39 and the average family size was 2.84. The median age was 44.0 years.[14]
The median income for a household in the county was $35,593 and the median income for a family was $46,193. Males had a median income of $35,000 versus $24,643 for females. The per capita income for the county was $19,358. About 10.6% of families and 12.9% of the population were below the poverty line, including 15.0% of those under age 18 and 12.8% of those age 65 or over.[17]
Communities
City
- Petersburg (county seat)
Town
Magisterial districts
- Grant
- Milroy
- Union
Unincorporated communities
Politics
Politically, Grant County is a massive outlier in West Virginia. While the rest of the state did not become a Republican bastion until the 21st century after having leaned heavily Democratic between the New Deal and Bill Clinton, Grant County has always been among the most strongly Republican counties in the country. Since Grant County was created in 1866, no Democrat has managed to receive 40 percent of the county’s vote in any Presidential election, even in national Democratic landslides. The only Republican to ever lose Grant County has been William Howard Taft in 1912 when the GOP was divided and Progressive Theodore Roosevelt claimed the majority of the county’s vote.
As a measure of how powerfully Republican Grant County has been over the years, Franklin Delano Roosevelt never tallied more than 25.4 percent of the vote in any of his four successful campaigns, and Lyndon Johnson only managed 37.8 percent in 1964. Jimmy Carter is the only other Democrat to have cracked the 30 percent barrier. However, at the state level, Grant County voted for popular Democratic governor Joe Manchin over his GOP opponent Russ Weeks by around a 59.9% to 37.2% margin.[18]
Notably, in 2016, Donald Trump received the highest percentage of the vote ever cast for a presidential candidate in this county, holding Democratic candidate Hillary Clinton to just slightly over 10% of the vote.
| Year | Republican | Democratic | Third parties |
|---|---|---|---|
| 2016 | 87.5% 4,346 | 10.3% 512 | 2.2% 107 |
| 2012 | 82.5% 3,783 | 15.7% 718 | 1.9% 87 |
| 2008 | 75.1% 3,166 | 23.6% 997 | 1.3% 55 |
| 2004 | 80.5% 4,063 | 19.1% 963 | 0.4% 21 |
| 2000 | 78.8% 3,571 | 19.7% 891 | 1.6% 72 |
| 1996 | 60.5% 2,599 | 28.1% 1,206 | 11.5% 492 |
| 1992 | 64.3% 2,762 | 23.5% 1,011 | 12.2% 525 |
| 1988 | 77.9% 3,215 | 21.6% 893 | 0.5% 22 |
| 1984 | 81.6% 3,715 | 18.2% 828 | 0.2% 11 |
| 1980 | 75.2% 3,452 | 22.7% 1,041 | 2.1% 98 |
| 1976 | 69.2% 2,976 | 30.8% 1,323 | |
| 1972 | 85.3% 3,556 | 14.7% 614 | |
| 1968 | 73.8% 2,936 | 19.8% 786 | 6.4% 256 |
| 1964 | 62.3% 2,464 | 37.8% 1,494 | |
| 1960 | 78.6% 3,333 | 21.4% 908 | |
| 1956 | 84.3% 3,408 | 15.7% 634 | |
| 1952 | 83.0% 3,282 | 17.0% 674 | |
| 1948 | 80.8% 2,816 | 19.1% 664 | 0.1% 4 |
| 1944 | 84.0% 2,996 | 16.0% 570 | |
| 1940 | 78.9% 3,195 | 21.2% 857 | |
| 1936 | 74.5% 2,923 | 25.4% 995 | 0.1% 5 |
| 1932 | 72.2% 2,477 | 26.8% 920 | 1.1% 36 |
| 1928 | 82.8% 2,648 | 17.0% 542 | 0.2% 7 |
| 1924 | 75.5% 2,344 | 21.2% 658 | 3.3% 103 |
| 1920 | 82.2% 2,417 | 16.7% 492 | 1.1% 33 |
| 1916 | 78.4% 1,438 | 21.3% 391 | 0.3% 5 |
| 1912 | 20.0% 349 | 20.4% 356 | 59.6% 1,038 |
References
- "State & County QuickFacts". United States Census Bureau. Archived from the original on June 7, 2011. Retrieved January 10, 2014.
- "Find a County". National Association of Counties. Archived from the original on 2011-05-31. Retrieved 2011-06-07.
- "Archived copy". Archived from the original on 2012-12-30. Retrieved 2013-01-29.CS1 maint: archived copy as title (link)
- Otis K. Rice & Stephen W. Brown, West Virginia: A History, 2nd ed., University Press of Kentucky, Lexington (1993), p. 240.
- United States Census Bureau, U.S. Decennial Census, Tables of Minor Civil Divisions in West Virginia, 1870–2010.
- West Virginia Gazette: "Remembering the '85 floods" (D. White) 4 Nov 2010
- "2010 Census Gazetteer Files". United States Census Bureau. August 22, 2012. Retrieved July 24, 2015.
- "Population and Housing Unit Estimates". Retrieved June 10, 2019.
- "U.S. Decennial Census". United States Census Bureau. Retrieved January 10, 2014.
- "Historical Census Browser". University of Virginia Library. Retrieved January 10, 2014.
- "Population of Counties by Decennial Census: 1900 to 1990". United States Census Bureau. Retrieved January 10, 2014.
- "Census 2000 PHC-T-4. Ranking Tables for Counties: 1990 and 2000" (PDF). United States Census Bureau. Retrieved January 10, 2014.
- "U.S. Census website". United States Census Bureau. Retrieved May 14, 2011.
- "DP-1 Profile of General Population and Housing Characteristics: 2010 Demographic Profile Data". United States Census Bureau. Archived from the original on 2020-02-13. Retrieved 2016-04-03.
- "Population, Housing Units, Area, and Density: 2010 - County". United States Census Bureau. Archived from the original on 2020-02-13. Retrieved 2016-04-03.
- "DP02 SELECTED SOCIAL CHARACTERISTICS IN THE UNITED STATES – 2006-2010 American Community Survey 5-Year Estimates". United States Census Bureau. Archived from the original on 2020-02-13. Retrieved 2016-04-03.
- "DP03 SELECTED ECONOMIC CHARACTERISTICS – 2006-2010 American Community Survey 5-Year Estimates". United States Census Bureau. Archived from the original on 2020-02-13. Retrieved 2016-04-03.
- Leip, Dave. "2008 Gubernatorial Election Results- West Virginia". Dave Leip's Atlas. Retrieved 23 November 2019.
- Leip, David. "Dave Leip's Atlas of U.S. Presidential Elections". uselectionatlas.org. Retrieved 2018-03-27.
External links
| Wikimedia Commons has media related to Grant County, West Virginia. |
- Grant County - Gateway to the Potomac Highlands
- Grant County Chamber of Commerce
- Grant County Press
- Grant County Development Authority
- Grant County Schools
- Grant County Historical/Genealogy Society, Inc.
- WVGenWeb Grant County
Places adjacent to Grant County, West Virginia | ||||||||||
|---|---|---|---|---|---|---|---|---|---|---|
| ||||||||||
Municipalities and communities of Grant County, West Virginia, United States | ||
|---|---|---|
| City | Map of West Virginia highlighting Grant County | |
| Town | ||
| Unincorporated communities | ||
| Footnotes | ‡This populated place also has portions in an adjacent county or counties | |

| Authority control |
|
|---|