Lewis County, West Virginia
Lewis County is a county in the U.S. state of West Virginia. As of the 2010 census, the population was 16,372.[1] Its county seat is Weston.[2] The county was formed in 1816 from Harrison County.[3]
Lewis County | |
|---|---|
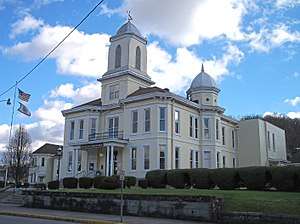 Lewis County Courthouse | |
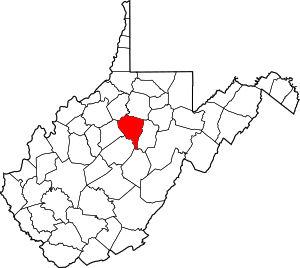 Location within the U.S. state of West Virginia | |
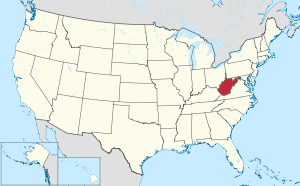 West Virginia's location within the U.S. | |
| Coordinates: 39°00′N 80°31′W | |
| Country | |
| State | |
| Founded | December 18, 1816 |
| Seat | Weston |
| Largest city | Weston |
| Area | |
| • Total | 390 sq mi (1,000 km2) |
| • Land | 385 sq mi (1,000 km2) |
| • Water | 4.8 sq mi (12 km2) 1.2%% |
| Population (2010) | |
| • Total | 16,372 |
| • Estimate (2018) | 16,024 |
| • Density | 42/sq mi (16/km2) |
| Time zone | UTC−5 (Eastern) |
| • Summer (DST) | UTC−4 (EDT) |
| Congressional district | 2nd |
| Website | www |
Geography
According to the U.S. Census Bureau, the county has a total area of 390 square miles (1,000 km2), of which 385 square miles (1,000 km2) is land and 4.8 square miles (12 km2) (1.2%) is water.[4]
In 1863, West Virginia's counties were divided into civil townships, with the intention of encouraging local government. This proved impractical in the heavily rural state, and in 1872 the townships were converted into magisterial districts.[5] Lewis County was initially divided into five townships: Battelle, Jane Lew, Lincoln, Sheridan, and Willey. Between 1870 and 1880, these were renamed "Collins Settlement", "Court House", "Freemans Creek",[lower-roman 1] "Hackers Creek",[lower-roman 2] and "Skin Creek". In the 1990s, Collins Settlement and Court House Districts were consolidated into one district, known as "Courthouse-Collins Settlement"; Hackers Creek and Skin Creek were also consolidated, forming "Hackers Creek-Skin Creek".[6]
Major highways
.svg.png)


Adjacent counties
- Harrison County (north)
- Upshur County (east)
- Webster County (south)
- Braxton County (southwest)
- Gilmer County (west)
- Doddridge County (northwest)
Demographics
| Historical population | |||
|---|---|---|---|
| Census | Pop. | %± | |
| 1820 | 4,247 | — | |
| 1830 | 6,241 | 47.0% | |
| 1840 | 8,151 | 30.6% | |
| 1850 | 10,031 | 23.1% | |
| 1860 | 7,999 | −20.3% | |
| 1870 | 10,175 | 27.2% | |
| 1880 | 13,269 | 30.4% | |
| 1890 | 15,895 | 19.8% | |
| 1900 | 16,980 | 6.8% | |
| 1910 | 18,821 | 10.8% | |
| 1920 | 20,455 | 8.7% | |
| 1930 | 21,794 | 6.5% | |
| 1940 | 22,271 | 2.2% | |
| 1950 | 21,074 | −5.4% | |
| 1960 | 19,711 | −6.5% | |
| 1970 | 17,847 | −9.5% | |
| 1980 | 18,813 | 5.4% | |
| 1990 | 17,223 | −8.5% | |
| 2000 | 16,919 | −1.8% | |
| 2010 | 16,372 | −3.2% | |
| Est. 2018 | 16,024 | [7] | −2.1% |
| U.S. Decennial Census[8] 1790–1960[9] 1900–1990[10] 1990–2000[11] 2010–2018[1] | |||
2000 census
As of the census[12] of 2000, there were 16,919 people, 6,946 households, and 4,806 families living in the county. The population density was 44 people per square mile (17/km²). There were 7,944 housing units at an average density of 21 per square mile (8/km²). The racial makeup of the county was 98.59% White, 0.13% Black or African American, 0.20% Native American, 0.29% Asian, 0.08% from other races, and 0.70% from two or more races. 0.50% of the population were Hispanic or Latino of any race.
There were 6,946 households out of which 28.60% had children under the age of 18 living with them, 54.60% were married couples living together, 10.50% had a female householder with no husband present, and 30.80% were non-families. 26.90% of all households were made up of individuals and 13.00% had someone living alone who was 65 years of age or older. The average household size was 2.40 and the average family size was 2.88.
In the county, the population was spread out with 22.10% under the age of 18, 7.70% from 18 to 24, 28.00% from 25 to 44, 25.90% from 45 to 64, and 16.40% who were 65 years of age or older. The median age was 40 years. For every 100 females there were 94.20 males. For every 100 females age 18 and over, there were 91.40 males.
The median income for a household in the county was $27,066, and the median income for a family was $32,431. Males had a median income of $27,906 versus $18,733 for females. The per capita income for the county was $13,933. 19.90% of the population and 16.30% of families were below the poverty line. 27.00% of those under the age of 18 and 11.20% of those 65 and older were living below the poverty line.
2010 census
As of the 2010 United States Census, there were 16,372 people, 6,863 households, and 4,570 families living in the county.[13] The population density was 42.5 inhabitants per square mile (16.4/km2). There were 7,958 housing units at an average density of 20.7 per square mile (8.0/km2).[14] The racial makeup of the county was 97.9% white, 0.5% black or African American, 0.3% Asian, 0.2% American Indian, 0.1% from other races, and 1.0% from two or more races. Those of Hispanic or Latino origin made up 0.6% of the population.[13] In terms of ancestry, 17.5% were American, 15.0% were German, 9.9% were Irish, and 7.2% were English.[15]
Of the 6,863 households, 28.1% had children under the age of 18 living with them, 50.9% were married couples living together, 10.9% had a female householder with no husband present, 33.4% were non-families, and 28.5% of all households were made up of individuals. The average household size was 2.35 and the average family size was 2.84. The median age was 43.4 years.[13]
The median income for a household in the county was $33,293 and the median income for a family was $42,281. Males had a median income of $31,950 versus $25,945 for females. The per capita income for the county was $18,240. About 13.6% of families and 19.6% of the population were below the poverty line, including 25.3% of those under age 18 and 12.9% of those age 65 or over.[16]
Politics
| Year | Republican | Democratic | Third parties |
|---|---|---|---|
| 2016 | 76.0% 5,274 | 19.4% 1,347 | 4.6% 315 |
| 2012 | 69.5% 4,375 | 27.6% 1,736 | 2.9% 183 |
| 2008 | 65.6% 4,335 | 31.9% 2,109 | 2.5% 164 |
| 2004 | 63.5% 4,445 | 35.4% 2,475 | 1.1% 79 |
| 2000 | 58.8% 3,606 | 38.4% 2,355 | 2.8% 173 |
| 1996 | 37.0% 2,285 | 46.5% 2,868 | 16.5% 1,020 |
| 1992 | 36.8% 2,413 | 44.7% 2,931 | 18.6% 1,219 |
| 1988 | 52.1% 3,602 | 47.4% 3,272 | 0.5% 34 |
| 1984 | 66.0% 5,297 | 33.5% 2,693 | 0.5% 41 |
| 1980 | 49.2% 3,747 | 45.4% 3,455 | 5.4% 409 |
| 1976 | 48.5% 3,736 | 51.5% 3,960 | |
| 1972 | 73.7% 5,778 | 26.3% 2,062 | |
| 1968 | 51.4% 4,027 | 40.4% 3,168 | 8.2% 640 |
| 1964 | 36.2% 2,979 | 63.8% 5,248 | |
| 1960 | 58.6% 5,157 | 41.4% 3,649 | |
| 1956 | 66.0% 6,203 | 34.0% 3,194 | |
| 1952 | 65.6% 6,254 | 34.4% 3,280 | |
| 1948 | 57.9% 4,829 | 41.7% 3,477 | 0.4% 35 |
| 1944 | 59.8% 4,984 | 40.2% 3,350 | |
| 1940 | 56.5% 5,935 | 43.5% 4,566 | |
| 1936 | 49.6% 5,499 | 49.9% 5,531 | 0.5% 54 |
| 1932 | 45.3% 4,704 | 53.4% 5,546 | 1.3% 131 |
| 1928 | 57.4% 5,290 | 41.5% 3,825 | 1.2% 106 |
| 1924 | 51.1% 4,839 | 46.6% 4,410 | 2.3% 221 |
| 1920 | 57.1% 4,618 | 41.0% 3,310 | 1.9% 154 |
| 1916 | 49.1% 2,263 | 48.7% 2,248 | 2.2% 102 |
| 1912 | 24.2% 1,029 | 45.4% 1,929 | 30.4% 1,292 |
Communities
City
- Weston (county seat)
Town
Magisterial districts
- Courthouse-Collins Settlement
- Freemans Creek
- Hackers Creek-Skin Creek
Unincorporated communities
- Aberdeen
- Alkires Mills
- Alum Bridge
- Arnold
- Aspinall
- Bablin
- Bealls Mills
- Ben Dale
- Bennett
- Berlin
- Brownsville
- Butchersville
- Camden
- Churchville
- Copley
- Cox Town
- Crawford
- Emmart
- Freemansburg
- Gaston
- Georgetown
- Homewood
- Horner
- Ireland
- Jackson Mill
- Jacksonville
- Kitsonville
- Lightburn
- McGuire Park
- Orlando
- Pickle Street
- Roanoke
- Turnertown
- Walkersville
- Valley Chapel
- Vadis
See also
- National Register of Historic Places listings in Lewis County, West Virginia
- Stonewall Jackson Lake
- Stonewall Resort State Park
- Lewis County Schools
Footnotes
- Originally spelled "Freeman's Creek".
- Originally spelled "Hacker's Creek".
References
- "State & County QuickFacts". United States Census Bureau. Archived from the original on June 7, 2011. Retrieved January 10, 2014.
- "Find a County". National Association of Counties. Retrieved June 7, 2011.
- "West Virginia Counties". www.wvculture.org. Retrieved March 27, 2018.
- "2010 Census Gazetteer Files". United States Census Bureau. August 22, 2012. Retrieved July 24, 2015.
- Otis K. Rice & Stephen W. Brown, West Virginia: A History, 2nd ed., University Press of Kentucky, Lexington (1993), p. 240.
- United States Census Bureau, U.S. Decennial Census, Tables of Minor Civil Divisions in West Virginia, 1870–2010.
- "Population and Housing Unit Estimates". Retrieved May 24, 2019.
- "U.S. Decennial Census". United States Census Bureau. Retrieved January 10, 2014.
- "Historical Census Browser". University of Virginia Library. Retrieved January 10, 2014.
- "Population of Counties by Decennial Census: 1900 to 1990". United States Census Bureau. Retrieved January 10, 2014.
- "Census 2000 PHC-T-4. Ranking Tables for Counties: 1990 and 2000" (PDF). United States Census Bureau. Retrieved January 10, 2014.
- "U.S. Census website". United States Census Bureau. Retrieved May 14, 2011.
- "DP-1 Profile of General Population and Housing Characteristics: 2010 Demographic Profile Data". United States Census Bureau. Archived from the original on February 13, 2020. Retrieved April 3, 2016.
- "Population, Housing Units, Area, and Density: 2010 - County". United States Census Bureau. Archived from the original on February 13, 2020. Retrieved April 3, 2016.
- "DP02 SELECTED SOCIAL CHARACTERISTICS IN THE UNITED STATES – 2006-2010 American Community Survey 5-Year Estimates". United States Census Bureau. Archived from the original on February 13, 2020. Retrieved April 3, 2016.
- "DP03 SELECTED ECONOMIC CHARACTERISTICS – 2006-2010 American Community Survey 5-Year Estimates". United States Census Bureau. Archived from the original on February 13, 2020. Retrieved April 3, 2016.
- Leip, David. "Dave Leip's Atlas of U.S. Presidential Elections". uselectionatlas.org. Retrieved March 27, 2018.
Places adjacent to Lewis County, West Virginia | ||||||||||
|---|---|---|---|---|---|---|---|---|---|---|
| ||||||||||
Municipalities and communities of Lewis County, West Virginia, United States | ||
|---|---|---|
| City | Lewis County map | |
| Town | ||
| Unincorporated communities |
| |
| Footnotes | ‡This populated place also has portions in an adjacent county or counties | |
| Authority control |
|
|---|