Marion County, West Virginia
Marion County is a county in the U.S. state of West Virginia. As of the 2010 census, the population was 56,418.[1] Its county seat is Fairmont.[2] The county was named in honor of General Francis Marion (ca. 1732–1795), known to history as "The Swamp Fox".
Marion County | |
|---|---|
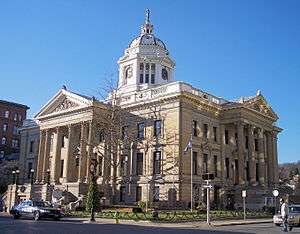 Marion County Courthouse in Fairmont | |
 Seal | |
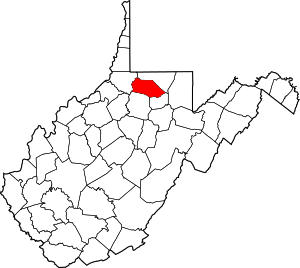 Location within the U.S. state of West Virginia | |
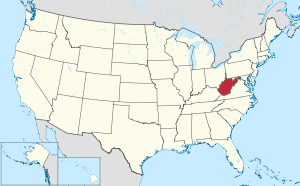 West Virginia's location within the U.S. | |
| Coordinates: 39°31′N 80°14′W | |
| Country | |
| State | |
| Founded | January 14, 1842 |
| Named for | Francis Marion |
| Seat | Fairmont |
| Largest city | Fairmont |
| Area | |
| • Total | 312 sq mi (810 km2) |
| • Land | 309 sq mi (800 km2) |
| • Water | 2.8 sq mi (7 km2) 0.9%% |
| Population (2010) | |
| • Total | 56,418 |
| • Estimate (2018) | 56,097 |
| • Density | 180/sq mi (70/km2) |
| Time zone | UTC−5 (Eastern) |
| • Summer (DST) | UTC−4 (EDT) |
| Congressional district | 1st |
| Website | www |
Marion County comprises the Fairmont, WV Micropolitan Statistical Area, which is also part of the Morgantown-Fairmont, WV Combined Statistical Area.
History
Although the Adena and successor Hopewell cultures had flourished in this area at one time, the region which includes the land now known as Marion County was sparsely occupied by Native Americans, if at all, in the late 18th century; like much of the Ohio Valley, it had been depopulated by the Iroquois during the later Beaver Wars (1670–1700). Only a few abortive attempts to start European settlements upon the Monongahela River or its branches (such as that which gave its name to Dunkard Creek) are known prior to the French and Indian War, and it was not until the year 1772 that any permanent settlements were made in this region.[3]
Marion County proper was created by an act of the Virginia Assembly on January 14, 1842, from parts of Monongalia and Harrison Counties, and was named after General Francis Marion, of American Revolutionary War fame, known to history as "The Swamp Fox".[4]
The year 1852 was an eventful time in Marion County's history, starting with the great flood on Monday, April 5. Heavy rains the day before caused the Monongahela and West Fork Rivers to rise at rate of 5 feet per hour until Tuesday afternoon, when the water reached 43 feet above its normal level. The greatest damage was sustained on the West Fork, where over 40 houses and buildings were swept away and floated past Fairmont. The flood also damaged the railroad, which was in the final stages of being completed. By June 23 the Baltimore and Ohio Railroad was completed, connecting Fairmont to the west and to large cities in the east like Baltimore. The railroad required the building of a bridge to cross the Monongahela River about 1 mile west of Fairmont. This was achieved by building a massive iron bridge spanning 650 feet and lifted 35 feet above the water. The third major event of the year 1852 was the completion of the Fairmont and Palatine suspension bridge, connecting Fairmont to what was then the town of Palatine. The bridge was built under the direction of James L. Randolph, assistant engineer of the Baltimore and Ohio Railroad; at a cost of about thirty thousand dollars.[5]
Marion was one of fifty Virginia counties that were admitted to the Union as the state of West Virginia on June 20, 1863, at the height of the Civil War. In the months that followed, West Virginia's counties were divided into civil townships, with the intention of encouraging local government. This proved impractical in the heavily rural state, and in 1872 the townships were converted into magisterial districts.[6] Marion County was divided into seven districts: Fairmont, Grant, Lincoln, Mannington, Paw Paw,[lower-roman 1] Union, and Winfield. In the 1980s, the historic magisterial districts were consolidated into three new districts: Middletown, Palatine, and West Augusta.[7]
Geography
According to the U.S. Census Bureau, the county has a total area of 312 square miles (810 km2), of which 309 square miles (800 km2) is land and 2.8 square miles (7.3 km2) (0.9%) is water.[8]
Major highways
.svg.png)


Adjacent counties
- Monongalia County (north)
- Taylor County (southeast)
- Harrison County (south)
- Wetzel County (west)
Demographics
| Historical population | |||
|---|---|---|---|
| Census | Pop. | %± | |
| 1850 | 10,552 | — | |
| 1860 | 12,722 | 20.6% | |
| 1870 | 12,107 | −4.8% | |
| 1880 | 17,198 | 42.1% | |
| 1890 | 20,721 | 20.5% | |
| 1900 | 32,430 | 56.5% | |
| 1910 | 42,794 | 32.0% | |
| 1920 | 54,571 | 27.5% | |
| 1930 | 66,655 | 22.1% | |
| 1940 | 68,683 | 3.0% | |
| 1950 | 71,521 | 4.1% | |
| 1960 | 63,717 | −10.9% | |
| 1970 | 61,356 | −3.7% | |
| 1980 | 65,789 | 7.2% | |
| 1990 | 57,249 | −13.0% | |
| 2000 | 56,598 | −1.1% | |
| 2010 | 56,418 | −0.3% | |
| Est. 2018 | 56,097 | [9] | −0.6% |
| U.S. Decennial Census[10] 1790–1960[11] 1900–1990[12] 1990–2000[13] 2010–2018[1] | |||
2000 census
As of the census[14] of 2000, there were 56,598 people, 23,652 households, and 15,515 families living in the county. The population density was 183 people per square mile (71/km²). There were 26,660 housing units at an average density of 86 per square mile (33/km²). The racial makeup of the county was 95.10% White, 3.22% Black or African American, 0.20% Native American, 0.41% Asian, 0.01% Pacific Islander, 0.13% from other races, and 0.93% from two or more races. 0.70% of the population were Hispanic or Latino of any race.
There were 23,652 households out of which 26.00% had children under the age of 18 living with them, 51.40% were married couples living together, 10.70% had a female householder with no husband present, and 34.40% were non-families. 28.90% of all households were made up of individuals and 13.90% had someone living alone who was 65 years of age or older. The average household size was 2.34 and the average family size was 2.88.
In the county, the population was spread out with 20.60% under the age of 18, 10.50% from 18 to 24, 26.40% from 25 to 44, 24.70% from 45 to 64, and 17.80% who were 65 years of age or older. The median age was 40 years. For every 100 females there were 90.60 males. For every 100 females age 18 and over, there were 87.30 males.
The median income for a household in the county was $28,626, and the median income for a family was $37,182. Males had a median income of $29,005 versus $21,100 for females. The per capita income for the county was $16,246. About 11.70% of families and 16.30% of the population were below the poverty line, including 21.30% of those under age 18 and 8.70% of those age 65 or over.
2010 census
As of the 2010 United States Census, there were 56,418 people, 23,786 households, and 15,271 families living in the county.[15] The population density was 182.7 inhabitants per square mile (70.5/km2). There were 26,463 housing units at an average density of 85.7 per square mile (33.1/km2).[16] The racial makeup of the county was 94.3% white, 3.3% black or African American, 0.5% Asian, 0.2% American Indian, 0.2% from other races, and 1.5% from two or more races. Those of Hispanic or Latino origin made up 0.9% of the population.[15] In terms of ancestry, 23.5% were German, 17.8% were Irish, 13.7% were American, 12.0% were English, and 10.3% were Italian.[17]
Of the 23,786 households, 27.1% had children under the age of 18 living with them, 48.5% were married couples living together, 11.1% had a female householder with no husband present, 35.8% were non-families, and 29.3% of all households were made up of individuals. The average household size was 2.32 and the average family size was 2.85. The median age was 41.0 years.[15]
The median income for a household in the county was $38,115 and the median income for a family was $49,046. Males had a median income of $38,948 versus $27,179 for females. The per capita income for the county was $20,752. About 11.3% of families and 16.8% of the population were below the poverty line, including 24.0% of those under age 18 and 8.6% of those age 65 or over.[18]
Politics
| Year | Republican | Democratic | Third parties |
|---|---|---|---|
| 2016 | 62.8% 14,668 | 29.8% 6,964 | 7.4% 1,732 |
| 2012 | 55.9% 12,054 | 41.6% 8,959 | 2.5% 540 |
| 2008 | 48.5% 11,501 | 48.9% 11,618 | 2.6% 621 |
| 2004 | 48.2% 12,150 | 50.7% 12,771 | 1.1% 273 |
| 2000 | 43.6% 9,972 | 53.8% 12,315 | 2.6% 586 |
| 1996 | 27.9% 6,160 | 58.8% 12,994 | 13.4% 2,953 |
| 1992 | 25.3% 6,380 | 55.7% 14,042 | 18.9% 4,772 |
| 1988 | 38.9% 9,229 | 60.8% 14,441 | 0.3% 72 |
| 1984 | 48.5% 13,106 | 51.2% 13,833 | 0.3% 81 |
| 1980 | 41.4% 10,952 | 53.6% 14,189 | 5.0% 1,330 |
| 1976 | 36.9% 10,391 | 63.1% 17,800 | |
| 1972 | 57.6% 16,095 | 42.4% 11,864 | |
| 1968 | 34.8% 10,177 | 58.9% 17,246 | 6.3% 1,838 |
| 1964 | 25.9% 7,707 | 74.1% 22,047 | |
| 1960 | 44.1% 14,138 | 55.9% 17,903 | |
| 1956 | 49.9% 16,112 | 50.1% 16,192 | |
| 1952 | 43.0% 14,979 | 57.0% 19,890 | |
| 1948 | 35.7% 11,201 | 63.4% 19,866 | 0.9% 290 |
| 1944 | 39.6% 11,584 | 60.4% 17,640 | |
| 1940 | 38.8% 13,349 | 61.2% 21,035 | |
| 1936 | 35.2% 11,403 | 64.3% 20,859 | 0.6% 181 |
| 1932 | 42.9% 12,638 | 54.2% 15,975 | 2.9% 851 |
| 1928 | 60.3% 16,088 | 38.0% 10,133 | 1.7% 442 |
| 1924 | 50.6% 12,167 | 39.0% 9,386 | 10.4% 2,513 |
| 1920 | 55.2% 11,494 | 42.0% 8,734 | 2.8% 583 |
| 1916 | 42.8% 4,443 | 52.9% 5,493 | 4.3% 443 |
| 1912 | 17.2% 1,625 | 48.1% 4,535 | 34.7% 3,273 |
Communities
Cities
- Fairmont (county seat)
- Mannington
- Pleasant Valley
Towns
Magisterial districts
- Middletown
- Palatine
- West Augusta
Unincorporated communities
- Baxter
- Basnettville
- Beverly Hills
- Big Run
- Boothsville
- Brink
- Bunner Ridge
- Catawba
- Colfax
- Flyblow
- Forksburg
- Four States
- Grays Flat
- Hebron
- Highland
- Hopewell
- Hutchinson
- Joetown
- Jordan
- Katy
- Kingmont
- Logansport
- Meadowdale
- Metz
- Montana
- Montana Mines
- Paw Paw
- Pettyjohn
- Pine Grove
- Pleasant View
- Shagtown
- Seven Pines
- Stringtown
- Viola
- Wahoo
- Watson
- Winfield
Notable people
- David Carpenter, baseball player
- Frank Kendall Everest, Jr., The Fastest Man Alive
- Michael Garrison, former president of West Virginia University.
- Frank Gatski, athlete in the Pro Football Hall of Fame
- Sam Huff, Pro Football Hall of Fame
- Johnnie Johnson, musician
- John Knowles, author
- Joe Manchin, the former governor of West Virginia and current senior United States Senator from West Virginia.
- Luella Mundel, professor and McCarthyism victim
- Francis H. Pierpont, father of West Virginia
- Mary Lou Retton, all-around gymnastics Olympic gold medal winner (1984 Olympic Games).
- Rich Rodriguez, former college football coach (West Virginia, Michigan, Arizona)
- Nick Saban, current University of Alabama head football coach
- Harrison C. Summers, WWII hero
- Natalie Tennant, Secretary of State of West Virginia and 2014 U.S. Senate candidate.
- Robert Tinnell, Director, Writer, Producer
- Hershel W. Williams, Medal of Honor recipient for the Battle of Iwo Jima
- Tom Wilson, creator of the comic strip Ziggy.
- Fielding H. Yost, Football Coach
See also
Footnotes
- Also spelled "Pawpaw" in early records.
References
- "State & County QuickFacts". United States Census Bureau. Archived from the original on June 7, 2011. Retrieved January 10, 2014.
- "Find a County". National Association of Counties. Retrieved June 7, 2011.
- Dunnington, George A. History and Progress of the County of Marion, West Virginia Fairmont, West Virginia: George A. Dunnington, Publisher, 1880; Chap. II: First Settlements
- "Archived copy". Archived from the original on June 21, 2012. Retrieved January 29, 2013.CS1 maint: archived copy as title (link)
- Dunnington, George (1880). History and Progress of the County of Marion, West Virginia. Fairmont, WV: George A. Dunnington. pp. 87–92.
- Otis K. Rice & Stephen W. Brown, West Virginia: A History, 2nd ed., University Press of Kentucky, Lexington (1993), p. 240.
- United States Census Bureau, U.S. Decennial Census, Tables of Minor Civil Divisions in West Virginia, 1870–2010.
- "2010 Census Gazetteer Files". United States Census Bureau. August 22, 2012. Retrieved July 30, 2015.
- "Population and Housing Unit Estimates". Retrieved May 21, 2019.
- "U.S. Decennial Census". United States Census Bureau. Retrieved January 10, 2014.
- "Historical Census Browser". University of Virginia Library. Retrieved January 10, 2014.
- "Population of Counties by Decennial Census: 1900 to 1990". United States Census Bureau. Retrieved January 10, 2014.
- "Census 2000 PHC-T-4. Ranking Tables for Counties: 1990 and 2000" (PDF). United States Census Bureau. Retrieved January 10, 2014.
- "U.S. Census website". United States Census Bureau. Retrieved May 14, 2011.
- "DP-1 Profile of General Population and Housing Characteristics: 2010 Demographic Profile Data". United States Census Bureau. Archived from the original on 2020-02-13. Retrieved 2016-04-03.
- "Population, Housing Units, Area, and Density: 2010 - County". United States Census Bureau. Archived from the original on 2020-02-13. Retrieved 2016-04-03.
- "DP02 SELECTED SOCIAL CHARACTERISTICS IN THE UNITED STATES – 2006-2010 American Community Survey 5-Year Estimates". United States Census Bureau. Archived from the original on 2020-02-13. Retrieved 2016-04-03.
- "DP03 SELECTED ECONOMIC CHARACTERISTICS – 2006-2010 American Community Survey 5-Year Estimates". United States Census Bureau. Archived from the original on 2020-02-13. Retrieved 2016-04-03.
- Leip, David. "Dave Leip's Atlas of U.S. Presidential Elections". uselectionatlas.org. Retrieved 2018-03-27.
External links
Places adjacent to Marion County, West Virginia | ||||||||||
|---|---|---|---|---|---|---|---|---|---|---|
| ||||||||||
Municipalities and communities of Marion County, West Virginia, United States | ||
|---|---|---|
| Cities | Marion County map | |
| Towns | ||
| CDPs | ||
| Unincorporated communities |
| |
| Fictional places | ||
| Footnotes | ‡This populated place also has portions in an adjacent county or counties | |
| Authority control |
|
|---|