Ottawa South (provincial electoral district)
Ottawa South (French: Ottawa-Sud) is a provincial electoral district (riding) in the Canadian province of Ontario, in the city of Ottawa.
 Ottawa South in relation to other Ottawa electoral districts | |||
| Provincial electoral district | |||
| Legislature | Legislative Assembly of Ontario | ||
| MPP |
Liberal | ||
| District created | 1925 | ||
| First contested | 1926 | ||
| Last contested | 2018 | ||
| Demographics | |||
| Population (2011) | 121,921 | ||
| Electors (2013) | 86,346 | ||
| Area (km²) | 76 | ||
| Pop. density (per km²) | 1,604.2 | ||
| Census divisions | Ottawa | ||
| Census subdivisions | Ottawa | ||
History
The district was created in 1925 from part of Ottawa West. Prior to the 1999 election, the provincial district did not have the same borders as the federal district.
Prior to the 1967 redistribution, the riding shared no common area with the present riding. Present day Ottawa South could be found in the riding of Russell prior to 1967.
After having been firmly conservative for the first 60 years, it has been in the hands of the Liberals without interruption since 1987. From 1987 to 2013, it was held by two generations of the McGuinty family–father Dalton Sr. from 1987 to 1990 and son Dalton Jr. from 1990 to 2013.
Members of Provincial Parliament
| Ottawa South | ||||
|---|---|---|---|---|
| Assembly | Years | Member | Party | |
| Riding created from Ottawa West | ||||
| 17th | 1926–1929 | Thomas Birkett | Progressive Conservative | |
| 18th | 1929–1934 | Arthur Ellis | ||
| 19th | 1934–1937 | |||
| 20th | 1937–1943 | George Dunbar | ||
| 21st | 1943–1945 | |||
| 22nd | 1945–1948 | |||
| 23rd | 1948–1951 | |||
| 24th | 1951–1955 | |||
| 25th | 1955–1959 | |||
| 26th | 1959–1963 | Irwin Haskett | ||
| 27th | 1963–1967 | |||
| 28th | 1967–1971 | |||
| 29th | 1971–1975 | Claude Bennett | ||
| 30th | 1975–1977 | |||
| 31st | 1977–1981 | |||
| 32nd | 1981–1985 | |||
| 33rd | 1985–1987 | |||
| 34th | 1987–1990 | Dalton McGuinty, Sr. | Liberal | |
| 35th | 1990–1995 | Dalton McGuinty | ||
| 36th | 1995–1999 | |||
| 37th | 1999–2003 | |||
| 38th | 2003–2007 | |||
| 39th | 2007–2011 | |||
| 40th | 2011–2013 | |||
| 2013–2014 | John Fraser | |||
| 41st | 2014–2018 | |||
| 42nd | 2018–Present | |||
Election results
2018 general election
| 2018 Ontario general election | ||||||||
|---|---|---|---|---|---|---|---|---|
| Party | Candidate | Votes | % | ±% | ||||
| Liberal | John Fraser | 20,773 | 39.63 | −10.40 | ||||
| Progressive Conservative | Karin Howard | 15,319 | 29.23 | -2.63 | ||||
| New Democratic | Eleanor Fast | 14,250 | 27.19 | +14.82 | ||||
| Green | Les Schram | 1,618 | 3.09 | −1.26 | ||||
| Libertarian | Robert Daigneault | 342 | 0.65 | +0.07 | ||||
| Communist | Larry Wasslen | 114 | 0.22 | −0.08 | ||||
| Total valid votes | 52,616 | 100.0 | ||||||
| Liberal hold | Swing | |||||||
| Source: Elections Ontario[1] | ||||||||
2014 general election
| 2014 Ontario general election | ||||||||
|---|---|---|---|---|---|---|---|---|
| Party | Candidate | Votes | % | ±% | ||||
| Liberal | John Fraser | 23,708 | 49.96 | +7.70 | ||||
| Progressive Conservative | Matt Young | 15,235 | 32.11 | −6.84 | ||||
| New Democratic | Bronwyn Funiciello | 5,817 | 12.26 | −1.93 | ||||
| Green | Matt Lakatos-Hayward | 2,034 | 4.29 | +1.23 | ||||
| Libertarian | Jean-Serge Brisson | 273 | 0.58 | −0.01 | ||||
| Special Needs | John Redins | 244 | 0.51 | +0.22 | ||||
| Communist | Espoir Manirambona | 139 | 0.29 | |||||
| Total valid votes | 47,450 | 100.0 | ||||||
| Total rejected, unmarked and declined ballots | 432 | 0.91 | ||||||
| Turnout | 47,882 | 53.71 | ||||||
| Eligible voters | 89,150 | |||||||
| Liberal hold | Swing | +7.27 | ||||||
Source(s)
"General Election Results by District, 064 Ottawa South". Elections Ontario. 2014. Retrieved 17 June 2014. | ||||||||
2013 by-election
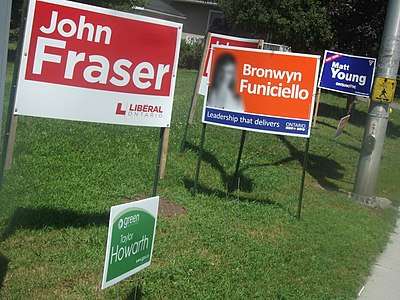
Dalton McGuinty resigned the Premiership of Ontario in February 2013, but decided to stay on as MPP of Ottawa South until the next election. McGuinty changed his mind however, and resigned on June 12 amid the "gas plant scandal".
Opinion polls
| Polling Firm | Date of Polling | Link | Liberal | PC | NDP | Green | Other | Type of poll | Margin of error |
|---|---|---|---|---|---|---|---|---|---|
| Forum Research | July 31 | 36 | 52 | 9 | 3 | 0 | IVR | 4% | |
| Campaign Research | July 30 | 35 | 42 | 12 | 6 | 5 | IVR | 4.5% | |
| Forum Research | July 24 | HTML | 34 | 48 | 12 | 5 | 1 | IVR | 4% |
| Campaign Research | July 15 | 37 | 38 | 17 | 5 | 2 | IVR | 5.1% | |
| Forum Research | July 3 | HTML | 42 | 38 | 17 | 4 | 3 | IVR | 5% |
| Forum Research | June 13 | HTML | 34 | 37 | 22 | 4 | 2 | IVR | 4% |
Results
| Ontario provincial by-election, August 1, 2013 Resignation of Dalton McGuinty | ||||||||
|---|---|---|---|---|---|---|---|---|
| Party | Candidate | Votes | % | ±% | Expenditures | |||
| Liberal | John Fraser | 14,921 | 42.33 | −6.53 | $ 95,351.00 | |||
| Progressive Conservative | Matt Young | 13,642 | 38.70 | +5.27 | 89,316.00 | |||
| New Democratic | Bronwyn Funiciello | 5,042 | 14.30 | +0.91 | 40,274.11 | |||
| Green | Taylor Howarth | 1,099 | 3.12 | −0.11 | 2,212.50 | |||
| Libertarian | Jean-Serge Brisson | 208 | 0.59 | +0.03 | 0.00 | |||
| Special Needs | John Redins | 102 | 0.29 | −0.24 | 0.00 | |||
| Independent | Daniel Post | 91 | 0.26 | 0.00 | ||||
| Freedom | Dave McGruer | 85 | 0.24 | 0.00 | ||||
| Pauper | John Turmel | 58 | 0.16 | 0.00 | ||||
| Total valid votes / Expense limit | 35,248 | 100.00 | −21.16 | $ 104,501.00 | ||||
| Total rejected, unmarked and declined ballots | 216 | 0.61 | +0.12 | |||||
| Turnout | 35,464 | 40.38 | −10.81 | |||||
| Eligible voters | 87,816 | +0.06 | ||||||
| Liberal hold | Swing | −5.90 | ||||||
Source(s)
"Summary of Valid Votes Cast for Each Candidate - August 1, 2013 By-Elections" (PDF). "Statistical Summary – 2013 By-Election" ( "2013 Ottawa South By-Election – Candidate Campaign Returns (CR-1)". Retrieved May 30, 2014. | ||||||||
Elections 1926-2011
| 2011 Ontario general election | ||||||||
|---|---|---|---|---|---|---|---|---|
| Party | Candidate | Votes | % | ±% | Expenditures | |||
| Liberal | Dalton McGuinty | 21,842 | 48.86 | −1.28 | $ 74,137.81 | |||
| Progressive Conservative | Jason MacDonald | 14,945 | 33.43 | +3.77 | 48,914.10 | |||
| New Democratic | Wali Farah | 5,988 | 13.39 | +4.07 | 15,509.77 | |||
| Green | James Mihaychuk | 1,442 | 3.23 | −4.92 | 3,566.26 | |||
| Libertarian | Jean-Serge Brisson | 252 | 0.56 | −0.24 | 0.00 | |||
| Special Needs | John Redins | 238 | 0.53 | 0.00 | ||||
| Total valid votes | 44,707 | 100.00 | −6.67 | $ 104,477.24 | ||||
| Total rejected, unmarked and declined ballots | 222 | 0.49 | −0.29 | |||||
| Turnout | 44,929 | 51.19 | −5.41 | |||||
| Eligible voters | 87,766 | +2.88 | ||||||
| Liberal hold | Swing | −2.52 | ||||||
Source(s)
"Summary of Valid Votes Cast for Each Candidate - October 6, 2011 General Election" (PDF). "Statistical Summary – General Elections 2011" ( "2011 Candidate Campaign Returns (CR-1)". Retrieved May 30, 2014. | ||||||||
| 2007 Ontario general election | ||||||||
|---|---|---|---|---|---|---|---|---|
| Party | Candidate | Votes | % | ±% | Expenditures | |||
| Liberal | Dalton McGuinty | 24,015 | 50.13 | −1.30ᴿ | $ 68,501.89 | |||
| Progressive Conservative | Richard Raymond | 14,206 | 29.66 | −4.24ᴿ | 80,475.86 | |||
| New Democratic | Edelweiss D'Andrea | 4,467 | 9.33 | +0.26ᴿ | 19,220.39 | |||
| Green | John Ford | 3,902 | 8.15 | +4.49 | 2,069.63 | |||
| Family Coalition | David MacDonald | 927 | 1.94 | +0.76 | 2,294.17 | |||
| Libertarian | Jean-Serge Brisson | 384 | 0.80 | 118.38 | ||||
| Total valid votes/Expense limit | 47,901 | 100.0 | +1.28 | $ 92,129.40 | ||||
| Total rejected ballots | 380 | 0.79 | +0.17 | |||||
| Turnout | 48,281 | 56.60 | −2.17 | |||||
| Eligible voters | 85,305 | +4.52 | ||||||
| Liberal hold | Swing | 1.47ᴿ | ||||||
| ᴿ Change based in redistributed results. | ||||||||
Source(s) | ||||||||
| 2003 Ontario general election | ||||||||
|---|---|---|---|---|---|---|---|---|
| Party | Candidate | Votes | % | ±% | Expenditures | |||
| Liberal | Dalton McGuinty | 24,647 | 51.70 | +2.11 | $ 70,963.18 | |||
| Progressive Conservative | Richard Raymond | 16,413 | 34.43 | −7.80 | 75,453.48 | |||
| New Democratic | James McLaren | 4,306 | 9.03 | +3.23 | 12,014.97 | |||
| Green | David Chernushenko | 1,741 | 3.65 | +2.07 | 2,884.13 | |||
| Family Coalition | John Pacheco | 562 | 1.18 | 9,388.75 | ||||
| Total valid votes/Expense limit | 47,669 | 100.0 | +4.11 | $ 78,349.44 | ||||
| Total rejected ballots | 296 | 0.62 | −0.16 | |||||
| Turnout | 47,965 | 58.77 | +1.03 | |||||
| Eligible voters | 81,614 | +2.12 | ||||||
| Liberal hold | Swing | +4.96 | ||||||
| 1999 Ontario general election | ||||||||
|---|---|---|---|---|---|---|---|---|
| Party | Candidate | Votes | % | ±% | Expenditures | |||
| Liberal | Dalton McGuinty | 22,707 | 49.59 | −3.76 | $ 62,090.51 | |||
| Progressive Conservative | Mike Nicholson | 19,337 | 42.23 | +12.41 | 20,397.04 | |||
| New Democratic | James McLaren | 2,655 | 5.80 | −8.86 | 14,683.16 | |||
| Green | George Brown | 724 | 1.58 | +0.26 | 0.00 | |||
| Independent | Meg Carson | 243 | 0.53 | 8.09 | ||||
| Natural Law | James Hea | 121 | 0.26 | −0.58 | 0.00 | |||
| Total valid votes/Expense limit | 45,787 | 100.0 | +58.44 | $ 76,725.12 | ||||
| Total rejected ballots | 360 | 0.78 | −0.01 | |||||
| Turnout | 46,147 | 57.74 | −8.77 | |||||
| Eligible voters | 79,922 | +82.50 | ||||||
| Liberal hold | Swing | −8.09 | ||||||
| Note: Boundaries significantly adjusted. Percentage change not adjusted to reflected redistribution. | ||||||||
| 1995 Ontario general election | ||||||||
|---|---|---|---|---|---|---|---|---|
| Party | Candidate | Votes | % | ±% | Expenditures | |||
| Liberal | Dalton McGuinty | 15,418 | 53.35 | +7.48 | $ 38,581.00 | |||
| Progressive Conservative | Linda Thom | 8,618 | 29.82 | +5.31 | 28,456.94 | |||
| New Democratic | Margaret Armstrong | 4,235 | 14.65 | −11.27 | 16,082.17 | |||
| Green | Karen Fyson | 383 | 1.33 | −0.70 | 0.00 | |||
| Natural Law | Wayne Foster | 245 | 0.85 | 0.00 | ||||
| Total valid votes/Expense limit | 28,899 | 100.0 | −4.26 | $ 44,698.00 | ||||
| Total rejected ballots | 229 | 0.79 | ||||||
| Turnout | 29,128 | 66.51 | ||||||
| Eligible voters | 43,793 | |||||||
Source(s)
"General Election of June 8 1995 – Summary of Valid Ballots by Candidate". Elections Ontario. Retrieved May 30, 2014. "General Election of June 8 1995 – Statistical Summary". Elections Ontario. Retrieved May 30, 2014. "Candidate and Association Combined Statement of Campaign Period Income and Expenses – 1995" ( | ||||||||
| 1990 Ontario general election | ||||||||
|---|---|---|---|---|---|---|---|---|
| Party | Candidate | Votes | % | ±% | ||||
| Liberal | Dalton McGuinty | 13,845 | 45.87 | −5.01 | ||||
| New Democratic | Margaret Armstrong | 7,826 | 25.93 | +6.67 | ||||
| Progressive Conservative | Darrel Kent | 7,399 | 24.51 | −5.36 | ||||
| Green | Stephen Johns | 612 | 2.03 | |||||
| Family Coalition | David Fitzpatrick | 503 | 1.67 | |||||
| Total valid votes | 30,185 | 100.0 | −3.73 | |||||
| 1987 Ontario general election | ||||||||
|---|---|---|---|---|---|---|---|---|
| Party | Candidate | Votes | % | ±% | ||||
| Liberal | Dalton McGuinty, Sr. | 15,952 | 50.88 | +15.53 | ||||
| Progressive Conservative | Michael McSweeney | 9,365 | 29.87 | −9.54 | ||||
| New Democratic | Penina Coopersmith | 6,038 | 19.26 | −5.99 | ||||
| Total valid votes | 31,355 | 100.0 | −4.74 | |||||
| 1985 Ontario general election | ||||||||
|---|---|---|---|---|---|---|---|---|
| Party | Candidate | Votes | % | ±% | ||||
| Progressive Conservative | Claude Bennett | 12,971 | 39.41 | −10.56 | ||||
| Liberal | Andrew Caddell | 11,634 | 35.34 | +6.34 | ||||
| New Democratic | John Smart | 8,311 | 25.25 | +5.07 | ||||
| Total valid votes | 32,916 | 100.0 | +8.08 | |||||
| 1981 Ontario general election | ||||||||
|---|---|---|---|---|---|---|---|---|
| Party | Candidate | Votes | % | ±% | ||||
| Progressive Conservative | Claude Bennett | 15,218 | 49.97 | +0.60 | ||||
| Liberal | Robert Dyck | 8,832 | 29.00 | +3.05 | ||||
| New Democratic | Chris Chilton | 6,146 | 20.18 | −2.80 | ||||
| Independent | Ray Turmel | 259 | 0.85 | |||||
| Total valid votes | 30,455 | 100.0 | −9.76 | |||||
| 1977 Ontario general election | ||||||||
|---|---|---|---|---|---|---|---|---|
| Party | Candidate | Votes | % | ±% | ||||
| Progressive Conservative | Claude Bennett | 16,662 | 49.37 | +6.22 | ||||
| New Democratic | Eileen Scotton | 8,759 | 25.95 | −6.48 | ||||
| Liberal | Patricia Thorpe | 7,754 | 22.98 | −1.45 | ||||
| Independent | Michael Holton | 574 | 1.70 | |||||
| Total valid votes | 33,749 | 100.0 | −1.39 | |||||

| 1975 Ontario general election | ||||||||
|---|---|---|---|---|---|---|---|---|
| Party | Candidate | Votes | % | ±% | ||||
| Progressive Conservative | Claude Bennett | 14,767 | 43.15 | −8.52 | ||||
| New Democratic | Eileen Scotton | 11,099 | 32.43 | +7.88 | ||||
| Liberal | Patricia Thorpe | 8,360 | 24.43 | +0.64 | ||||
| Total valid votes | 34,226 | 100.0 | −21.02 | |||||
| 1971 Ontario general election | ||||||||
|---|---|---|---|---|---|---|---|---|
| Party | Candidate | Votes | % | ±% | ||||
| Progressive Conservative | Claude Bennett | 22,392 | 51.67 | +4.16 | ||||
| New Democratic | Don Francis | 10,638 | 24.55 | +15.62 | ||||
| Liberal | Ian Kimmerly | 10,307 | 23.78 | −19.78 | ||||
| Total valid votes | 43,337 | 100.0 | +52.84 | |||||
| 1967 Ontario general election | ||||||||
|---|---|---|---|---|---|---|---|---|
| Party | Candidate | Votes | % | ±% | ||||
| Progressive Conservative | Irwin Haskett | 13,472 | 47.51 | −6.99 | ||||
| Liberal | Joseph McDonald | 12,351 | 43.56 | +3.40 | ||||
| New Democratic | William Hardy | 2,531 | 8.93 | +3.59 | ||||
| Total valid votes | 28,354 | 100.0 | +21.95 | |||||
1954-1966: Ward 5 (Old Ottawa South, the Glebe) and that part of Wards 4 (Centretown) and 6 (Dalhousie Ward) south of Sparks Street and Wellington Street (West).
| 1963 Ontario general election | ||||||||
|---|---|---|---|---|---|---|---|---|
| Party | Candidate | Votes | % | ±% | ||||
| Progressive Conservative | Irwin Haskett | 12,671 | 54.50 | +2.84 | ||||
| Liberal | Joseph McDonald | 9,338 | 40.16 | −4.06 | ||||
| New Democratic | Peter Hopwood | 1,241 | 5.34 | +1.22 | ||||
| Total valid votes | 23,250 | 100.0 | −7.54 | |||||
| 1959 Ontario general election | ||||||||
|---|---|---|---|---|---|---|---|---|
| Party | Candidate | Votes | % | ±% | ||||
| Progressive Conservative | Irwin Haskett | 12,989 | 51.66 | −2.28 | ||||
| Liberal | Archibald M. Laidlaw | 11,119 | 44.22 | +2.35 | ||||
| Co-operative Commonwealth | John Fisher | 1,037 | 4.12 | +0.97 | ||||
| Total valid votes | 25,145 | 100.0 | −4.15 | |||||
| 1955 Ontario general election | ||||||||
|---|---|---|---|---|---|---|---|---|
| Party | Candidate | Votes | % | ±% | ||||
| Progressive Conservative | George H. Dunbar | 14,151 | 53.94 | −2.04 | ||||
| Liberal | Kenneth Fogarty | 10,984 | 41.87 | +6.88 | ||||
| Co-operative Commonwealth | Allen Schroeder | 826 | 3.15 | −5.88 | ||||
| Labor–Progressive | Daniel Nerenberg | 273 | 1.04 | |||||
| Total valid votes | 26,234 | 100.0 | −26.23 | |||||
1933-1954: Capital Ward, Dalhousie Ward, Central Ward, Wellington Ward, that part of Riverdale Ward west of Main Street and that part of Elmdale Ward east of Parkdale Avenue.
| 1951 Ontario general election | ||||||||
|---|---|---|---|---|---|---|---|---|
| Party | Candidate | Votes | % | ±% | ||||
| Progressive Conservative | George H. Dunbar | 19,908 | 55.98 | +0.85 | ||||
| Liberal | Kenneth Fogarty | 12,444 | 34.99 | +6.45 | ||||
| Co-operative Commonwealth | Melville Fleming | 3,212 | 9.03 | −5.95 | ||||
| Total valid votes | 35,564 | 100.0 | +3.43 | |||||
| 1948 Ontario general election | ||||||||
|---|---|---|---|---|---|---|---|---|
| Party | Candidate | Votes | % | ±% | ||||
| Progressive Conservative | George H. Dunbar | 18,955 | 55.13 | −5.79 | ||||
| Liberal | William R. Burnett | 9,813 | 28.54 | +3.23 | ||||
| Co-operative Commonwealth | Milton C. Anderson | 5,151 | 14.98 | +1.69 | ||||
| Union of Electors | Terrence O'Reilly | 279 | 0.81 | |||||
| Socialist Labour | William Leckie | 185 | 0.54 | +0.06 | ||||
| Total valid votes | 34,383 | 100.0 | −11.30 | |||||
| 1945 Ontario general election | ||||||||
|---|---|---|---|---|---|---|---|---|
| Party | Candidate | Votes | % | ±% | ||||
| Progressive Conservative | George H. Dunbar | 23,616 | 60.92 | +16.87 | ||||
| Liberal | George Pushman | 9,813 | 25.31 | −9.24 | ||||
| Co-operative Commonwealth | Eugene Forsey | 5,151 | 13.29 | −7.42 | ||||
| Socialist Labour | E. Irving | 185 | 0.48 | −0.21 | ||||
| Total valid votes | 38,765 | 100.0 | +43.87 | |||||
| 1943 Ontario general election | ||||||||
|---|---|---|---|---|---|---|---|---|
| Party | Candidate | Votes | % | ±% | ||||
| Progressive Conservative | George H. Dunbar | 11,870 | 44.05 | −6.15 | ||||
| Liberal | Leonard L. Coulter | 9,311 | 34.56 | −13.08 | ||||
| Co-operative Commonwealth | Walter B. Mann | 5,579 | 20.71 | |||||
| Socialist Labour | Edward A. Irving | 185 | 0.69 | −0.11 | ||||
| Total valid votes | 26,945 | 100.0 | −22.45 | |||||
| 1937 Ontario general election | ||||||||
|---|---|---|---|---|---|---|---|---|
| Party | Candidate | Votes | % | ±% | ||||
| Conservative | George H. Dunbar | 17,443 | 50.20 | +2.64 | ||||
| Liberal | John H. Putnam | 16,550 | 47.63 | +0.76 | ||||
| Communist | Harry Binder | 408 | 1.17 | +0.64 | ||||
| Socialist Labour | Peter Leckie | 276 | 0.79 | |||||
| Independent | James C. Sidey | 69 | 0.20 | |||||
| Total valid votes | 34,746 | 100.0 | −2.69 | |||||
| 1934 Ontario general election | ||||||||
|---|---|---|---|---|---|---|---|---|
| Party | Candidate | Votes | % | |||||
| Conservative | Arthur Ellis | 16,983 | 47.56 | |||||
| Liberal | Percy O. Wilson | 16,737 | 46.87 | |||||
| Co-operative Commonwealth | William Henry Chapman | 1,531 | 4.29 | |||||
| Communist | John Lyons | 192 | 0.54 | |||||
| Independent | Joseph B. O'Reilly | 165 | 0.46 | |||||
| Independent | Duncan McNaughton | 100 | 0.28 | |||||
| Total valid votes | 35,708 | 100.0 | ||||||
1925-1933: Dalhousie Ward and Capital Ward
| 1929 Ontario general election | ||||||||
|---|---|---|---|---|---|---|---|---|
| Party | Candidate | Votes | % | |||||
| Conservative | Arthur Ellis | Acclaimed | ||||||
| 1926 Ontario general election | ||||||||
|---|---|---|---|---|---|---|---|---|
| Party | Candidate | Votes | % | |||||
| Conservative | Thomas Miles Birkett | 9,171 | 62.27 | |||||
| Liberal | Robert R. Sparks | 5,556 | 37.73 | |||||
| Total valid votes | 14,727 | 100.0 | ||||||
2007 electoral reform referendum
| 2007 Ontario electoral reform referendum | |||
|---|---|---|---|
| Side | Votes | % | |
| First Past the Post | 30,718 | 65.84 | |
| Mixed Member Proportional | 15,941 | 34.16 | |
| Total valid votes | 46,659 | 100.0 | |
Source | |||
Riding associations
Riding associations are the local branches of the provincial political parties:
| Party | Association Name | CEO | HQ Address | Neighbourhood | |
| Green | Green Party of Ontario Ottawa South | Unknown | Unknown | Unknown | |
| Progressive Conservative Party of Ontario | Ottawa South Progressive Conservative Association | Alan Wilde | 10 The Masters Drive, Ottawa, ON. | Uplands | |
| Liberal Party of Ontario | Ottawa South Provincial Liberal Association | John Fraser | Unknown | Unknown | |
| Ontario New Democratic Party | Ontario New Democrat Party Ottawa South | Unknown | Unknown | Unknown | |
Sources
References
- "Summary of Valid Votes Cast for each Candidate" (PDF). Elections Ontario. p. 8. Retrieved 20 January 2019.