European emigration
European emigration can be defined as subsequent emigration waves from the European continent to other continents. The origins of the various European diasporas[26] can be traced to the people who left the European nation states or stateless ethnic communities on the European continent.[27]
| Total population | |
|---|---|
| 510,000,000 + 6.5% of the total world population (world population of 7.5 billion).[1] 900,000,000 + Counting mixed-race Latin Americans and other groups of partial European descent. | |
| Regions with significant populations | |
| 243,832,540[2] | |
| 91,000,000[3][4] | |
| 36,000,000[5] | |
| 27,386,890[6] | |
| 19,500,350[7][8] | |
| 18,500,000[9] | |
| 16,000,000 - 56,000,000[10][11][12][13] | |
| 13,094,085[14][15][16] | |
| 10,000,000 - 13,020,000[17][18] | |
| 4,586,838[19] | |
| 3,900,000[10] | |
| 3,101,095[20] | |
| 3,064,862[21] | |
| 2,969,391[22] | |
| 1,320,000[23] | |
| 2,000,000+[16] | |
| 1,400,000+[24] | |
| 1,300,000[25]:220 | |
| 1,200,000+[10] | |
| 1,000,000+[16] | |
| 300,000+[16] | |
| Languages | |
| Languages of Europe (mostly English, Spanish, Portuguese, minority of French, Dutch, German and Italian) | |
| Religion | |
(mostly Catholic and Protestant, some Orthodox) Irreligion · Other Religions | |
| Related ethnic groups | |
| Europeans | |
From 1815 to 1932, 60 million people left Europe (with many returning home), primarily to "areas of European settlement" in the Americas (especially to the United States, Canada, Brazil, Argentina and Uruguay[27]), Australia,[28] New Zealand and Siberia.[29] These populations also multiplied rapidly in their new habitat; much more so than the populations of Africa and Asia. As a result, on the eve of World War I, 38% of the world's total population was of European ancestry.[29]
More contemporary, European emigration can also refer to emigration from one European country to another, especially in the context of the internal mobility in the European Union (intra-EU mobility) or mobility within the Eurasian Union.
From 1500 to the mid-20th century, 60-65 million people left Europe, of which less than 5% went to tropical areas (the Caribbean, Asia, Maghreb and Sub-Saharan Africa).[30]
History
8th - early 5th century BC: Greeks
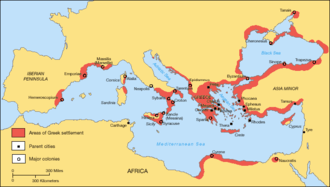
In Archaic Greece, trading and colonizing activities of the Greek tribes from the Balkans and Asia Minor propagated Greek culture, religion and language around the Mediterranean and Black Sea basins. Greek city-states were established in Southern Europe, northern Libya and the Black Sea coast, and the Greeks founded over 400 colonies in these areas.[31] Alexander the Great's conquest of the Achaemenid Empire marked the beginning of the Hellenistic period, which was characterized by a new wave of Greek colonization in Asia and Africa; the Greek ruling classes established their presence in Egypt, southwest Asia, and Northwest India.[32] Many Greeks migrated to the new Hellenistic cities founded in Alexander's wake, as geographically-dispersed as Uzbekistan[33] and Kuwait.[34]
1450-1800
Colonial settlers
The European continent has been a central part of a complex migration system, which included swaths of North Africa, the Middle East and Asia Minor well before the Modern Era. Yet, only the population growth of the late Middle Ages allowed for larger population movements, inside and outside of the continent.[35] The discovery of the Americas in 1492 stimulated a steady stream of voluntary migration from Europe. About 200,000 Spaniards settled in their American colonies prior to 1600, a small settlement compared to the 3 to 4 million Amerindians who lived in Spanish territory in the Americas.
Roughly one and a half million Europeans settled in the New World between 1500 and 1800 (see table). The Table excludes European immigrants to the Spanish Empire from 1650-1800 and to Brazil from 1700 to 1800. While the absolute number of European emigrants during the early modern period was very small compared to later waves of migration in the nineteenth and twentieth centuries, the relative size of these early modern migrations was nevertheless substantial.
During the 1500s, Spain and Portugal sent a steady flow of government and church officials, members of the lesser nobility, people from the working classes and their families averaging roughly three-thousand people per year from a population of around eight million. A total of around 437,000 left Spain in the 150-year period from 1500 to 1650 to Central, South America and the Caribbean Islands. It has been estimated that over 1.86 million Spaniards emigrated to Latin America in the period between 1492 and 1824, one million in the 18th century, with millions more continuing to immigrate following independence.[36]
Between 1500 and 1700 only 100,000 Portuguese crossed the Atlantic to settle in Brazil. However, with the discovery of numerous highly productive gold mines in the Minas Gerais region, the Portuguese emigration to Brazil increased by fivefold. From 1500, when the Portuguese reached Brazil, until its independence in 1822, from 500,000 to 700,000 Portuguese settled in Brazil, 600,000 of whom arrived in the 18th century alone.[37] From 1700 til 1760 over half a million Portuguese immigrants entered Brazil. In the 18th century, thanks to the gold rush, the capital of the province of Minas Gerais, the town of Villa Rica (today, Ouro Preto) became for a time one of the most populous cities in the New World. This massive influx of Portuguese immigration and influence created a city which remains to this day, one of the best examples of 18th century European architecture in the Americas.[27] However, the development of the mining economy in the 18th century raised wages and employment opportunities in the Portuguese colony and emigration increased: in the 18th century alone, about 600,000 Portuguese settled in Brazil, a mass emigration given that Portugal had a population of only 2 million people.[38]
Between one-half and two-thirds of European immigrants to the Thirteen Colonies between the 1630s and the American Revolution came under indentures.[39] The practice was sufficiently common that the Habeas Corpus Act 1679, in part, prevented imprisonments overseas; it also made provisions for those with existing transportation contracts and those "praying to be transported" in lieu of remaining in prison upon conviction.[40] In any case, while half the European immigrants to the Thirteen Colonies had been indentured servants, at any one time they were outnumbered by workers who had never been indentured, or whose indenture had expired. Free wage labour was more common for Europeans in the colonies.[41] Indentured persons were numerically important mostly in the region from Virginia north to New Jersey. Other colonies saw far fewer of them. The total number of European immigrants to all 13 colonies before 1775 was about 500,000-550,000; of these 55,000 were involuntary prisoners. Of the 450,000 or so European arrivals who came voluntarily, Tomlins estimates that 48% were indentured.[42] About 75% were under the age of 25. The age of legal adulthood for men was 24 years; those over 24 generally came on contracts lasting about 3 years.[43] Regarding the children who came, Gary Nash reports that, "many of the servants were actually nephews, nieces, cousins and children of friends of emigrating Englishmen, who paid their passage in return for their labour once in America."[44] Figures for immigration the Spanish Empire 1650-1800 and Brazil 1700-1800 are not given in the Table.
| Number of European Emigrants 1500-1783 | |||
|---|---|---|---|
| Country of Origin | Number | Period | |
| Spain | 437,000 | 1500-1650 | |
| Portugal | 100,000 | 1500-1700 | |
| Great Britain | 400,000 | 1607-1700 | |
| Great Britain (Totals) | 322,000 | 1700-1780 | |
| Scotland, Ireland | 190,000-250,000 | ||
| France | 51,000 | 1608-1760 | |
| Germany (Southwestern, Totals) | 100,000 | 1683-1783 | |
| Switzerland, Alsace Lorraine | |||
| Totals | 1,410,000 | 1500-1783 | |
Source:[27] | |||
In North America, immigration was dominated by British, Irish, French and other Northern Europeans.[45] From 1650 to 1800, almost 800,000 Spaniards emigrated to the New World, especially under the Bourbon Dynasty in the 18th century. Emigration to New France laid the origins of modern Canada, with important early immigration of colonists from Northern France.[38]
Post-independence emigration
Mass European emigration to the Americas, South Africa, Australia and New Zealand took place in the 19th and 20th centuries. This was the effect of a dramatic demographic transition in 19th-century-Europe, subsequent wars and political changes on the continent. From the end of the Napoleonic Wars until 1920, some 60 million Europeans emigrated. Of these, 71% went to North America, 21% to Latin America (mainly Argentina and Brazil) and 7% to Australia. About 11 million of these people went to Latin America, of whom 38% were Italians, 28% were Spaniards and 11% were Portuguese.[46]

Between 1821 and 1890, 9.55 million Europeans settled in the United States, mainly Germans, Irish, English, Scandinavians, Italians and Scots. 18 million more arrived from 1890 to 1914, including 2.5 million from Canada. Despite the large number of immigrants arriving, people born outside of the United States formed a relatively small number of the U.S. population: in 1910, foreigners accounted for 14.7 percent of the country's population or 13.5 million people. The huge number of immigrants to Argentina, which had a much smaller population, had a much greater impact on the country's ethnic composition. By 1914, 30% of Argentina's population was foreign-born, with 12% of its population born in Italy, the largest immigrant group. Next was Canada: by 1881, 14% of Canada's population was foreign-born, and the proportion increased to 22% in 1921.
In Brazil, the proportion of immigrants in the national population was much smaller, and immigrants tended to be concentrated in the central and Southern parts of the country. The proportion of foreigners in Brazil peaked in 1920, at just 7 percent or 2 million people, mostly Italians, Portuguese, Germans and Spaniards; however, the influx of 4 million European immigrants between 1880 and 1920 significantly altered the racial composition of the country.[45] From 1901 to 1920, immigration was responsible for only 7 percent of Brazilian population growth, but in the years of high immigration, from 1891 to 1900, the share was as high as 30 percent (higher than Argentina's 26 percent in the 1880s).[47]
The countries in the Americas that received a major wave of European immigrants from 1820s to the early 1930s were: the United States (32.5 million), Argentina (6.5 million), Canada (5.1 million), Brazil (4.4 million), Cuba (1.4 million), Uruguay (713,000).[48] Other countries that received a more modest immigration flow (accounting for less than 10 percent of total European emigration to Latin America) were: Mexico (270,000), Colombia (126,000), Chile (90,000), Puerto Rico (62,000), Peru (30,000), and Paraguay (21,000).[48][47]
Arrivals in the 19th and the 20th centuries
| European Emigrants 1800–1960 | |||
|---|---|---|---|
| Destination | Percent | ||
| United States | 70.0% | ||
| Latin America | 12.0% | ||
| Russian Siberia | 9.0% | ||
| Canada, Australia, New Zealand, South Africa | 9.0% | ||
| Total | 100.0% | ||
Source:[49] | |||
| Destination | Years | Arrivals | Ref(s) |
|---|---|---|---|
| United States | 1821–1932 | 32,244,000 | [50] |
| Argentina | 1856–1932 | 6,405,000 | [50] |
| Canada | 1831–1932 | 5,206,000 | [50] |
| Brazil | 1821–1932 | 4,431,000 | [50] |
| Australia | 1821–1932 | 2,913,000 | [50] |
| Cuba | 1901–1931 | 857,000 | [50] |
| South Africa | 1881–1932 | 852,000 | [50] |
| Chile | 1882–1932 | 726,000 | [50] |
| Uruguay | 1836–1932 | 713,000 | [50] |
| New Zealand | 1821–1932 | 594,000 | [50] |
| Mexico | 1911–1931 | 226,000 | [50] |
Legacy
Distribution
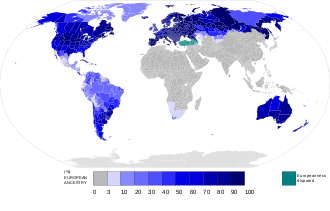
After the Age of Discovery, different ethnic European communities began to emigrate out of Europe with particular concentrations in Australia, New Zealand, the United States, Canada, Argentina, Uruguay, Cuba and Brazil where they came to constitute a European-descended majority population.[49][51][52] It is important to note, however, that these statistics rely on identification with a European ethnic group in censuses, and as such are subjective (especially in the case of mixed origins). Nations and regions outside of Europe with significant populations:[53]
North America
Total European population—approximately 300,000,000
Canada
In the first Canadian census in 1871, 98.5% chose a European origin with it slightly decreasing to 96.3% declared in 1971.[54][55] In the 2016 census, 19,683,320 or 53.0% self-identified with a European ethnic origin, the largest being of British Isles origins (11,211,850). Individually, they are English (6,320,085), French (4,680,820), Scottish (4,799,005), Irish (4,627,000), German (3,322,405), Italian (1,587,965).[56] However, there is an undercount with 11,135,965 choosing "Canadian".[56]
United States
At the time of the first U.S. census in 1790, 80.7% of the American people self-identified as white, where it remained above that level before declining at the 1990 census. However, numerically it increased from 3.17 million (1790) to 199.6 million exactly two hundred years later.[57] Today, European Americans are the largest panethnic group in the United States. The 2010 census data revealed that 72.4% of the population, or 223,800,000 people self-identified as white.[58]
Mexico

European Mexican - estimated by the government in 2010 as 47% of the population (56 million) using phenotypical traits (skin color) as the criteria.[12] If the criteria used is the presence of blond hair, it is 18%[59][60] - 23%.[61]
Caribbean and South America
In Argentina 79% of the population or 38,900,000 are estimated to be of European descent and may include an unknown percentage of mestizos and mulattos.[62] Other sources[63] put 86.4% of the population.
Falkland Islanders are mainly of European, especially British descent with a total population of 3,140.
Cubans of European origin reached a peak of 74.3% or 3,553,312 of the total population in 1943.[64][65] Most recently, those self-identified as white made up 64.1% of the total population, according to the 2012 census.[66][67] They are predominately the descendants of early Spanish settlers, along with other Europeans including the Germans, English, French and Italians arriving later but in smaller numbers. However, after the mass exodus (particularly to the United States) resulting from the Cuban Revolution in 1959, the number of white Cubans actually residing in Cuba diminished.
In Peru the official 2017 census, 5.9% or (1.3 mil) 1,336,931 people 12 years of age and above self-identified their ancestors as white or European descent.[25]:214 This was the first time a question on race or ancestors had been asked since the 1940 census.[68] There were 619,402 (5.5%) males and 747,528 (6.3%) females. The region with the highest proportion of Peruvians with self-identified European or white origins was in the La Libertad Region (10.5%) and Tumbes Region (9.0%).[25]:214 Most are descendants of early Spanish settlers with substantial numbers of Italians and Germans.[69]
Australia and New Zealand
Total population of Europeans in Oceania is approximately 23,185,000 or approximately 22,818,000 excluding Hawaii.
By 1947, Australia was overwhelmingly of British origin were 7,524,129 or 99.3% of the population declared their race as European.[70] As of 2016, the majority of Australians of European descent are of English 36.1%, Irish 11.0%, Scottish 9.3%, Italian 4.6%, German 4.5%, Greek 1.8% and Dutch 1.6%. A large proportion —33.5%— chose to identify as ‘Australian’, however the census Bureau has stated that most of these are of old Anglo-Celtic colonial stock.[71][72][73] As at the 2016 census, it was estimated that around 58% of the Australian population were Anglo-Celtic Australians with 18% being of other European origins, a total of 76% for European ancestries as a whole.[74]
Europeans historically (especially Anglo-Celtic) and presently are still the largest ethnic group in New Zealand. Their proportion of the total New Zealand population has been decreasing gradually since the 1916 census where they formed 95.1 percent.[75] The 2018 official census had over 3 million people or 71.76% of the population were ethnic Europeans, with 64.1% choosing the New Zealand European option alone.[76]
Africa
South Africans of European descent were 4,586,838 or 8.9% of South Africa's population in the 2011 census.[77] They are predominantly descendants of Dutch, German, French Huguenots, English and other European settlers.[78][79] Culturally and linguistically, they are divided into the Afrikaans-speaking descendants of South Africa's original Dutch colonial population, known as Afrikaners, and members of a larger British diaspora in Africa. The first national census in South Africa was held in 1911 and showed a percentage peak of 21.4% or 1,276,242.[80] The population increased to its peak at 5,044,000 in 1990.[81] However, the number of white South African residents in their home country began gradually declining between 1990 and the mid-2000s as a result of increased emigration.[81]
White Ghanaians are descendants of mostly British settlers and Irish people who were forced to immigrate to Ghana. Some of these people are descendants of Portuguese, Dutch, Swedish, Danish, Norwegian, German, Italian, and Polish settlers.
Canary Islanders are the descendants of Spaniards who settled the Canary Islands. The Canarian people include long-tenured and new waves of Spanish immigrants, including Andalucians, Galicians, Castilians, Catalans, Basques and Asturians of Spain; and Portuguese, Italians, Dutch or Flemings, and French people. As of 2019, 72.1% or 1,553,078 were native Canary islanders with a further 8.2% born in mainland Spain.[82] Many of European origins including those of Isleño (islander) lineage have also moved to the islands, such as those from Venezuela and Cuba. Presently there are 49,170 from Italy, 25,619 from Germany, United Kingdom (25,521) and others from Romania, France and Portugal.[83]
Smaller communities
Small communities of European, white American and white Australian expatriates in the Persian Gulf countries like Bahrain, Kuwait, Qatar and the UAE; and in Aramco compounds in Saudi Arabia. Historically before 1970, small ethnic European (esp. Greek and Italian) enclaves were found in Egypt (Greeks in Egypt, Italian Egyptians) and Syria (Greeks in Syria). And Israel has a small non-Jewish (often Evangelical Christian) American community in a primarily ethnoreligious Jewish country.
Populations of European descent
- Albanian diaspora
- Basque diaspora
- Bosnian diaspora
- British diaspora
- English diaspora
- Scottish diaspora
- Welsh diaspora
- Bulgarian diaspora
- Croatian diaspora
- Czech diaspora
- Dutch diaspora
- French diaspora
- German diaspora
- Greek diaspora
- Hungarian diaspora
- Icelandic diaspora
- Irish diaspora
- Italian diaspora
- Lithuanian diaspora
- Maltese diaspora
- Norwegian diaspora
- Polish diaspora
- Portuguese diaspora
- Romanian diaspora
- Russian diaspora
- Serbian diaspora
- Spanish diaspora
- Ukrainian diaspora
- Ruthenians or Rusyns
See also
References
- Current World Population 2017 worldometers
- "ACS Demographic and Housing Estimates". U.S. Census Bureau. December 2019. Retrieved 23 March 2020.
- Pena, Sérgio D. J.; Di Pietro, Giuliano; Fuchshuber-Moraes, Mateus; Genro, Julia Pasqualini; Hutz, Mara H.; Kehdy, Fernanda de Souza Gomes; Kohlrausch, Fabiana; Magno, Luiz Alexandre Viana; Montenegro, Raquel Carvalho; Moraes, Manoel Odorico; Moraes, Maria Elisabete Amaral de; Moraes, Milene Raiol de; Ojopi, Élida B.; Perini, Jamila A.; Racciopi, Clarice; Ribeiro-Dos-Santos, Ândrea Kely Campos; Rios-Santos, Fabrício; Romano-Silva, Marco A.; Sortica, Vinicius A.; Suarez-Kurtz, Guilherme (2011). "The Genomic Ancestry of Individuals from Different Geographical Regions of Brazil is More Uniform Than Expected". PLOS ONE. 6 (2): e17063. Bibcode:2011PLoSO...617063P. doi:10.1371/journal.pone.0017063. PMC 3040205.
- http://www.teses.usp.br/teses/disponiveis/41/41131/tde-17122010-142628/pt-br.php
- "South America : Argentina : People and society". The World Factbook. CIA. Retrieved 23 July 2015.
- "National Household Survey (NHS) Profile, 2011". 8 May 2013. Retrieved 17 June 2015.
- Bushnell, David (2010). Rex A. Hudson (ed.). Colombia: A Country Study. U.S. Government Printing Office. p. 87. ISBN 978-0-8444-9502-6.
- Schwartzman, Simon (27 January 2008). "Étnia, condiciones de vida y discriminación" [Ethnicity, living conditions and discrimination] (PDF). schwartzman.org (in Spanish). Retrieved 27 February 2017.
- https://www.humanrights.gov.au/sites/default/files/document/publication/Leading%20for%20Change_Blueprint2018_FINAL_Web.pdf
- Lizcano Fernández, Francisco (2005). "Composición Étnica de las Tres Áreas Culturales del Continente Americano al Comienzo del Siglo XXI" [Ethnic Composition of the Three Cultural Areas of the American Continent at the Beginning of the 21st Century] (PDF) (in Spanish). UAEM. p. 218. Archived from the original (PDF) on 20 September 2008.
- "Mexico: People; Ethnic groups". CIA World Factbook. Retrieved 26 November 2007.
- "21 de Marzo Día Internacional de la Eliminación de la Discriminación Racial" pag.7, CONAPRED, Mexico, 21 March. Retrieved on 28 April 2017.
- "Encuesta Nacional Sobre Discriminación en Mexico”, "CONAPRED", Mexico DF, June 2011. Retrieved on 28 April 2017.
- "Resultado Basico del XIV Censo Nacional de Población y Vivienda 2011" [Basic Results of the XIV National Population and Housing Census 2011] (PDF) (in Spanish). Caracas: National Institute of Statistics of the Bolivarian Republic of Venezuela. 9 August 2012. p. 14. Retrieved 1 March 2017.
- "Demográficos: Censos de Población y Vivienda: Población Proyectada al 2016 - Base Censo 2011" [Demographics: Population and Housing Censuses: Population Projected to 2016 - Census Base 2011] (in Spanish). National Institute of Statistics. Retrieved 1 March 2017: adaption of the 42.2% white people from the census with current estimates
- "Ethnic groups". The World Factbook. Central Intelligence Agency (CIA). Retrieved 14 September 2013.
- "Chile". Encyclopædia Britannica. Retrieved 15 September 2012.
Chile's ethnic makeup is largely a product of Spanish colonization. About three-fourths of Chileans are mestizo, a mixture of European and Amerindian ancestries. One fifth of Chileans are of white European (mainly Spanish) descent.
- Medina Lois, Ernesto; Ana María Kaempffer R. "Elementos de Salud Pública: 5.2.6. Estructura racial" [Elements of Public Health: 5.2.6. Racial structure] (PDF) (in Spanish). Universidad de Chile. Archived from the original on 3 June 2014. Retrieved 26 October 2009.
- "Census 2011 Census in brief, Report No. 03-01-41" (PDF). Statistics South Africa. 2012. Retrieved 21 January 2016.
- Cabella, Wanda; Mathías Nathan; Mariana Tenenbaum (December 2013). Juan José Calvo (ed.). Atlas sociodemográfico y de la desigualdad del Uruguay, Fascículo 2: La población afro-uruguaya en el Censo 2011: Ancestry [Atlas of socio-demographics and inequality in Uruguay, Part 2: The Afro-Uruguayan population in the 2011 Census] (PDF) (in Spanish). Uruguay National Institute of Statistics. ISBN 978-9974-32-625-5. Archived from the original (PDF) on 9 February 2014.
- 2010 Census Data. "2010 Census Data". 2010.census.gov. Archived from the original on 2 January 2011. Retrieved 30 October 2011.
- "Cultural diversity". 2013 Census QuickStats about national highlights. Statistics New Zealand. 3 December 2013. Retrieved 18 August 2017.
- INE- Caracterización estadística República de Guatemala 2012 Retrieved, 2015/04/17.
- Instituto Nacional de Estadística y Censo del Ecuador INEC.
- "Perú: Perfil Sociodemográfico" (PDF). Instituto Nacional de Estadística e Informática. Retrieved 16 March 2020.
- The use of the term "diaspora" in reference to people of European national or ethnic origins is contested and debated- Diaspora and transnationalism : concepts, theories and methods. Bauböck, Rainer., Faist, Thomas, 1959-. Amsterdam: Amsterdam University Press. 2010. ISBN 9789089642387. OCLC 657637171.CS1 maint: others (link)
- "To Make America": European Emigration in the Early Modern Period edited by Ida Altman, James P. P. Horn (Page: 3 onwards)
- De Lazzari, Chiara; Bruno Mascitelli (2016). "Migrant "Assimilation" in Australia: The Adult Migrant English Program from 1947 to 1971". In Bruno Mascitelli; Sonia Mycak; Gerardo Papalia (eds.). The European Diaspora in Australia: An Interdisciplinary Perspective. Cambridge Scholars Publishing. p. 203. ISBN 978-1-4438-9419-7. Retrieved 28 February 2017.
- "European Migration and Imperialism". historydoctor.net. Archived from the original on 22 November 2010. Retrieved 14 September 2013.
The population of Europe entered its third and decisive stage in the early eighteenth century. Birthrates declined, but death rates also declined as the standard of living and advances in medical science provided for longer life spans. The population of Europe including Russia more than doubled from 188 million in 1800 to 432 million in 1900. From 1815 through 1932, sixty million people left Europe, primarily to "areas of European settlement," in North and South America, Australia, New Zealand and Siberia. These populations also multiplied rapidly in their new habitat; much more so than the populations of Africa and Asia. As a result, on the eve of World War I (1914), 38 percent of the world's total population was of European ancestry. This growth in population provided further impetus for European expansion, and became the driving force behind emigration. Rising populations put pressure on land, and land hunger and led to "land hunger." Millions of people went abroad in search of work or economic opportunity. The Irish, who left for America during the great Potato famine, were an extreme but not unique example. Ultimately, one third of all European migrants came from the British Isles between 1840 and 1920. Italians also migrated in large numbers because of poor economic conditions in their home country. German migration also was steady until industrial conditions in Germany improved when the wave of migration slowed. Less than one half of all migrants went to the United States, although it absorbed the largest number of European migrants. Others went to Asiatic Russia, Canada, Argentina, Brazil, Australia and New Zealand.
- Pour une approche démographique de l'expansion coloniale de l'Europe Bouda Etemad Dans Annales de démographie historique 2007/1 (n° 113), pages 13 à 32
- Jerry H. Bentley, Herbert F. Ziegler, "Traditions and Encounters, 2/e," Chapter 10: "Mediterranean Society: The Greek Phase" Archived 2012-03-06 at the Wayback Machine (McGraw-Hill, 2003)
- Hellenistic Civilization Archived July 5, 2008, at the Wayback Machine
- "Menander became the ruler of a kingdom extending along the coast of western India, including the whole of Saurashtra and the harbour Barukaccha. His territory also included Mathura, the Punjab, Gandhara and the Kabul Valley", Bussagli p101
- John Pike. "Failaka Island". Globalsecurity.org. Retrieved 20 April 2016.
- Liberal states and the freedom of movement : selective borders, unequal mobility. Mau, Steffen, 1968-. Houndmills, Basingstoke, Hampshire: Palgrave Macmillan. 2012. ISBN 9780230277847. OCLC 768167292.CS1 maint: others (link)
- MacIas, Rosario Marquez; MacÍas, Rosario Márquez (1995). La emigración española a América, 1765-1824. ISBN 9788474688566.
- (Levy & Vasques 2014, p. 250)
- 1944-, Francis, R. D. (R. Douglas) (1988). Origins : Canadian history to Confederation. Jones, Richard, 1943-, Smith, Donald B. Toronto: Holt, Rinehart and Winston of Canada. ISBN 978-0039217051. OCLC 16577780.CS1 maint: numeric names: authors list (link)
- Galenson 1984: 1
- Charles II, 1679: An Act for the better secureing the Liberty of the Subject and for Prevention of Imprisonments beyond the Seas., Statutes of the Realm: Volume 5, 1628–80, pp 935–938. Great Britain Record Commission, (1819)
- John Donoghue, "Indentured Servitude in the 17th Century English Atlantic: A Brief Survey of the Literature," History Compass (2013) 11#10 pp 893–902.
- Christopher Tomlins, "Reconsidering Indentured Servitude: European Migration and the Early American Labor Force, 1600–1775," Labor History (2001) 42#1 pp 5–43, at p.
- Tomlins (2001) at notes 31, 42, 66
- Gary Nash, The Urban Crucible: The Northern Seaports and the Origins of the American Revolution (1979) p 15
- Boris Fautos – Fazer a América: a imigração em massa para a América Latina."
- Marília D. Klaumann Cánovas (2004). "A GRANDE IMIGRAÇÃO EUROPÉIA PARA O BRASIL E O IMIGRANTE ESPANHOL NO CENÁRIO DA CAFEICULTURA PAULISTA: ASPECTOS DE UMA (IN)VISIBILIDADE" [The great European immigration to Brazil and immigrants within the Spanish scenario of the Paulista coffee plantations: one of the issues (in) visibility] (PDF) (in Portuguese). cchla.ufpb.br. Archived from the original (PDF) on 3 October 2009.
- Blanca Sánchez-Alonso (2005). "European Immigration into Latin America, 1870-1930" (PDF). docentes.fe.unl.pt. Archived from the original (PDF) on 22 October 2008.
- Baily, Samuel L.; Míguez, Eduardo José, eds. (2003). Mass Migration to Modern Latin America. Wilmington, Delaware: Rowman & Littlefield. p. 14. ISBN 978-0-8420-2831-8. Retrieved 27 February 2017.
- World Civilizations: Volume II: Since 1500 By Philip J. Adler, Randall L. Pouwels
- Samuel L. Baily; Eduardo José Míguez (2003). Mass Migration to Modern Latin America. Rowman & Littlefield. p. xiv. ISBN 978-0-8420-2831-8. Retrieved 20 December 2015.
- Ember et al 2004, p. 47.
- Marshall 2001, p. 254.
- Ethnic groups by country. Statistics (where available) from CIA Factbook.
- Ethnic origins Census of Canada (Page: 17)
- Table 1: Population by Ethnic Origin, Canada, 1921-1971 Page: 2
- Census Profile, 2016 Census - Ethnic origin population
- "Official census statistics of the United States race and Hispanic origin population" (PDF). US Statistics Bureau. Archived from the original (PDF) on 25 February 2010.
- "Overview of Race and Hispanic Origin: 2010 Census Briefs" (PDF). US Census Bureau. March 2011. Archived from the original on 5 May 2011. Retrieved 15 March 2019.
- "Stratification by Skin Color in Contemporary Mexico", Jstor org, available creating a free account , Retrieved on 27 January 2018.
- "Admixture in Latin America: Geographic Structure, Phenotypic Diversity and Self-Perception of Ancestry Based on 7,342 Individuals" table 1, Plosgenetics, 25 September 2014. Retrieved on 9 May 2017.
- "Racismo y salud mental en estudiantes universitarios en la Ciudad de México", Scielo, Cuernavaca, April–March 2011. Retrieved on 28 April 2017.
- Argentina: People: Ethnic Groups. World Factbook of CIA
- Ben Cahoon. "Argentina". worldstatesmen.org. Retrieved 23 July 2015.
- Cifras censales comparadas, 1899 - 1953 | P.189
- Revolutionizing Romance: Interracial Couples in Contemporary Cuba - By Nadine T Fernandez
- "2012 Cuban Census". One.cu. 28 April 2006. Retrieved 23 April 2014.
- Grupo Copesa (8 November 2013). "Censo en Cuba concluye que la población decrece, envejece y se vuelve cada vez más mestiza". latercera.com.
- "El uso de categorías étnico/raciales en censos y encuestas en el Perú: balance y aportes para una discusión" (PDF) (in Spanish). Retrieved 16 March 2020.
- "El uso de categorías étnico/raciales en censos y encuestas en el Perú: balance y aportes para una discusión" (PDF) (in Spanish). Retrieved 16 March 2020.
- "Official Year Book of the Commonwealth of Australia No. 37 - 1946 and 1947". Retrieved 29 April 2020.
- Australian Bureau of Statistics has stated that most who list "Australian" as their ancestry are part of the "Anglo-Celtic" group. "Feature Article - Ethnic and Cultural Diversity in Australia (Feature Article)". January 1995. Archived from the original on 20 April 2016. Retrieved 2008-06-24.
- "THE ANCESTRIES OF AUSTRALIANS Census of Population and Housing: Reflecting Australia - Stories from the Census, 2016". abs.gov.au. Retrieved 29 April 2020.
- "Census of Population and Housing: Reflecting Australia - Ancestry 2016". abs.gov.au. Retrieved 29 April 2020.
- "Australian Human Rights commission 2018" (PDF). 2018. Retrieved 12 December 2019.
- "Historical and statistical survey (P. 18)". Retrieved 29 April 2020.
- "2018 Census totals by topic – national highlights". Stats NZ. 23 September 2019. Retrieved 12 December 2019.
- "Census 2011 Census in brief, Report No. 03-01-41" (PDF). Statistics South Africa. 2012. Retrieved 21 January 2016.
- Kristin Henrard (2002). Minority Protection in Post-Apartheid South Africa: Human Rights, Minority Rights, and Self-Determination. Greenwood Publishing Group. p. 43. ISBN 978-0-275-97353-7.
- James L. Gibson; Amanda Gouws (2005). Overcoming Intolerance in South Africa: Experiments in Democratic Persuasion. Cambridge University Press. p. 36. ISBN 978-0-521-67515-4.
- Kriger, Robert; Kriger, Ethel (1997). Afrikaans Literature: Recollection, Redefinition, Restitution. Amsterdam: Rodopi BV. pp. 75–78. ISBN 978-9042000513.
- "Population of South Africa by population group" (PDF). Dammam: South African Department of Agriculture, Forestry, and Fisheries. 2004. Archived from the original on 28 February 2005. Retrieved 20 September 2016.
- "Estadística del Padrón Continuo a 1 de enero de 2019. Datos a nivel nacional, comunidad autónoma y provincia". Retrieved 20 February 2020.
- Canarias gana en un año 24.905 habitantes, el 66% de otros países Canarias7.es. Retrieved 5 October 2019
- Hill, Fiona (23 February 2004). "Russia — Coming In From the Cold?". The Globalist. Archived from the original on 15 July 2011.