Energy in Vietnam
Vietnam is a dynamic developing economy, with a relatively high growth rate. The energy sector plays a key role in promoting the country's socio-economic development. Vietnam has a diverse energy fuel resource of various types such as coal, natural gas, petroleum, hydropower and renewable energy sources such as solar energy, biomass energy, wind energy, etc.
Total primary energy supply (domestic, import) by type
Table 1: Progress of primary energy supply between 2000‑2015 (KTOE) [1]
| 2000 | 2005 | 2010 | 2011 | 2012 | 2013 | 2014 | 2015 | |
|---|---|---|---|---|---|---|---|---|
| Coal | 4,372 | 8,376 | 14,730 | 15,605 | 15,617 | 17,239 | 19,957 | 24,608 |
| Oil | 7,917 | 12,270 | 17,321 | 16,052 | 15,202 | 14,698 | 17,700 | 19,540 |
| Gas | 1,441 | 4,908 | 8,316 | 7,560 | 8,253 | 8,522 | 9,124 | 9,551 |
| Hydro power | 1,250 | 1,413 | 2,369 | 3,519 | 4,540 | 4,468 | 5,146 | 4,827 |
| Non-commercial
energy |
14,191 | 14,794 | 13,890 | 14,005 | 14,121 | 13,673 | 12,745 | 11,925 |
| Electricity import | 33 | 399 | 333 | 125 | 200 | 124 | 136 | |
| Total | 29,171 | 41,794 | 57,025 | 57,075 | 57,857 | 58,801 | 64,797 | 70,588 |
Coal
Data of the Ministry of Industry and Trade (MOIT), 10 months of 2018 clean coal production was estimated at 34.35 million tons, up 10% over the same period in 2017, of which clean coal output of Vinacomin (TKV) was 29.6 million tons, up 10.9% over the same period last year.[2] By the end of 2018, TKV's coal production reached 36.95 million tons. In 2019, TKV aimed to produce 40 million tons while consumption was up to 42 million tons, exceeding 2 million tons compared to production.[3]
On 2019-04-09, the amount of raw coal produced by this group reached over 10.7 million tons (of which 10.5 million tons were exported). To meet the above figure, TKV had to import another 1.2 million tons of coal to mix, while reducing its inventory to 6.2 million tons of coal.[4]
Table 2: Vietnam's coal import volume from 2014 to 2017 (tons): [5]
| Year | 2014 | 2015 | 2016 | 2017 |
| Total volume of imported coal | 3,095,801 | 6,935,667 | 13,276,869 | 14,488,002 |
The total volume of coal imported into Vietnam from 2014–2017 reached nearly 38 million tons and has an increasing trend.[5] In 10 months of 2018, Vietnam imported 17.34 million tons of coal, worth US$2.05 billion. In terms of markets, Australia, Indonesia and China are the three largest coal supply markets for Vietnam.[6] According to the statistics of the General Department of Vietnam Customs, in 2018, Vietnam imported 23.78 million tons of coal.[7]
Table 3: Vietnam's coal balance in 2017 (million tons): [8]
| Enterprise | Estimate the beginning of the period | Exploit | Import | Export | Domestic Use | Estimate the end of the period |
|---|---|---|---|---|---|---|
| Total | 11,705 | 37,739 | 14,488 | 2,228 | 52,149 | 9,555 |
| TKV | 10,000 | 32,200 | 0,158 | 1,517 | 32,583 | 8,258 |
| Dong Bac | 0,500 | 5,100 | 0,513 | 0,021 | 6,000 | 0,092 |
| Vietmindo | 0,005 | 0,439 | 0 | 0,439 | 0 | 0,005 |
| Formosa | 0,300 | 0 | 4,006 | 0,173 | 3,833 | 0,300 |
| Hoa Phat | 0,100 | 0 | 1,177 | 0 | 1,177 | 0,100 |
| EVN | 0,500 | 0 | 3,217 | 0 | 3,217 | 0,500 |
| Others | 0,300 | 0 | 5,417 | 0,078 | 5,339 | 0,300 |
It is forecasted that in the future, domestic coal resources will not meet the demand for consumption in general, electricity production in particular and must be imported in huge quantities ... (2020: 86 million tons, 2025: 121 million tons and 2030: 156 million tons).[9] Mr. Sabyasachi Mishra, mineral sales manager at Tata International, predicts that Vietnam's annual coal imports will increase from 20 million tons to 30 million tons in the next one or several years, especially when domestic coal reserves are downward trend.[10]
Oil
According to the report of Petrovietnam (PVN), the total production of oil exploitation in 2017 reached 25.41 million tons, exceeding 1.60 million tons of oil equivalent compared to the Government plan assigned at the beginning of the year, but exploration increased reserves to only 4 million tons. In particular, oil exploitation reached 15.52 million tons, exceeding 1.32 million tons.[11]
In 2018, the oil production reached nearly 14 million tons (of which, the domestic oil production was about 11.3 million tons), down from the level of over 15.52 million tons in 2017.[12]
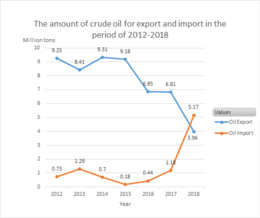
According to government statistics, in the period 2012–2017 crude oil exports were always more than imports, with an average export volume of 8.3 million tons/year, while imports averaged only about 750 thousand tons/year.
In 2018, the whole country exported 3.96 million tons of crude oil, down 41.8% from 2017 and less than half of the annual exports of crude oil in the period of 2012–2017. At the same time, imports reached 5.17 million tons, more than 4 times the figure of 1.18 million tons in 2017 and 7 times more than the annual import figure of the period 2012–2017.
In January and February 2019 the whole country imported more than 1.462 million tons of crude oil (worth US$635.4 million), an increase of more than 16 times in volume and 14 times in value from the same period in 2018.[13] The reason for the sharp increase is the oil demand for production by the Nghi Sơn Refinery.[14]
Oil production in many wells is declining naturally, due to exploitation for too long. In addition, the increase in reserves is so low that from 2018 to 2025, oil production will decrease steadily every year by 10% – equivalent to more than 2 million tons. Lack of capital is the main reason that PVN has not been able to boost oil and gas exploration activities in the past years to increase reserves. The increased output to compensate for the exploitation has reduced to a worrying level, affecting the sustainable development of Vietnam's oil and gas industry. Only a few years from 2018, the total oil and gas production will be only 1/3 of the current production.[15]
Natural gas
According to the 2018 report of the MOIT, production of natural gas has increased gradually from 2011 to 2016, but has decreased slightly in 2017 when only reached 9.8 billion m3.[16]
First half of 2018, natural gas exploitation was estimated at 5.3 billion m3, up 1%; liquefied gas was estimated at 437.6 thousand tons, up 18.5% compared to the same period in 2017. Natural gas production was likely to not increase in 2018 when output by the end of 10 months of 2018 reaches 8.39 billion m3.[16] That shows the overall picture of the mining industry in general, the gas industry in particular is increasingly gaining development, basically meeting the requirements, there is no shortage of supply.[17]
However, after 2020, Vietnam's natural gas fields will decline and it is necessary to import tens of billions of cubic meters of liquefied petroleum gas (LPG) to supply power plants. Current gas fields are sufficient to meet 100% of domestic demand, but will begin to decline from 2022. Therefore, in the near future, Vietnam will have to import LPG to serve domestic demand, especially electricity production in gas power plants.[18]
Hydropower
According to theoretical calculations, the total hydropower capacity of our country is about 35,000 MW, of which 60% is concentrated in the North, 27% is distributed in the Central and 13% in the South. Technical potential (potentially feasible to exploit) is about 26,000 MW, equivalent to nearly 970 planned projects, can annually produce more than 100 billion kWh, of which small hydroelectricity comes in particular 800 projects, with a total power of about 15–20 billion kWh/year.[19]
In 2017, reports said that large hydropower power plants with capacity of over 100 MW were almost fully exploited. Plants with favorable locations and low investment costs have also been constructed. Remaining in the near future, small capacity hydropower projects will be invested for exploitation.
According to the assessment, Vietnam's small hydropower potential is about 4,000 MW, of which the source with a capacity of 100 kW-30 MW accounts for 93–95%, while the type of source with a capacity of under 100 kW only accounts for 5 – 7%, with total capacity over 200 MW.[19]
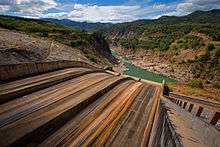
As of 2018, there were 818 hydropower project power plants in the whole country with total installed capacity of 23,182 MW. In which, 385 plants with the total installed capacity of 18,564 MW have been put into operation, 143 projects were being constructed with a total installed capacity of 1,848 MW and 290 investment projects with a total installed capacity of 2,770 MW. There are many dams and hydropower stations in Vietnam.[20]
Total final energy consumption (by sector, by type)
Table : Total Final Consumption (TFC) by source – Viet Nam (KTOE) [21]
.png)
| Year | Coal | Crude oil | Oil products | Natural gas | Geothermal, solar, etc. | Biofuels and waste | Electricity | Heat |
|---|---|---|---|---|---|---|---|---|
| 1990 | 1330 | 0 | 2329 | 0 | 0 | 11868 | 532 | 0 |
| 1995 | 2609 | 0 | 4226 | 22 | 0 | 12152 | 963 | 0 |
| 2000 | 3223 | 0 | 6511 | 18 | 0 | 13413 | 1926 | 0 |
| 2005 | 5272 | 0 | 11333 | 537 | 0 | 13954 | 4051 | 0 |
| 2010 | 9814 | 0 | 16638 | 493 | 0 | 13824 | 7474 | 0 |
| 2015 | 11754 | 0 | 18014 | 1665 | 0 | 14583 | 12338 | 0 |
| 2016 | 14443 | 0 | 20498 | 1599 | 0 | 14741 | 13649 | 0 |
In the sectoral structure in final energy consumption figure in 2006, residential and industrial sectors took the largest percentage part, respectively 41% and 32%. However, compared to 2015 data, the industrial sector had the highest share, correctively 43% and the residential section had a reduction to 27% of energy demand. The energy consumption percentage of the transportation sector change from only 20% in 2006 to 23% in 2015.
For the final energy consumption classified by type of fuel, the amount of electricity consumed increases significantly from 2006 to 2015. Coal consumption, biomass, oil products remain the same from 2010 to 2013. At that time, the growth rate declined significantly, from 7.6% in 2007 to 1.3% in 2012, then gradually increased to 3.5% in 2015.
Energy intensity
Energy efficiency in economic development is expressed through these indicators: Energy intensity, GDP, Final energy consumption, Power consumption, Power intensity, shown in Table:
Table : Energy efficiency in economic development:[22]
| Category | 2000 | 2005 | 2010 | 2015 | 2018 |
| GDP (Billion USD by 2018 price) | 44 | 67.85 | 122.4 | 204.8 | 241.4 |
| Final energy consumption (MTOE) | 25.0 | 35.7 | 48.0 | 54.0 | 63.0 |
| Energy intensity (kgOE/1000 USD) | 568 | 526 | 392 | 264 | 261 |
| Power consumption (TWh) | 22.4 | 45.6 | 85.5 | 151.5 | 192.9 |
| Power intensity (kWh/1000 USD) | 509 | 672 | 698.5 | 739.7 | 798.2 |
Through the data in Table 5, it can be seen that the energy intensity has decreased sharply from 568 kgOE in 2000 to less than half, about 260 kgOE in 2015 – 2018, while the power intensity still tends to gradually increasing over the past two decades, from more than 500 kWh (2000) to nearly 700 – 800 kWh (2015–2018).
Table 6: Energy intensity and power intensity of some countries:[22]
| Indicator | Thailand | China | Korea | Japan | Germany | Vietnam |
| Energy intensity (kgOE/1000 USD) | 199 | 231 | 238 | 154 | 164 | 264 |
| Power intensity (kWh/1000 USD) | 560 | 650 | 350 | 350 | 200 | 740 |
Renewable energy
Emissions from energy sector
After joining the UNFCCC, Vietnam conducts greenhouse gas inventories through the development of the National Notice (NC) and the biennial update report for UNFCCC (BUR). To date, Vietnam has completed the construction of the first and second NCs, BUR1 (2014)[23] and BUR2 (2017).[24][25]
In terms of actual GHG emissions, Vietnam is a country with low total global emissions, particularly in 2013, only emitted about 259 million tons of CO2e out of a total of 36 billion tons of CO2e emission of the world (equivalent to about 0.72%).[25]
In the energy sector in Vietnam, GHG is mainly emitted from fuel combustion and dispersal in the process of fuel extraction and transportation. The total amount of GHG emissions in the energy sector in 2013 was 151.4 million tons CO2e. In particular, fuel combustion activities are common in the electricity production, industry and construction, transportation, agriculture / forestry / fisheries and a number of other sectors. This is a major activity of GHG production, accounting for 86.1% of the total GHG emissions nationwide. In particular, with the consumption of large amounts of fuel, accounting for about 60% of total fuel consumption, transportation activities also emit a significant amount of GHG into the atmosphere. The transportation sector emits about 30 million tons of CO2e, the emissions increase rapidly over the years, more than doubling from 12.58 million tons of CO2e (in 2000) to 29.7 million tons of CO2e (in 2013). Meanwhile, road traffic emissions accounted for 90.9%, railway, waterway and airway traffic emissions accounted for nearly 10%, the civil aviation industry also had significant and increasing GHG emissions.[25]
According to research from the International Energy Agency (IEA), the process of using energy causes GHG emissions to account for the largest proportion, about 60% of global GHG emissions annually. Also, Vietnam's GHG emissions will increase 2.7 times and 4.6 times in 2020 and 2030 compared to 2010 emissions. One of the main measures to reduce GHG emissions in the industry energy is implementing energy saving and effective use.[26]
Table 7: Trends of emissions/removals among inventory cycles [24]
|
Year |
Sectors (Unit: ktCO2e) | |||||
|---|---|---|---|---|---|---|
| Energy | Industrial Processes | Agriculture | LULUCF | Waste | Total | |
| 1994 | 25,637.0 | 3,807.0 | 52,445.0 | 19,378.0 | 2,565.0 | 103,832.0 |
| 2000 | 52,774.0 | 10,006.0 | 65,091.0 | 15,105.0 | 7,925.0 | 150,901.0 |
| 2010 | 146,170.7 | 21,682.4 | 87,602.0 | -20,720.7 | 17,887.0 | 252,621.5 |
| 2013 | 151,402.5 | 31,767.4 | 89,407.8 | -34,239.8 | 20,686.2 | 259,024.1 |
| Table 8: CO2 emission table in Vietnam (Unit: KT-C: kilotonnes of CO2) | |||||||||||
| 2006 | 2007 | 2008 | 2009 | 2010 | 2011 | 2012 | 2013 | 2014 | 2015 | 2016 | |
|---|---|---|---|---|---|---|---|---|---|---|---|
| Total CO2 Emission | 23728 | 25340 | 28504 | 31140 | 34087 | 34951 | 34784 | 36273 | 39215 | 47352 | 51893 |
| 1.CO2 Emission by Energy | 23728 | 25340 | 28504 | 31140 | 34087 | 34951 | 34784 | 36273 | 39215 | 47352 | 51893 |
| 1.1 Coal & Coal Products | 10149 | 10868 | 13494 | 14177 | 16529 | 17510 | 17711 | 19344 | 22393 | 27911 | 31296 |
| 1.2 Crude Oil & Petroleum Products | 10248 | 10851 | 10905 | 12414 | 12354 | 12598 | 11786 | 11470 | 11269 | 14142 | 15299 |
| 1.3 Gas | 3330 | 3621 | 4105 | 4549 | 5204 | 4843 | 5287 | 5459 | 5553 | 5298 | 5298 |
| 2.CO2 Emission by Sector | 23728 | 25340 | 28504 | 31140 | 34087 | 34951 | 34784 | 36273 | 39215 | 47352 | 51893 |
| 2.1 Transformation Sector | 7491 | 8010 | 8448 | 8824 | 11332 | 11000 | 11328 | 12146 | 13698 | 20309 | 23380 |
| 2.1.1 Public Utilities | 7491 | 6955 | 7448 | 8214 | 11332 | 11000 | 11328 | 12146 | 13698 | 20309 | 23380 |
| 2.1.2 Auto-Generation | 0 | 930 | 888 | 610 | 0 | 0 | 0 | 0 | 0 | 0 | 0 |
| 2.1.3 Gas Processing | 0 | 0 | 0 | 0 | 0 | 0 | 0 | 0 | 0 | 0 | 0 |
| 2.1.4 Own Use & Loss | 0 | 125 | 112 | 0 | 0 | 0 | 0 | 0 | 0 | 0 | 0 |
| 2.2 Final Energy Consumption Sector | 16237 | 17329 | 20056 | 22316 | 22755 | 23951 | 23457 | 24127 | 25517 | 27042 | 28513 |
| 2.2.1 Industry Sector | 7137 | 8726 | 10782 | 10654 | 11147 | 11717 | 11580 | 12179 | 14072 | 16319 | 16236 |
| 2.2.2 Transport Sector | 6238 | 6659 | 7107 | 8460 | 8277 | 8888 | 8779 | 8622 | 8222 | 6561 | 7270 |
| 2.2.3 Residential & Commercial | 2740 | 2714 | 2720 | 2750 | 2911 | 2897 | 2685 | 2929 | 2842 | 3645 | 4555 |
| 2.2.4 Other | 121 | −769 | −554 | 452 | 420 | 448 | 412 | 397 | 381 | 516 | 452 |
| Source:[27] | |||||||||||
See also
References
- MOIT & DEA (2017). "Vietnam Energy Outlook Report 2017" (PDF).
- Thế Hoàng (2018-12-08). "Chi nhập khẩu than cao kỷ lục, vượt 2 tỷ USD". Đầu Tư online.
- Đức Quỳnh (2019-01-11). "Nhu cầu than Việt Nam 2019 dự kiến vượt sản lượng". VietnamBiz.
- T.N.D (2019-04-09). "Ngành than bán trên 10,5 triệu tấn, thu về gần 17.000 tỉ đồng". cafef.vn.
- HỘI ĐỒNG PHẢN BIỆN TẠP CHÍ NĂNG LƯỢNG VIỆT NAM (2019-02-21). "Nhập khẩu than cho điện và phản biện của Tạp chí Năng lượng Việt Nam". Năng lượng Việt Nam.
- Duyên Duyên (2018-12-05). "Việt Nam nhập khẩu hơn 2 tỷ USD than đá". VnEconomy.
- Lương Bằng (2019-03-25). "Thiếu than vẫn xin xuất hàng triệu tấn: Trung Quốc từ chối, hàng Việt ế". VIETNAMNET.
- Phan Ngô Tống Hưng & Nguyễn Thành Sơn (2018-04-16). "Nhập khẩu than của Việt Nam: Hiện trạng và xu thế". Năng lượng Việt Nam.
- Trần, Hương Giang (2019-06-12). "Nhập khẩu than và sự vào cuộc của TKV". VINACOMIN.
- Phan Vũ (2019-07-01). "Bùng nổ ngành năng lượng Việt Nam: Năng lượng tái tạo có đuổi kịp 'vua' than?". stockbiz.vn.
- An Bình (2018-07-31). "Vì sao lợi nhuận PVN cao đột biến, vượt Viettel để trở thành tập đoàn có lãi lớn nhất Việt Nam?". cafef.vn (in Vietnamese).
- Mỹ Hạnh (2019-01-12). "Khai thác dầu khí giảm hơn 1 triệu tấn năm 2018". vnmedia.vn (in Vietnamese).
- Thái Bình (2019-03-18). "Dầu thô xuất giảm, nhập tăng". PETROVIETNAM – PV OIL (in Vietnamese).
- Duyên Duyên (2019-03-03). "Nhập khẩu dầu thô hai tháng đầu năm tăng gấp 16,6 lần năm ngoái". VnEconomy (in Vietnamese).
- T.T (2018-10-22). "Thách thức trong thăm dò khai thác dầu khí và những kiến nghị từ PVN". Báo Lao Động (in Vietnamese).
- "Triển vọng ngành dầu khí 2019: Vẫn sáng". Đầu tư Chứng khoán. 2019-02-04.
- PetroVietnam (2018-11-15). "Thách thức và triển vọng thị trường gas Việt Nam". PETROVIETNAM PV Drilling.
- Tú Mỹ (2018-11-15). "Khí thiên nhiên suy giảm, Việt Nam phải nhập khí hóa lỏng từ sau năm 2020". TRITHUCVN.
- Đặng, Đình Thống (2017-10-20). "Phát triển thủy điện ở Việt Nam: Tiềm năng và thách thức". Năng lượng Việt Nam.
- Đinh Liên (2018-08-15). "385 công trình thủy điện đang vận hành trên cả nước". EVN – Tập đoàn điện lực Việt Nam.
- "Statistics". www.iea.org. Retrieved 2019-07-11.
- Nguyễn, Mạnh Hiến (2019-01-09). "Năng lượng Việt Nam: Hiện trạng và triển vọng phát triển". TẠP CHÍ NĂNG LƯỢNG VIỆT NAM.
- MONRE (2014). "The Initial Biennial Updated Report Of Viet Nam To The United Nations Framework Convention On Climate Change" (PDF). csdl.dcc.gov.vn.
- MONRE (2017). "The Second Biennial Updated Report Of Viet Nam To The United Nations Framework Convention On Climate Change" (PDF). unfccc.int.
- Hà Linh (2019-04-12). "Thực trạng phát thải khí nhà kính ở Việt Nam". ncif.gov.vn.
- Vụ Tiết kiệm năng lượng và Phát triển bền vững (2018-11-08). ""Chương trình năng lượng phát thải thấp Việt Nam" – Thúc đẩy nỗ lực tiết kiệm năng lượng ngành công nghiệp tại Việt Nam". MOIT website.
- Expert Group on Energy Data and Analysis (EGEDA) (2018-09-27). "CO2 Emission Table". APEC – Asia Pacific Economic Cooperation.
Energy in Asia | |
|---|---|
| Sovereign states |
|
| States with limited recognition | |
| Dependencies and other territories | |
| |
| History |
|  | |||||||||||||||
|---|---|---|---|---|---|---|---|---|---|---|---|---|---|---|---|---|---|
| Geography |
| ||||||||||||||||
| Politics |
| ||||||||||||||||
| Economy | |||||||||||||||||
| Society |
| ||||||||||||||||
[Vietnam Energy Portal]: http://vietnamep.com