Energy in Lithuania
Lithuania is a net energy importer. Primary energy use in Lithuania was 98 TWh, or 29 TWh per million people in 2009.[1]
Systematic diversification of energy imports and resources is Lithuania's key energy strategy.[2] Long term aims were defined in the National Energy Independence strategy in 2012 by Lietuvos Seimas.[3] It was estimated that strategic energy independence initiatives will cost €6.3–7.8 billion in total and provide annual savings of €0.9-1.1 billion.
Overview
| Capita (million) |
Prim. energy (TWh) |
Production (TWh) |
Import (TWh) |
Electricity (TWh) |
CO2-emission (Mt) | |
|---|---|---|---|---|---|---|
| 2004 | 3.44 | 106.5 | 60.6 | 49.1 | 10.8 | 12.7 |
| 2007 | 3.38 | 107.6 | 44.2 | 66.6 | 11.5 | 14.4 |
| 2008 | 3.36 | 106.8 | 44.8 | 62.2 | 12.0 | 14.2 |
| 2009 | 3.34 | 97.6 | 49.0 | 48.6 | 11.5 | 12.4 |
| 2012 | 3.20 | 84.8 | 17.8 | 69.1 | 10.7 | 13.2 |
| 2012R | 2.99 | 85.8 | 18.1 | 68.7 | 10.8 | 13.3 |
| 2013 | 2.96 | 81.1 | 19.1 | 63.3 | 10.8 | 10.7 |
| Change 2004-09 | -2.9% | -8.4% | -19.2% | -0.9% | 6.0% | -2.3% |
| Mtoe = 11.63 TWh, Prim. energy includes energy losses 2012R = CO2 calculation criteria changed, numbers updated | ||||||
Natural gas
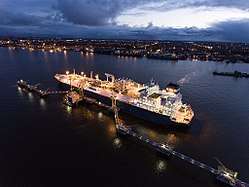
In order to break down Gazprom's monopoly[5][6] in the natural gas market of Lithuania, Klaipėda LNG FSRU, the first large scale LNG import terminal in the Baltic region, was built in port of Klaipėda in 2014. Equinor will be supplying 540 million cubic meters of natural gas annually from 2015 until 2020.[7] The terminal is able to meet all of Lithuania's demand, and 90% of Latvia's and Estonia's national demand in the future.[8]
Gas Interconnection Poland–Lithuania (GIPL), also known as the Lithuania–Poland pipeline, is a proposed natural gas pipeline interconnection between Lithuania and Poland that is expected to be finished by 2019.
Natural gas companies in Lithuania include Lietuvos Dujos.
Electricity
Lithuania imports 70% of its power, mostly from Sweden, and the average price of electricity is among the highest in the EU.[9][10][11] In 2015, transmission lines connected Lithuania to Sweden (700MW) and Poland (500MW).
Renewable energy

In 2016 Renewable energy in Lithuania constituted 27.9% of the country's overall electricity generation.[12][13] Previously, the Lithuanian government aimed to generate 23% of total power from renewable resources by 2020. This goal was achieved in 2014, with 23.9% of power being from renewable sources.
With new installed wind capacity of 178 MW in 2016, and an average power consumption of 1.1 GW, Lithuania was the EU Member State with the highest level of new wind capacity installed in 2016 relative to its power consumption.[14]
Kruonis Pumped Storage Plant provides energy storage, averaging electrical demand throughout the day. The pumped storage plant has a capacity of 900 MW (4 units, 225 MW each). Kaunas Hydroelectric Power Plant has 100 MW of capacity and supplies about 3% of the electrical demand in Lithuania.[15]
See also
| Wikimedia Commons has media related to Energy in Lithuania. |
References
- IEA Key energy statistics 2010 Page: Country specific indicator numbers from page 48
- "Lithuania's Energy Sector Development Trends" (PDF). www.lsta.lt. p. 2. Retrieved 7 April 2018.
- "National Energy Independence Strategy" (PDF). gamyba.le.lt. Retrieved 13 April 2018.
- IEA Key World Energy Statistics Statistics 2015, 2014 (2012R as in November 2015 + 2012 as in March 2014 is comparable to previous years statistical calculation criteria, 2013, 2012, 2011, 2010, 2009 Archived 2013-10-07 at the Wayback Machine, 2006 Archived 2009-10-12 at the Wayback Machine IEA October, crude oil p.11, coal p. 13 gas p. 15
- "Lithuania becomes first ex-Soviet state to buy US natural gas". FT.COM (in Lithuanian). Retrieved 26 March 2018.
- "Lithuania breaks Gazprom's monopoly by signing first LNG deal". www.euractiv.com (in Lithuanian). Retrieved 26 March 2018.
- "Klaipėda LNG terminal Factsheet" (PDF). Ministry of Energy of the Republic of Lithuania. October 27, 2014. Retrieved 19 March 2018.
- "Klaipėda LNG Terminal one year on – independence or responsibility?". LRT.LT. November 11, 2015. Retrieved 19 March 2018.
- Electricity and natural gas price statistics EuroStat, May 2015.
- Current electricity flows Archived 2015-12-18 at the Wayback Machine
- http://www.institutdelors.eu/media/balticstateseu-energypolicy-grigas-ne-jdi-july13.pdf?pdf=ok
- "Archived copy" (PDF). Archived from the original (PDF) on 2012-07-10. Retrieved 2018-04-13.CS1 maint: archived copy as title (link)
- "Wind in power - 2016 European statistics" (PDF). Wind Europe. p. 18. Retrieved 21 March 2018.
- "Kauno HE modernizavimas" (in Lithuanian). Lietuvos Energija. Archived from the original on 2007-07-22. Retrieved 2008-01-09.
.svg.png)
| History |
|  | ||||||||
|---|---|---|---|---|---|---|---|---|---|---|
| Geography | ||||||||||
| Politics |
| |||||||||
| Economy | ||||||||||
| Society |
| |||||||||